From version 5.0 onward, Marvel is part of X-Pack. For more information, see
Monitoring the Elastic Stack.
Node & Index Statistics
edit
IMPORTANT: This documentation is no longer updated. Refer to Elastic's version policy and the latest documentation.
Node & Index Statistics
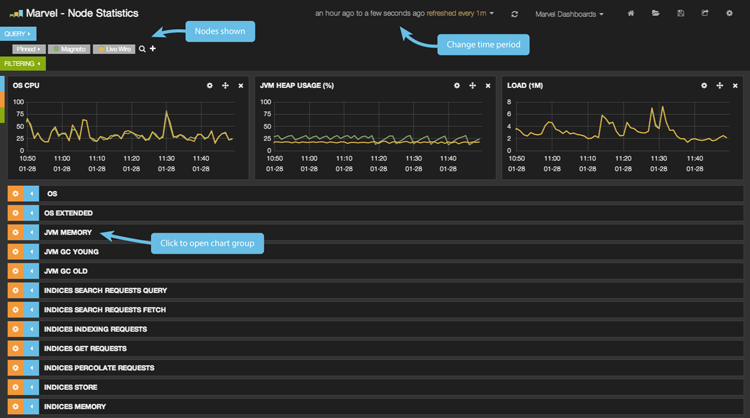
editThe Node Statistics dashboard displays metric charts from the perspective of one or more nodes. Metrics include hardware level metrics (like load and CPU usage), process and JVM metrics (memory usage, GC), and node level Elasticsearch metrics such as field data usage, search requests rate and thread pool rejection.
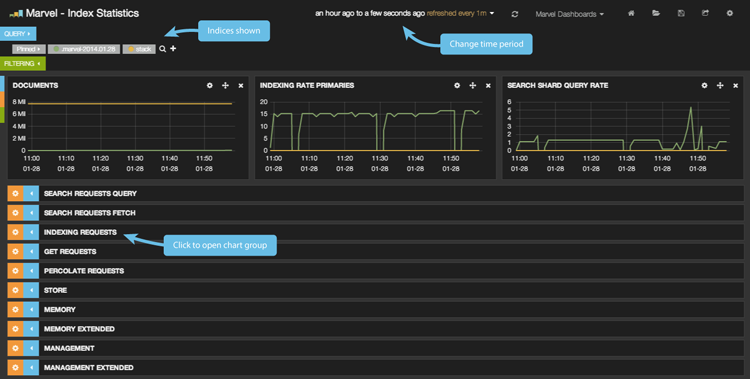
The Index Statistics dashboard is very similar to the Node Statistics dashboard, but it shows you all the metrics from the perspective of one or more indices. The metrics are per index, with data aggregated from all of the nodes in the cluster. For example, the 'store size' chart shows the total size of the index data across the whole cluster.

