Forecast future behavior
editForecast future behavior
editAfter your anomaly detection job creates baselines of normal behavior for your data, you can use that information to extrapolate future behavior.
You can use a forecast to estimate a time series value at a specific future date. For example, you might want to determine how many users you can expect to visit your website next Sunday at 0900.
You can also use it to estimate the probability of a time series value occurring at a future date. For example, you might want to determine how likely it is that your disk utilization will reach 100% before the end of next week.
Each forecast has a unique ID, which you can use to distinguish between forecasts that you created at different times. You can create a forecast by using the forecast anomaly detection jobs API or by using Kibana. For example:
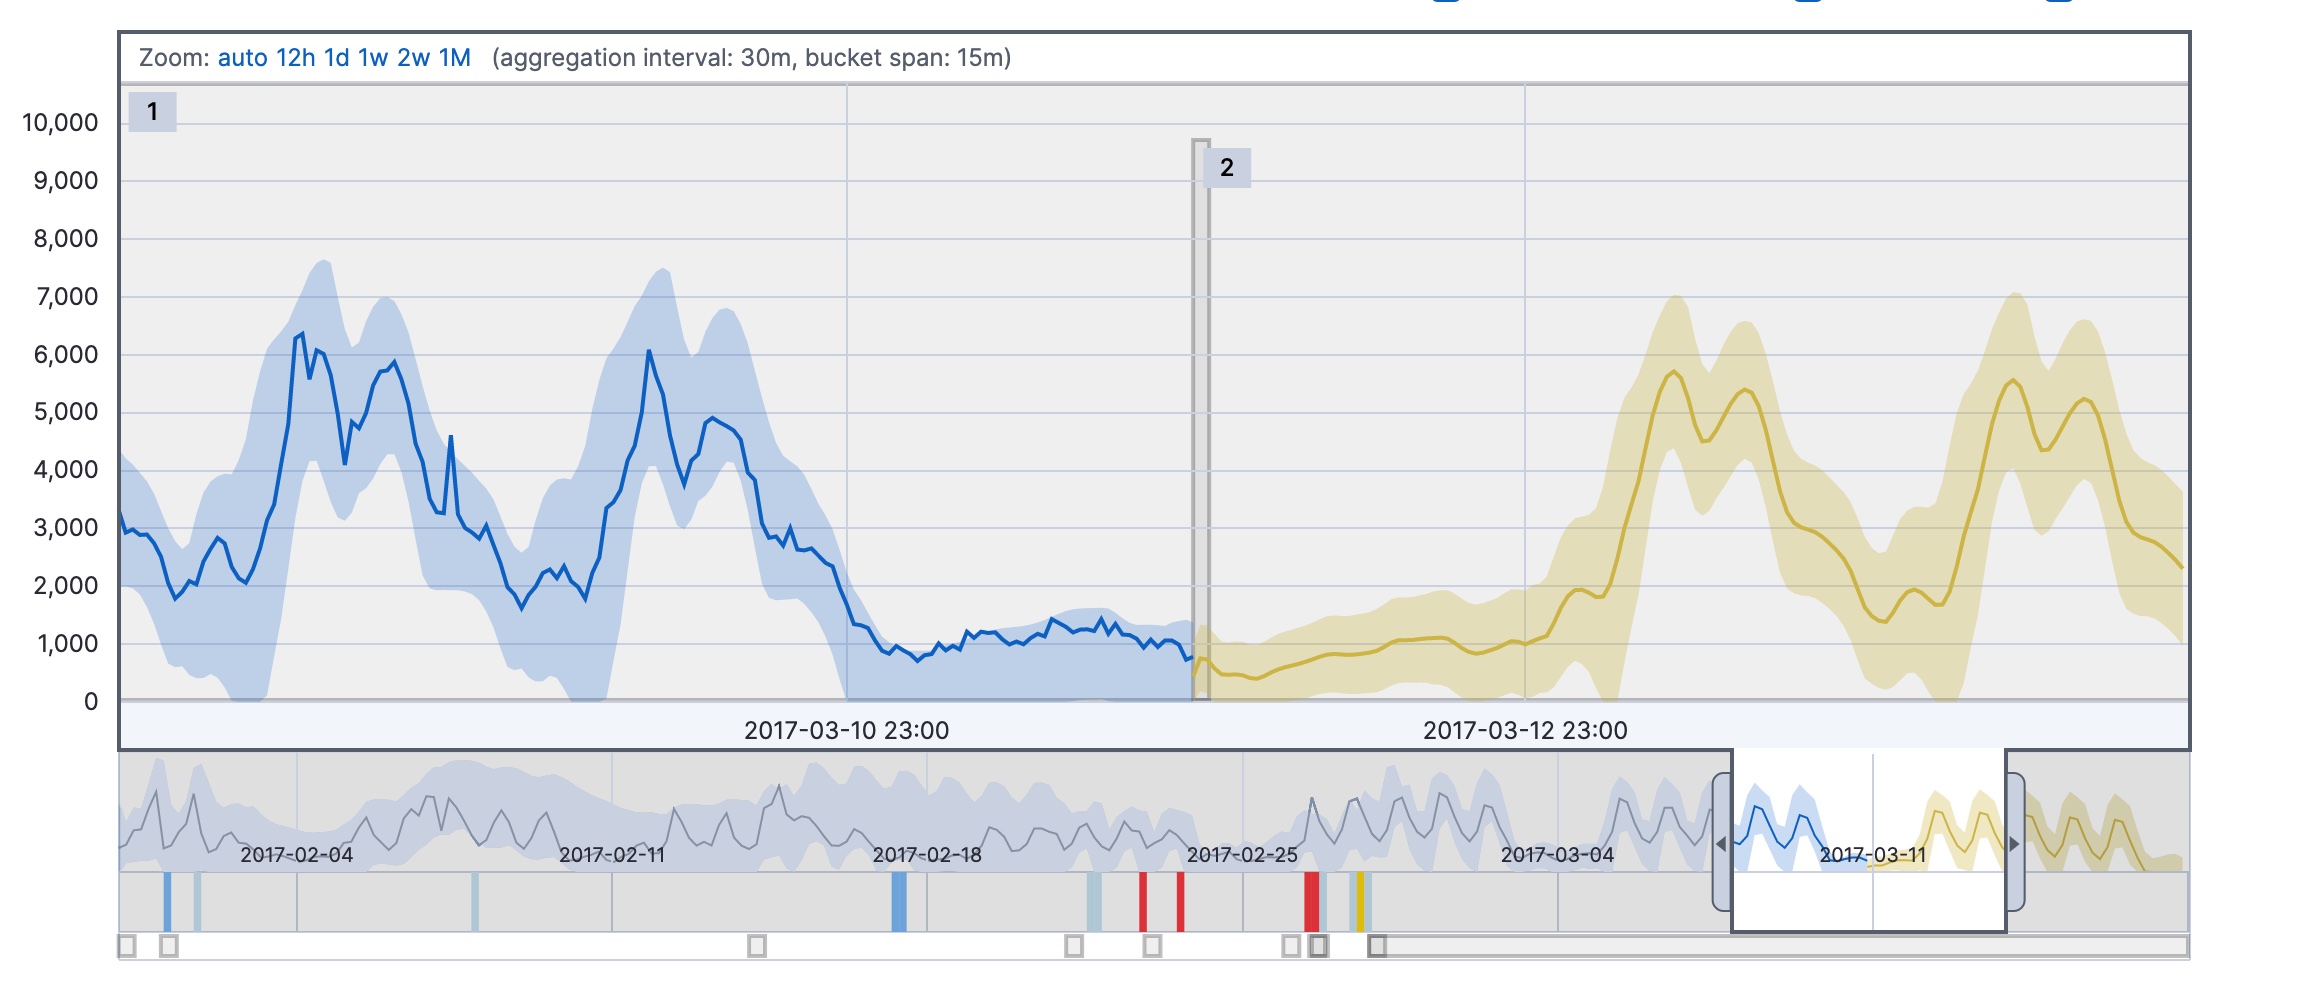
The yellow line in the chart represents the predicted data values. The shaded yellow area represents the bounds for the predicted values, which also gives an indication of the confidence of the predictions.
When you create a forecast, you specify its duration, which indicates how far the forecast extends beyond the last record that was processed. By default, the duration is 1 day. Typically the farther into the future that you forecast, the lower the confidence levels become (that is to say, the bounds increase). Eventually if the confidence levels are too low, the forecast stops. For more information about limitations that affect your ability to create a forecast, see Unsupported forecast configurations.
You can also optionally specify when the forecast expires. By default, it
expires in 14 days and is deleted automatically thereafter. You can specify a
different expiration period by using the expires_in parameter in the
forecast anomaly detection jobs API.