Create forecasts
editCreate forecasts
editIn addition to detecting anomalous behavior in your data, you can use the machine learning features to predict future behavior.
To create a forecast in Kibana:
-
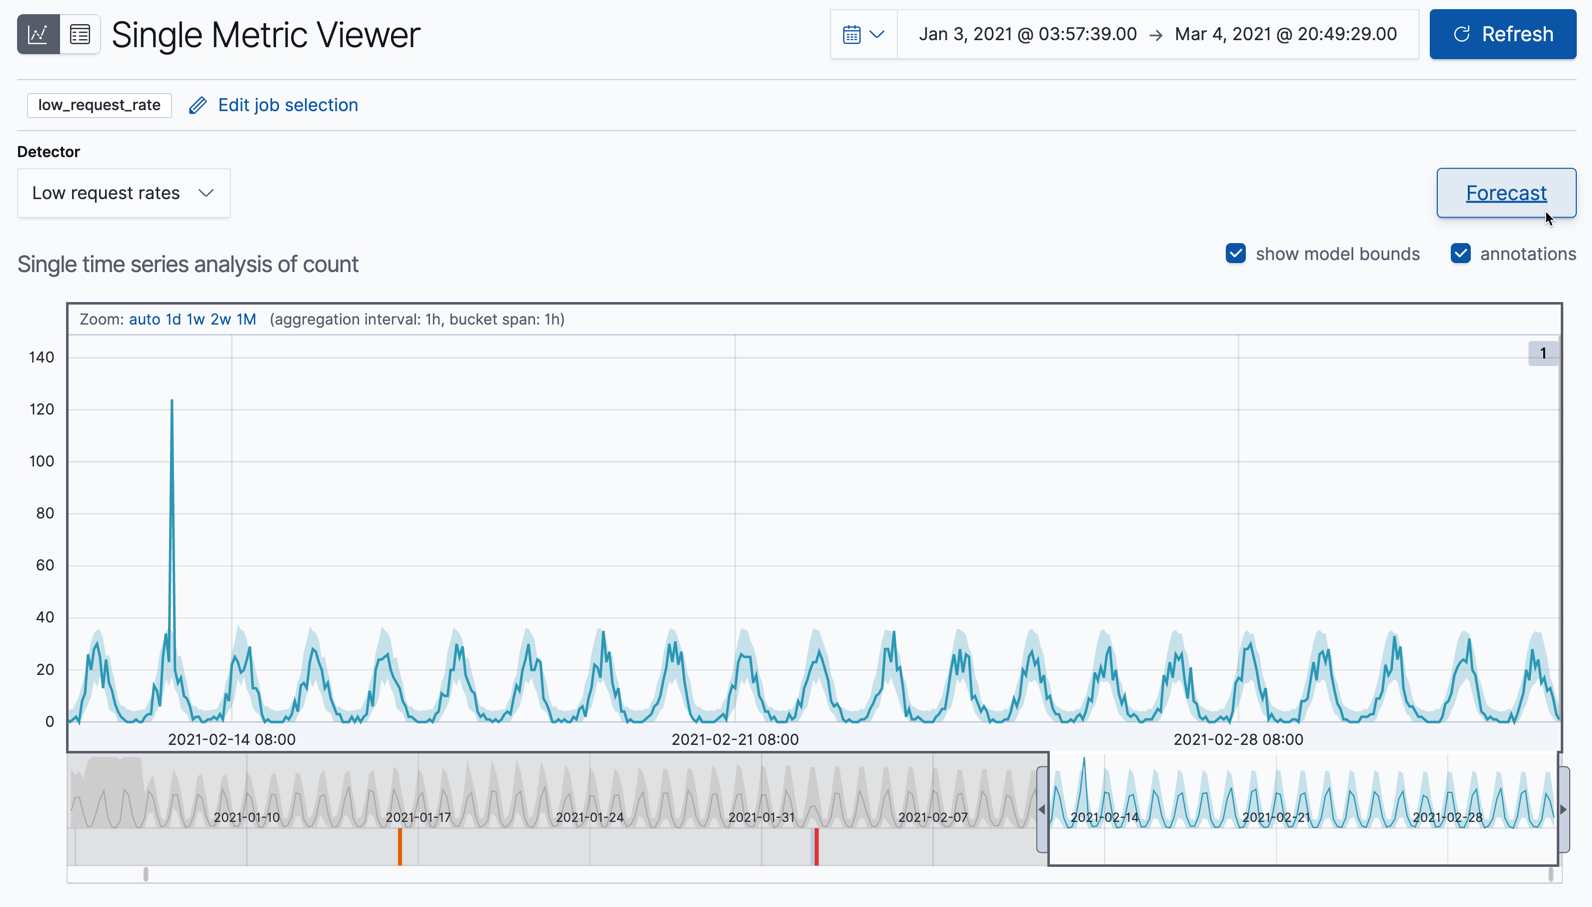
View your job results (for example, for the
low_request_ratejob) in the Single Metric Viewer. To find that view, follow the link in the Actions column on the Anomaly Detection page. -
Click Forecast.
-
Specify a duration for your forecast. This value indicates how far to extrapolate beyond the last record that was processed. You must use time units. In this example, the duration is one week (
1w):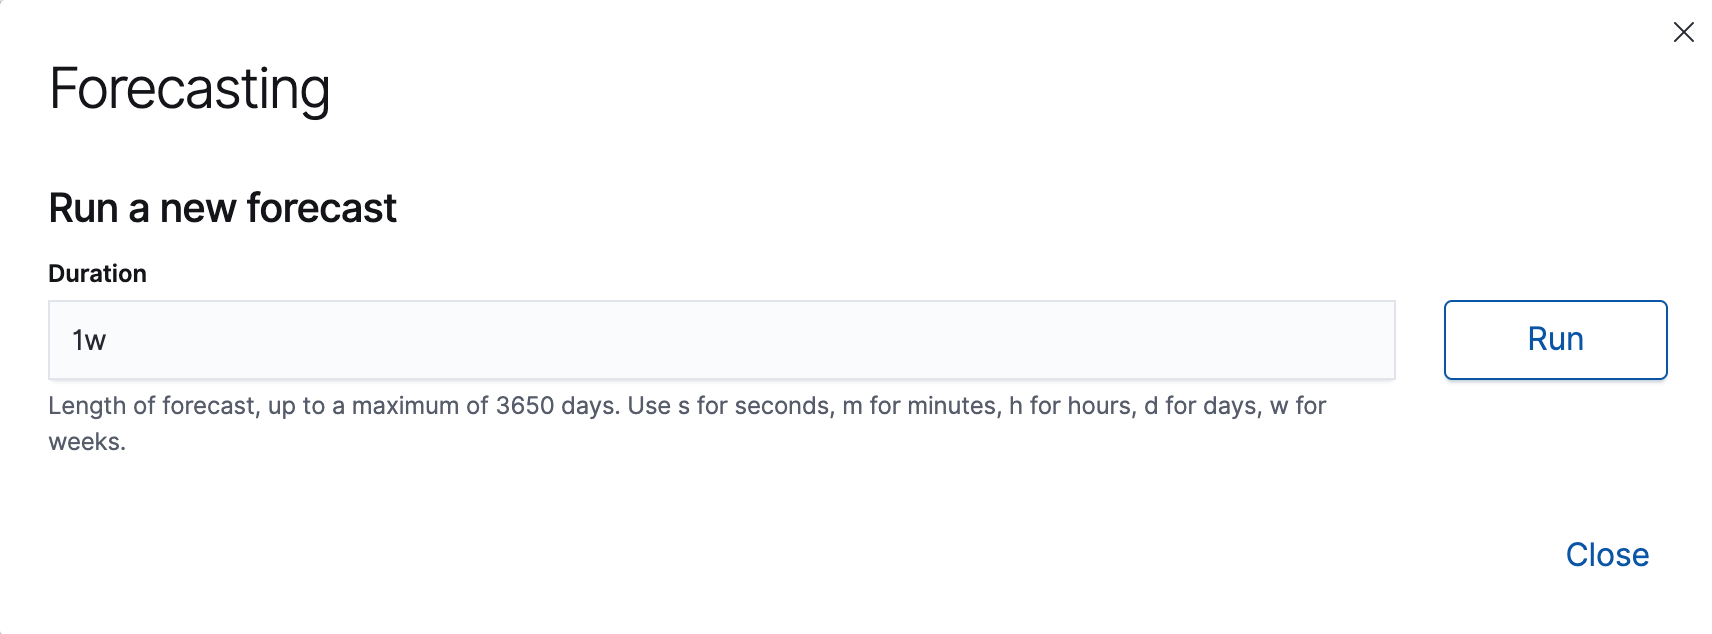
-
View the forecast in the Single Metric Viewer:
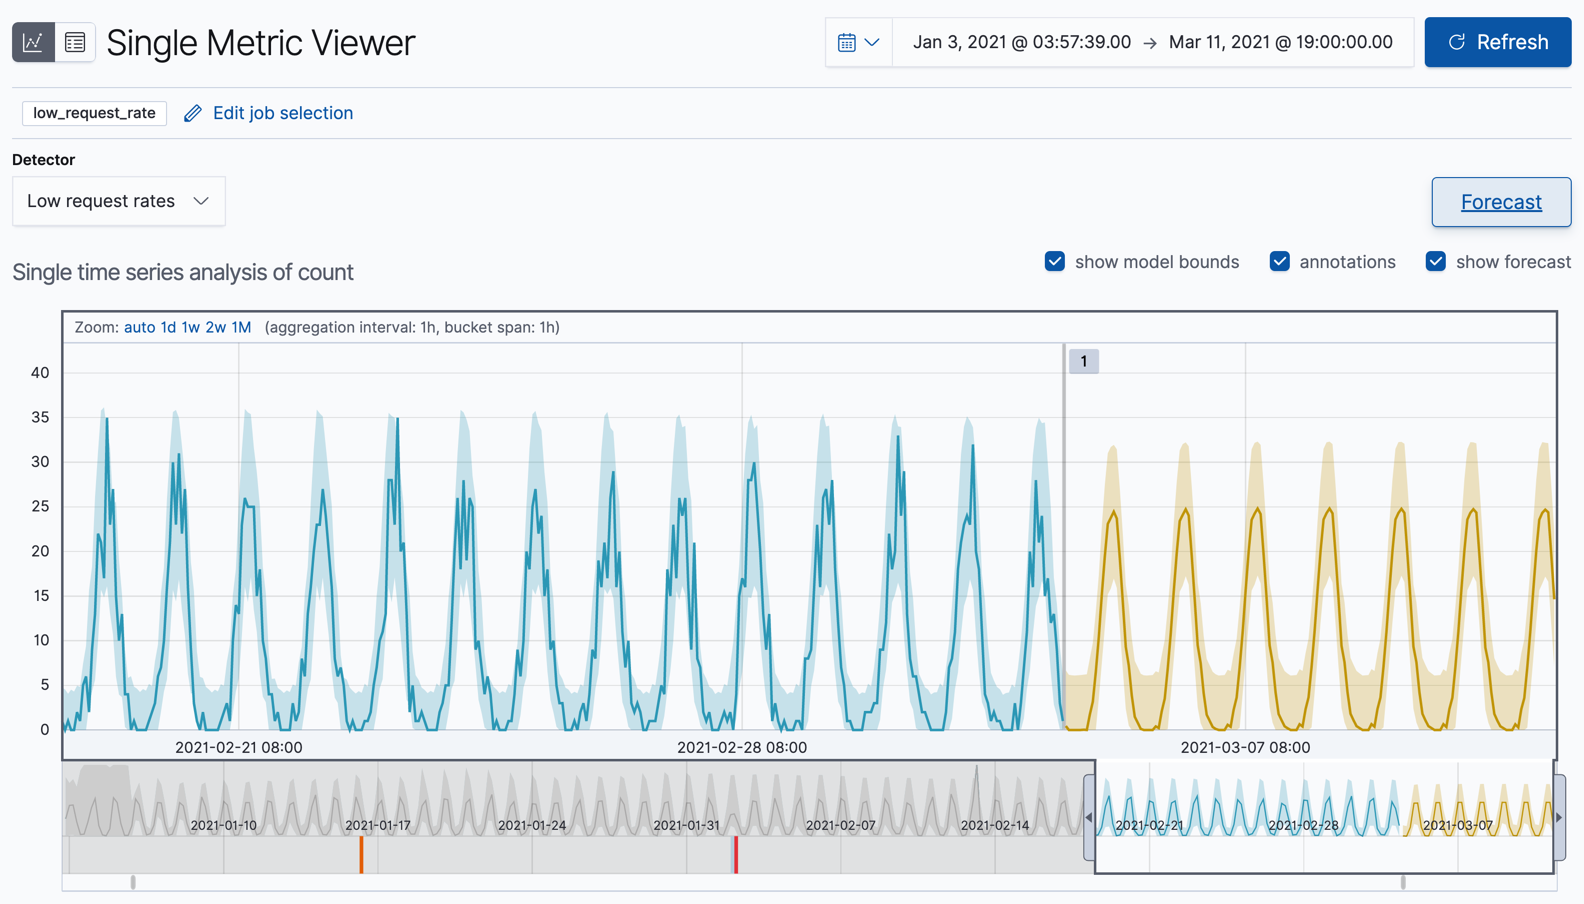
The yellow line in the chart represents the predicted data values. The shaded yellow area represents the bounds for the predicted values, which also gives an indication of the confidence of the predictions. Note that the bounds generally increase with time (that is to say, the confidence levels decrease), since you are forecasting further into the future. Eventually if the confidence levels are too low, the forecast stops.
-
Optional: Compare the forecast to actual data.
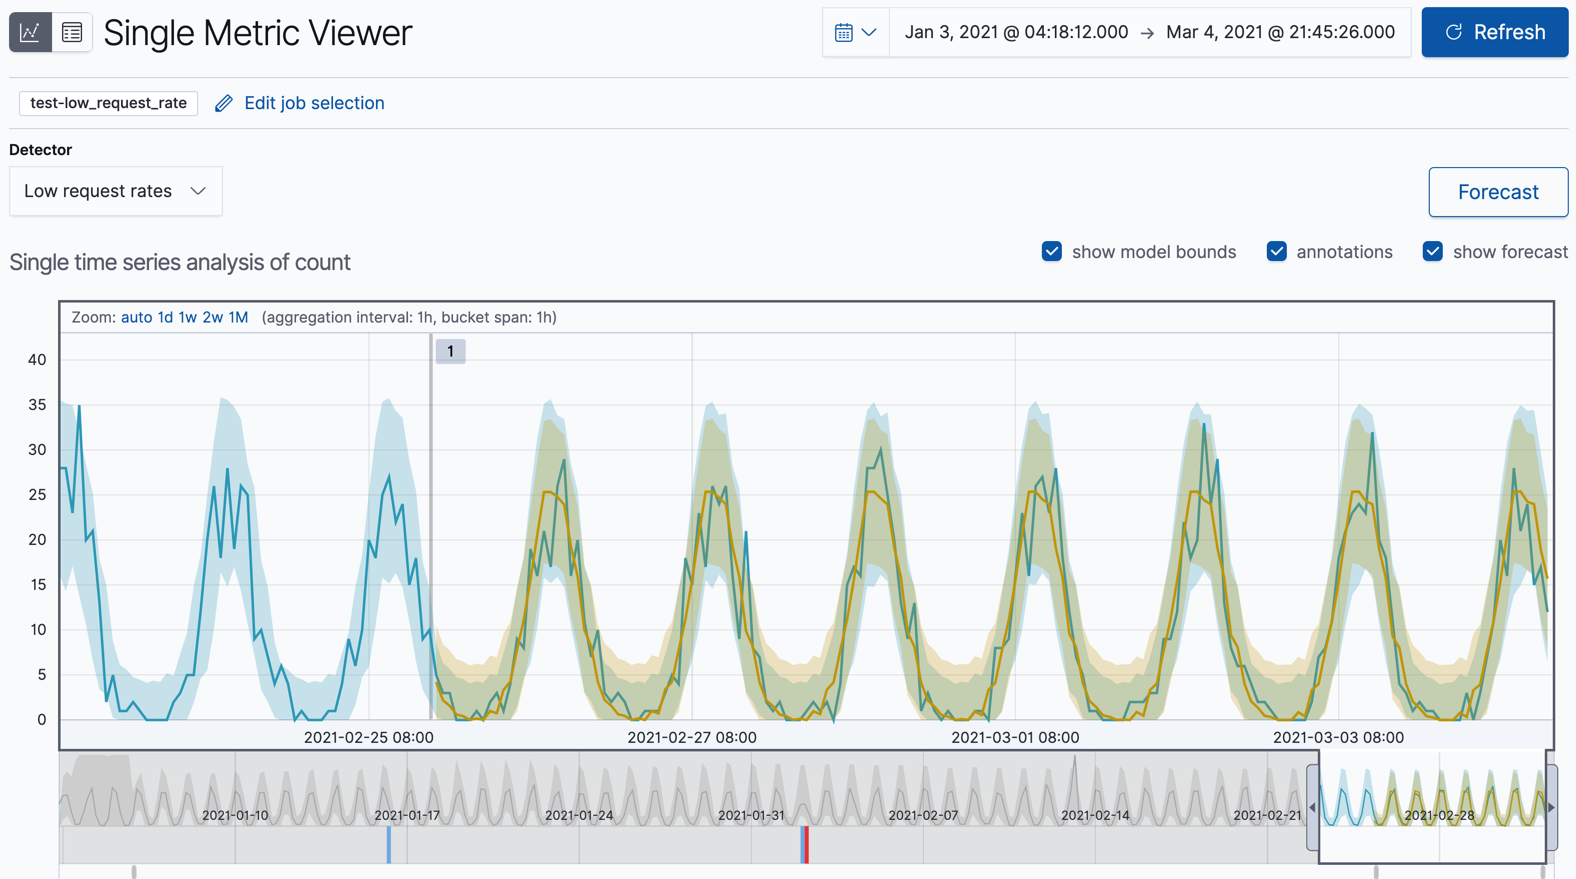
As the job processes more data, you can click the Forecast button again and choose to see one of your forecasts overlaid on the actual data. The chart then contains the actual data values, the bounds for the expected values, the anomalies, the forecast data values, and the bounds for the forecast. This combination of actual and forecast data gives you an indication of how well the machine learning features can extrapolate the future behavior of the data.
To generate this comparison for the Kibana sample data, use only a subset of the data when you create the job. For example, follow the steps in Create anomaly detection jobs but add a different job ID prefix and deselect the Use full kibana_sample_data_logs data option. Choose a date part way through your sample data as the end date. By default, the datafeed stops and the anomaly detection job closes when it reaches that date. Create the forecast. You can then restart the datafeed to process the remaining data and generate the type of results shown here.
The Kibana sample data sets have timestamps that are relative to when you added the data sets. However, some of these dates are in the future. Therefore, for the purposes of this tutorial, when you restart your datafeed do not use the No end time (Real-time search) option. Specify the appropriate end dates so that it processes all of the data immediately.
Now that you have seen how easy it is to create forecasts with the sample data, consider what type of events you might want to predict in your own data. For more information and ideas, as well as a list of limitations related to forecasts, see Forecasting the future.