Finding outliers in the eCommerce sample data
editFinding outliers in the eCommerce sample data
editThis functionality is in beta and is subject to change. The design and code is less mature than official GA features and is being provided as-is with no warranties. Beta features are not subject to the support SLA of official GA features.
The goal of outlier detection is to find the most unusual documents in an index. Let’s try to detect unusual customer behavior in the eCommerce sample data set.
-
Verify that your environment is set up properly to use machine learning features. If the Elasticsearch security features are enabled, you need a user that has authority to create and manage data frame analytics jobs. See Setup and security.
Since we’ll be creating transforms, you also need
manage_data_frame_transformscluster privileges. -
Create a transform that generates an entity-centric index with numeric or boolean data to analyze.
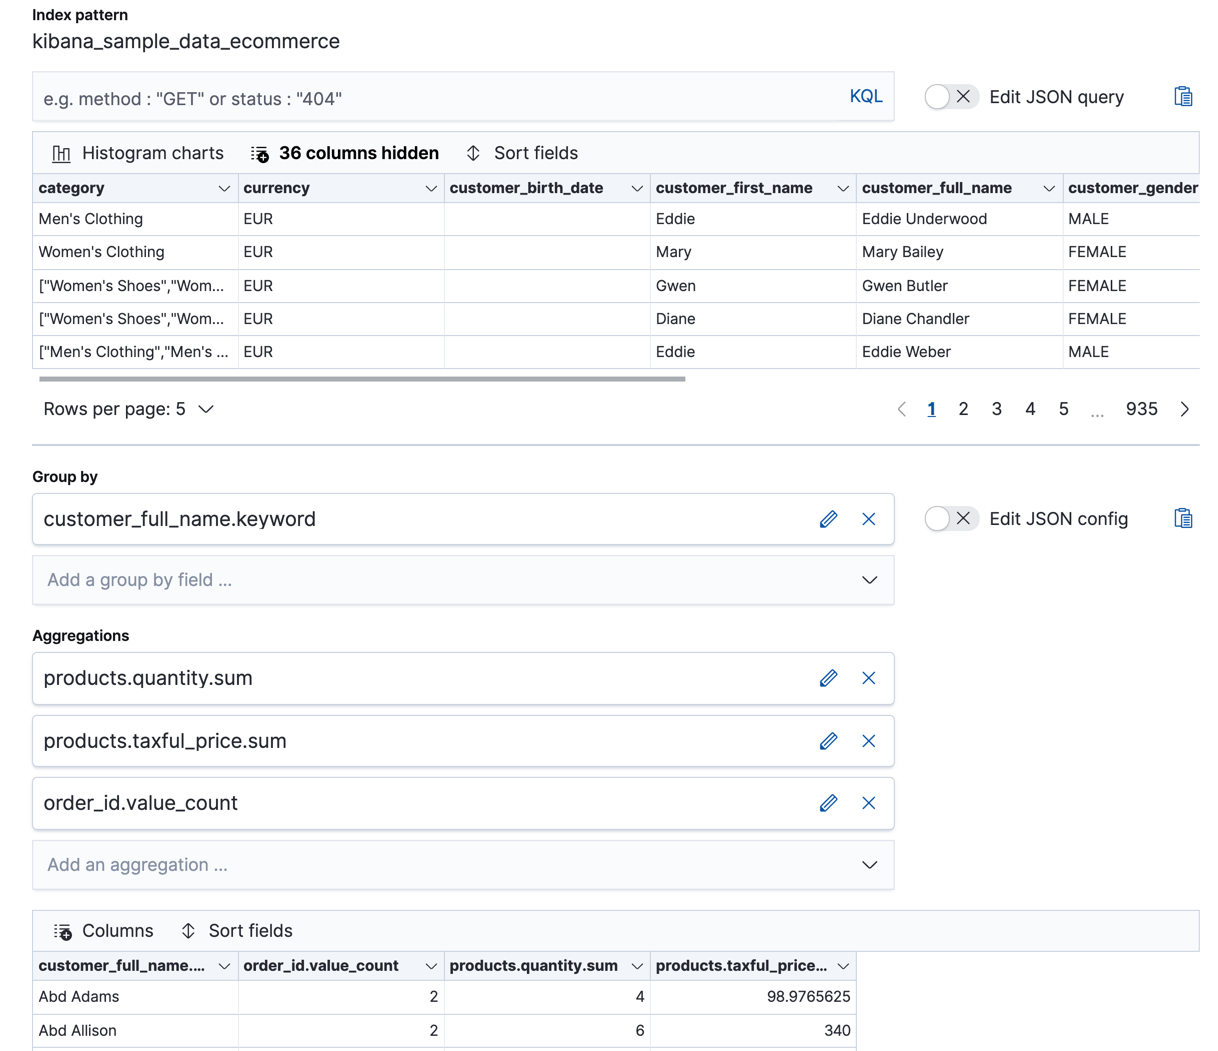
In this example, we’ll use the eCommerce orders sample data and pivot the data such that we get a new index that contains a sales summary for each customer.
In particular, create a transform that calculates the sum of the products (
products.quantity) and the sum of prices (products.taxful_price) in all of the orders, grouped by customer (customer_full_name.keyword). Also include a value count aggregation, so that we know how many orders (order_id) exist for each customer.You can preview the transform before you create it in Stack Management > Transforms:
Alternatively, you can use the preview transform API and the create transform API.
API example
POST _data_frame/transforms/_preview
{
  "source": {
    "index": [
      "kibana_sample_data_ecommerce"
    ]
  },
  "pivot": {
    "group_by": {
      "customer_full_name.keyword": {
        "terms": {
          "field": "customer_full_name.keyword"
        }
      }
    },
    "aggregations": {
      "products.quantity.sum": {
        "sum": {
          "field": "products.quantity"
        }
      },
      "products.taxful_price.sum": {
        "sum": {
          "field": "products.taxful_price"
        }
      },
      "order_id.value_count": {
        "value_count": {
          "field": "order_id"
        }
      }
    }
  }
}

PUT _data_frame/transforms/ecommerce-customer-sales
{
  "source": {
    "index": [
      "kibana_sample_data_ecommerce"
    ]
  },
  "pivot": {
    "group_by": {
      "customer_full_name.keyword": {
        "terms": {
          "field": "customer_full_name.keyword"
        }
      }
    },
    "aggregations": {
      "products.quantity.sum": {
        "sum": {
          "field": "products.quantity"
        }
      },
      "products.taxful_price.sum": {
        "sum": {
          "field": "products.taxful_price"
        }
      },
      "order_id.value_count": {
        "value_count": {
          "field": "order_id"
        }
      }
    }
  },
  "description": "E-commerce sales by customer",
  "dest": {
    "index": "ecommerce-customer-sales"
  }
}
For more details about creating transforms, see Transforming the eCommerce sample data.
-
Start the transform.
Even though resource utilization is automatically adjusted based on the cluster load, a transform increases search and indexing load on your cluster while it runs. If you’re experiencing an excessive load, however, you can stop it.
You can start, stop, and manage transforms in Kibana. Alternatively, you can use the start transforms API.
API example
POST _data_frame/transforms/ecommerce-customer-sales/_start
-
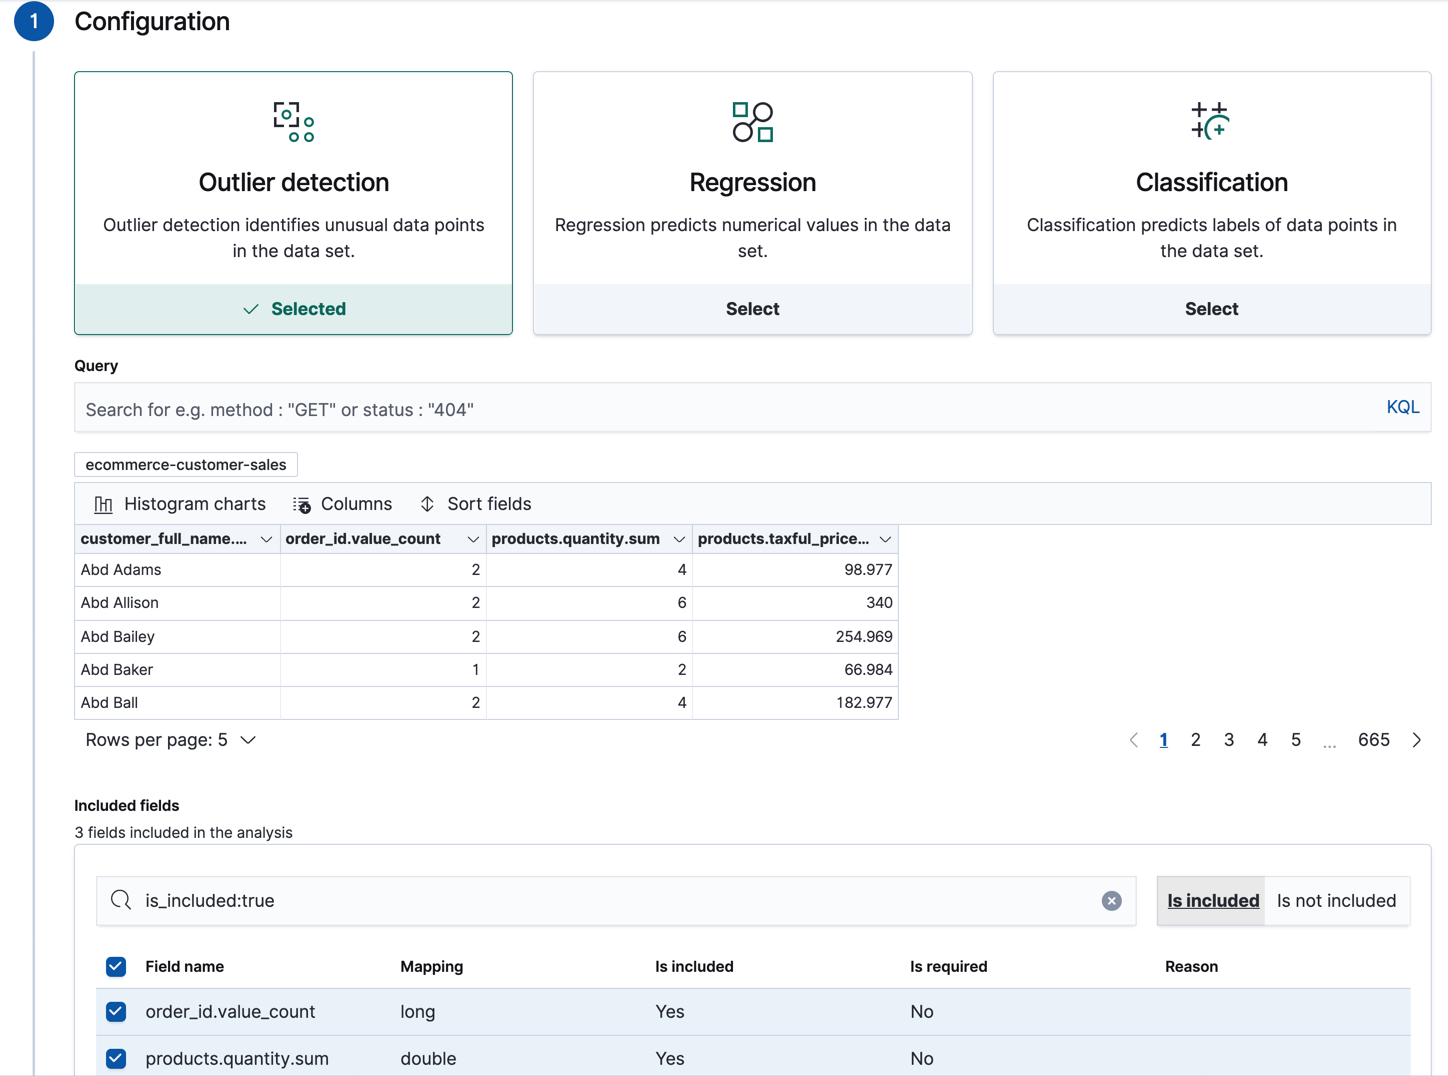
Create a data frame analytics job to detect outliers in the new entity-centric index.
In the wizard on the Machine Learning > Data Frame Analytics page in Kibana, select your new index pattern then use the default values for outlier detection. For example:
The wizard includes a scatterplot matrix, which enables you to explore the relationships between the fields. You can use that information to help you decide which fields to include or exclude from the analysis.
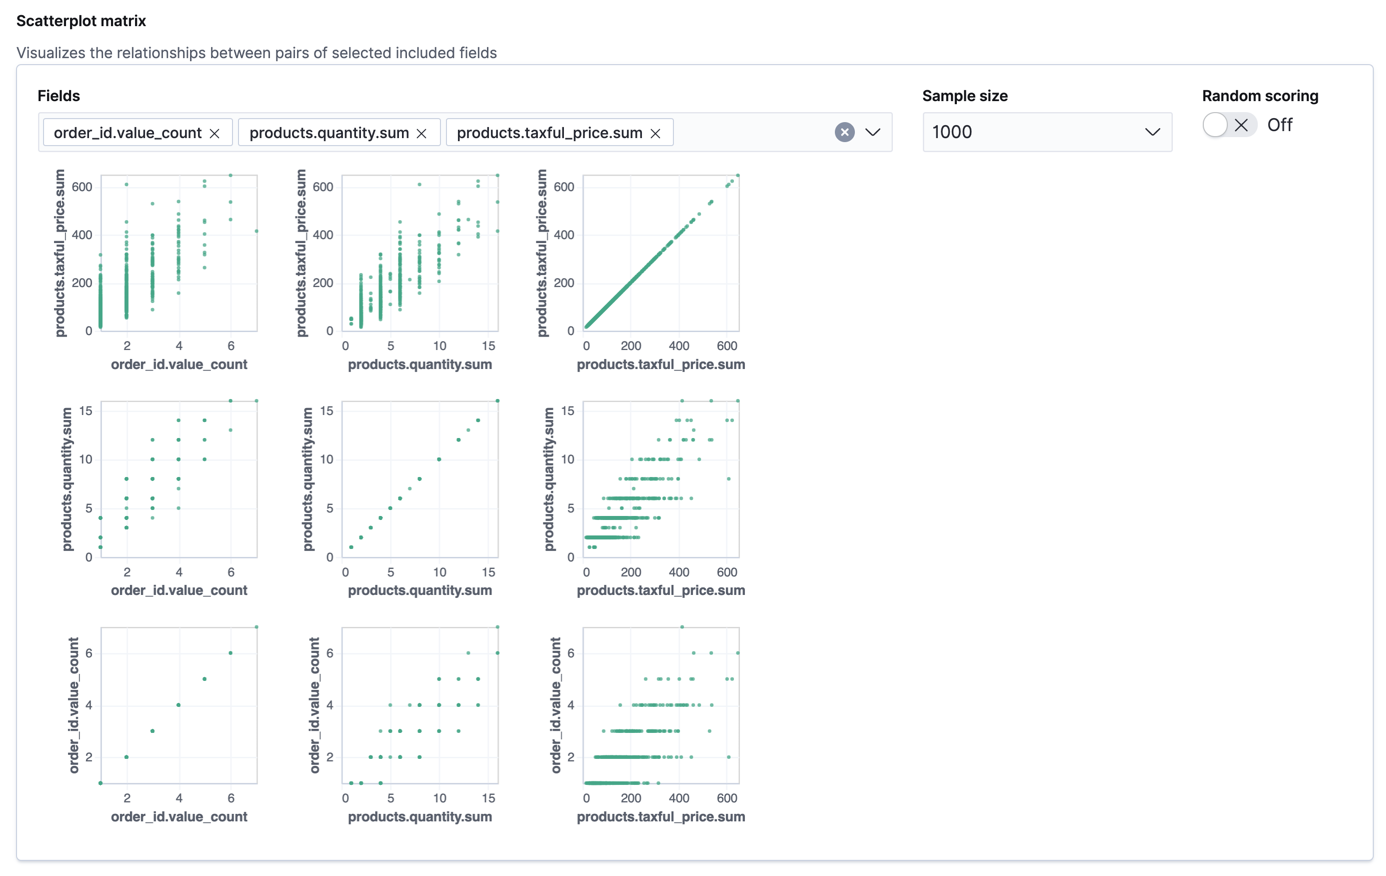
If you want these charts to represent data from a larger sample size or from a randomized selection of documents, you can change the default behavior. However, a larger sample size might slow down the performance of the matrix and a randomized selection might put more load on the cluster due to the more intensive query.
Alternatively, you can use the create data frame analytics jobs API.
API example
PUT _ml/data_frame/analytics/ecommerce { "source": { "index": "ecommerce-customer-sales" }, "dest": { "index": "ecommerce-outliers" }, "analysis": { "outlier_detection": { } }, "analyzed_fields" : { "includes" : ["products.quantity.sum","products.taxful_price.sum","order_id.value_count"] } } -
Start the data frame analytics job.
You can start, stop, and manage data frame analytics jobs on the Machine Learning > Data Frame Analytics page. Alternatively, you can use the start data frame analytics jobs and stop data frame analytics jobs APIs.
API example
POST _ml/data_frame/analytics/ecommerce/_start
-
View the results of the outlier detection analysis.
The data frame analytics job creates an index that contains the original data and outlier scores for each document. The outlier score indicates how different each entity is from other entities.
In Kibana, you can view the results from the data frame analytics job and sort them on the outlier score:
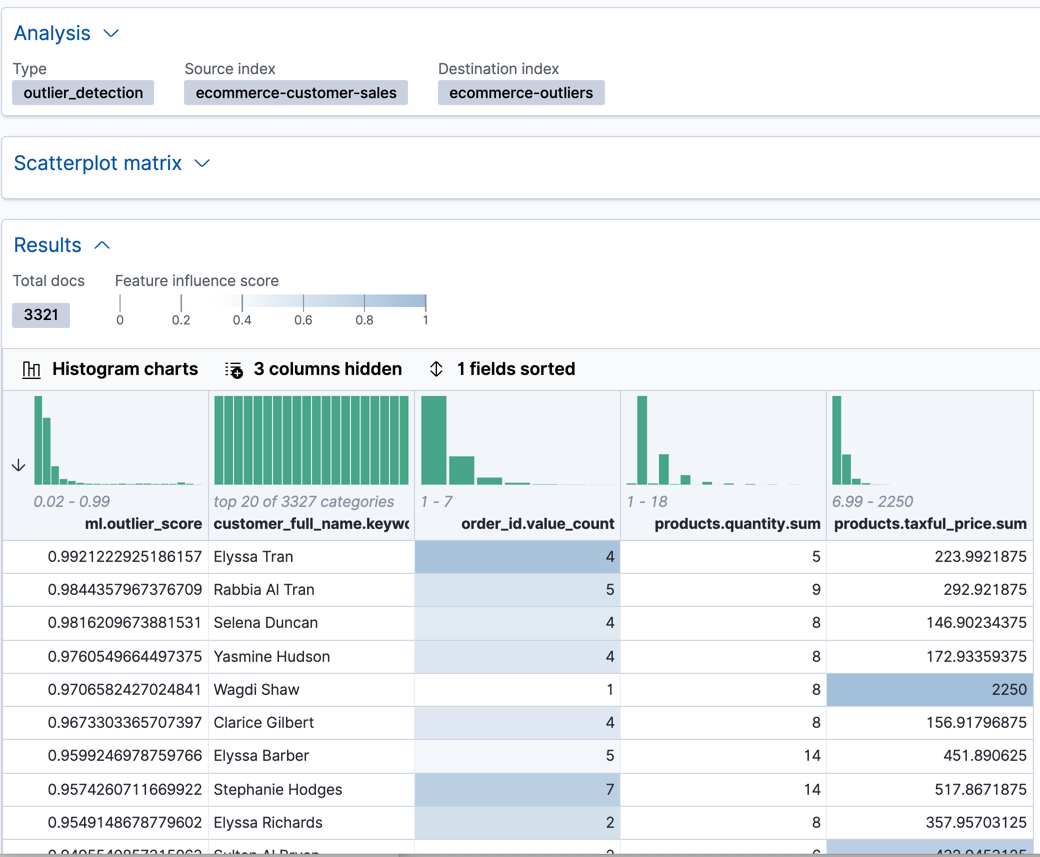
The
ml.outlierscore is a value between 0 and 1. The larger the value, the more likely they are to be an outlier. In Kibana, you can optionally enable histogram charts to get a better understanding of the distribution of values for each column in the result.In addition to an overall outlier score, each document is annotated with feature influence values for each field. These values add up to 1 and indicate which fields are the most important in deciding whether an entity is an outlier or inlier. For example, the dark shading on the
products.taxful_price.sumfield for Wagdi Shaw indicates that the sum of the product prices was the most influential feature in determining that Wagdi is an outlier.If you want to see the exact feature influence values, you can retrieve them from the index that is associated with your data frame analytics job.
API example
GET ecommerce-outliers/_search?q="Wagdi Shaw"
The search results include the following outlier detection scores:
...
  "ml" : {
    "outlier_score" : 0.9706582427024841,
    "feature_influence" : [
      {
        "feature_name" : "order_id.value_count",
        "influence" : 0.015179949812591076
      },
      {
        "feature_name" : "products.quantity.sum",
        "influence" : 0.003752298653125763
      },
      {
        "feature_name" : "products.taxful_price.sum",
        "influence" : 0.9810677766799927
      }
    ]
  }
...
Kibana also provides a scatterplot matrix in the results. Outliers with a score that exceeds the threshold are highlighted in each chart:
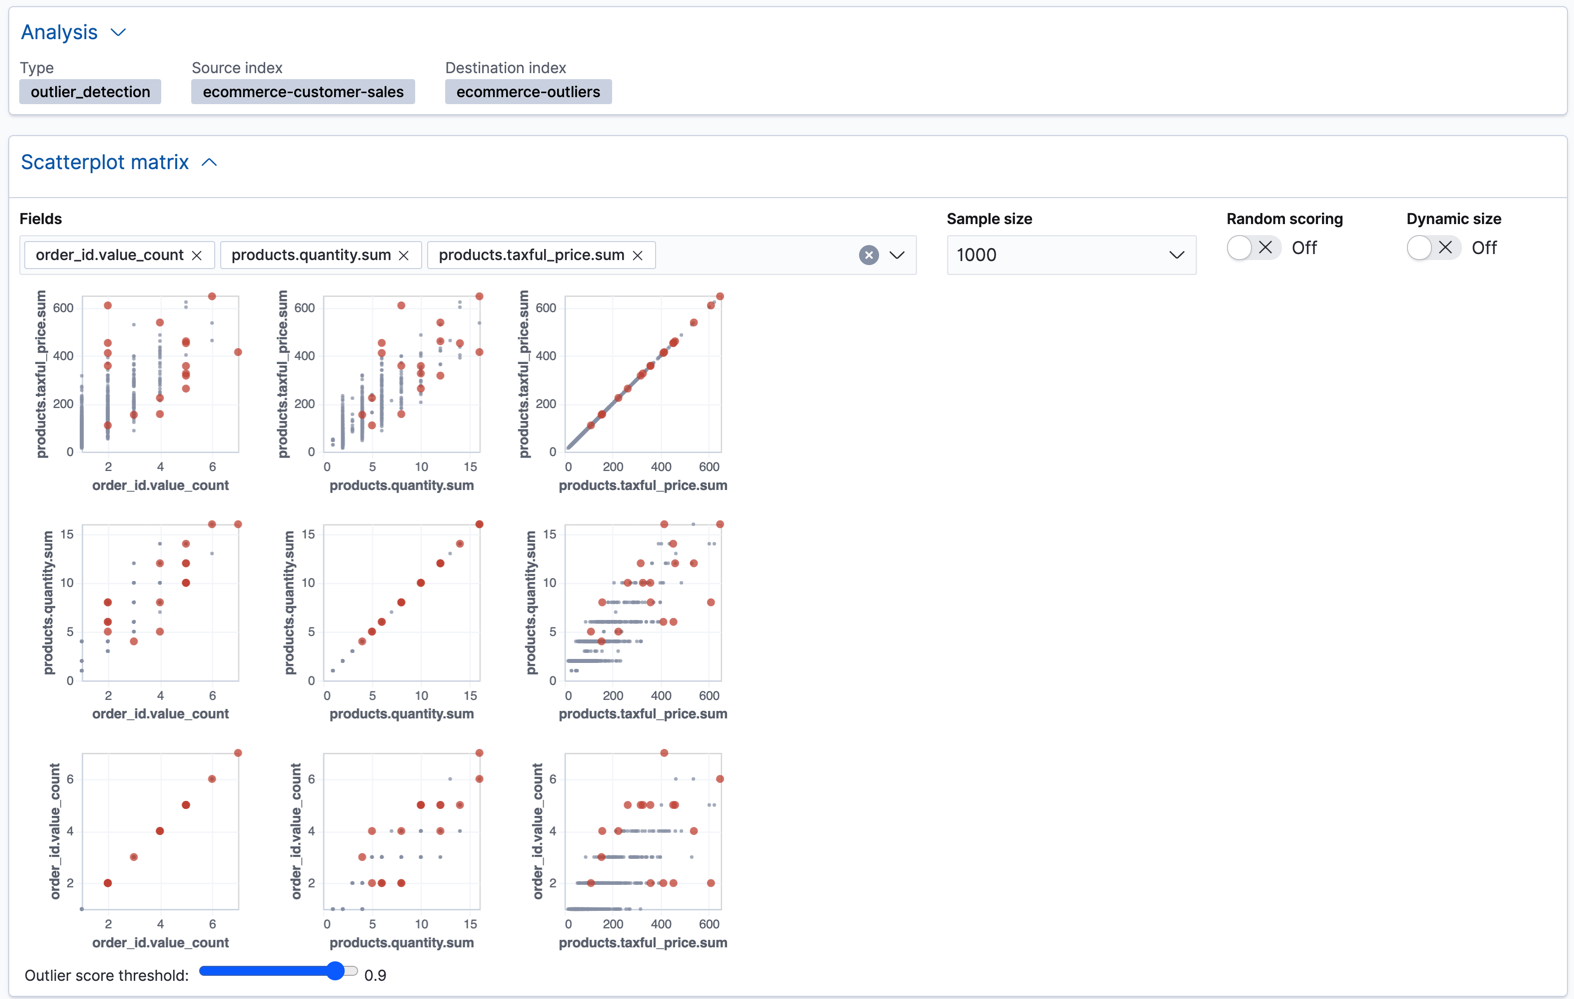
In addition to the sample size and random scoring options, there is a Dynamic size option. If you enable this option, the size of each point is affected by its outlier score; that is to say, the largest points have the highest outlier scores. The goal of these charts and options is to help you visualize and explore the outliers within your data.
Now that you’ve found unusual behavior in the sample data set, consider how you might apply these steps to other data sets. If you have data that is already marked up with true outliers, you can determine how well the outlier detection algorithms perform by using the evaluate data frame analytics API. See Evaluating data frame analytics.
If you do not want to keep the transform and the data frame analytics job, you can delete them in Kibana or use the delete transform API and delete data frame analytics job API. When you delete transforms and data frame analytics jobs in Kibana, you have the option to also remove the destination indices and index patterns.
If you want to see another example of outlier detection in a Jupyter notebook, click here.