Logstash Netflow Module
editLogstash Netflow Module
editDeprecated in 7.4.0.
Replaced by the Filebeat Netflow Module which is compliant with the Elastic Common Schema (ECS)
The Logstash Netflow module simplifies the collection, normalization, and visualization of network flow data. With a single command, the module parses network flow data, indexes the events into Elasticsearch, and installs a suite of Kibana dashboards to get you exploring your data immediately.
Logstash modules support Netflow Version 5 and 9.
What is Flow Data?
editNetflow is a type of data record streamed from capable network devices. It contains information about connections traversing the device, and includes source IP addresses and ports, destination IP addresses and ports, types of service, VLANs, and other information that can be encoded into frame and protocol headers. With Netflow data, network operators can go beyond monitoring simply the volume of data crossing their networks. They can understand where the traffic originated, where it is going, and what services or applications it is part of.
Requirements
editThese instructions assume you have already installed Elastic Stack (Logstash, Elasticsearch, and Kibana) version 5.6 or higher. The products you need are available to download and easy to install.
Getting Started
editThe Logstash Netflow Module has been deprecated and replaced by the Filebeat Netflow Module, which is compliant with the Elastic Common Schema (ECS).
-
Start the Logstash Netflow module by running the following command in the Logstash installation directory:
bin/logstash --modules netflow --setup -M netflow.var.input.udp.port=NNNN
Where
NNNNis the UDP port on which Logstash will listen for network traffic data. If you don’t specify a port, Logstash listens on port 2055 by default.The
--modules netflowoption spins up a Netflow-aware Logstash pipeline for ingestion.The
--setupoption creates anetflow-*index pattern in Elasticsearch and imports Kibana dashboards and visualizations. Running--setupis a one-time setup step. Omit this option for subsequent runs of the module to avoid overwriting existing Kibana dashboards.The command shown here assumes that you’re running Elasticsearch and Kibana on your localhost. If you’re not, you need to specify additional connection options. See Configuring the Module.
-
Explore your data in Kibana:
- Open your browser and navigate to http://localhost:5601. If security is enabled, you’ll need to specify the Kibana username and password that you used when you set up security.
- Open Netflow: Network Overview Dashboard.
- See Exploring Your Data for additional details on data exploration.
Exploring Your Data
editOnce the Logstash Netflow module starts processing events, you can immediately begin using the packaged Kibana dashboards to explore and visualize your network flow data.
You can use the dashboards as-is, or tailor them to work better with existing use cases and business requirements.
Example Dashboards
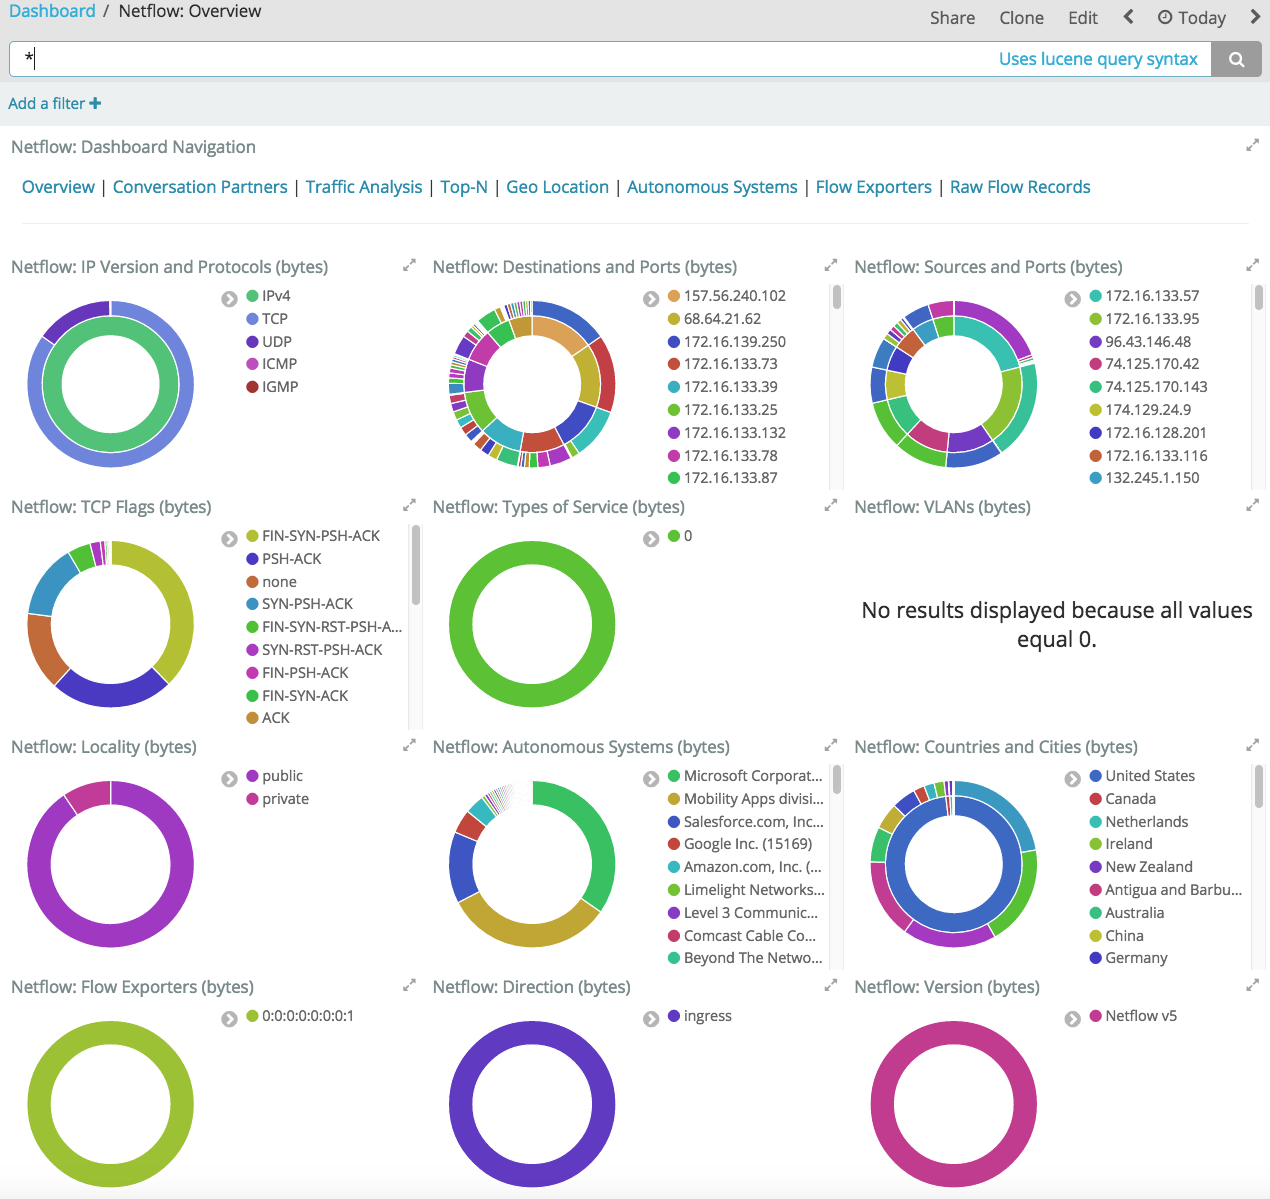
editOn the Overview dashboard, you can see a summary of basic traffic data and set up filters before you drill down to gain deeper insight into the data.
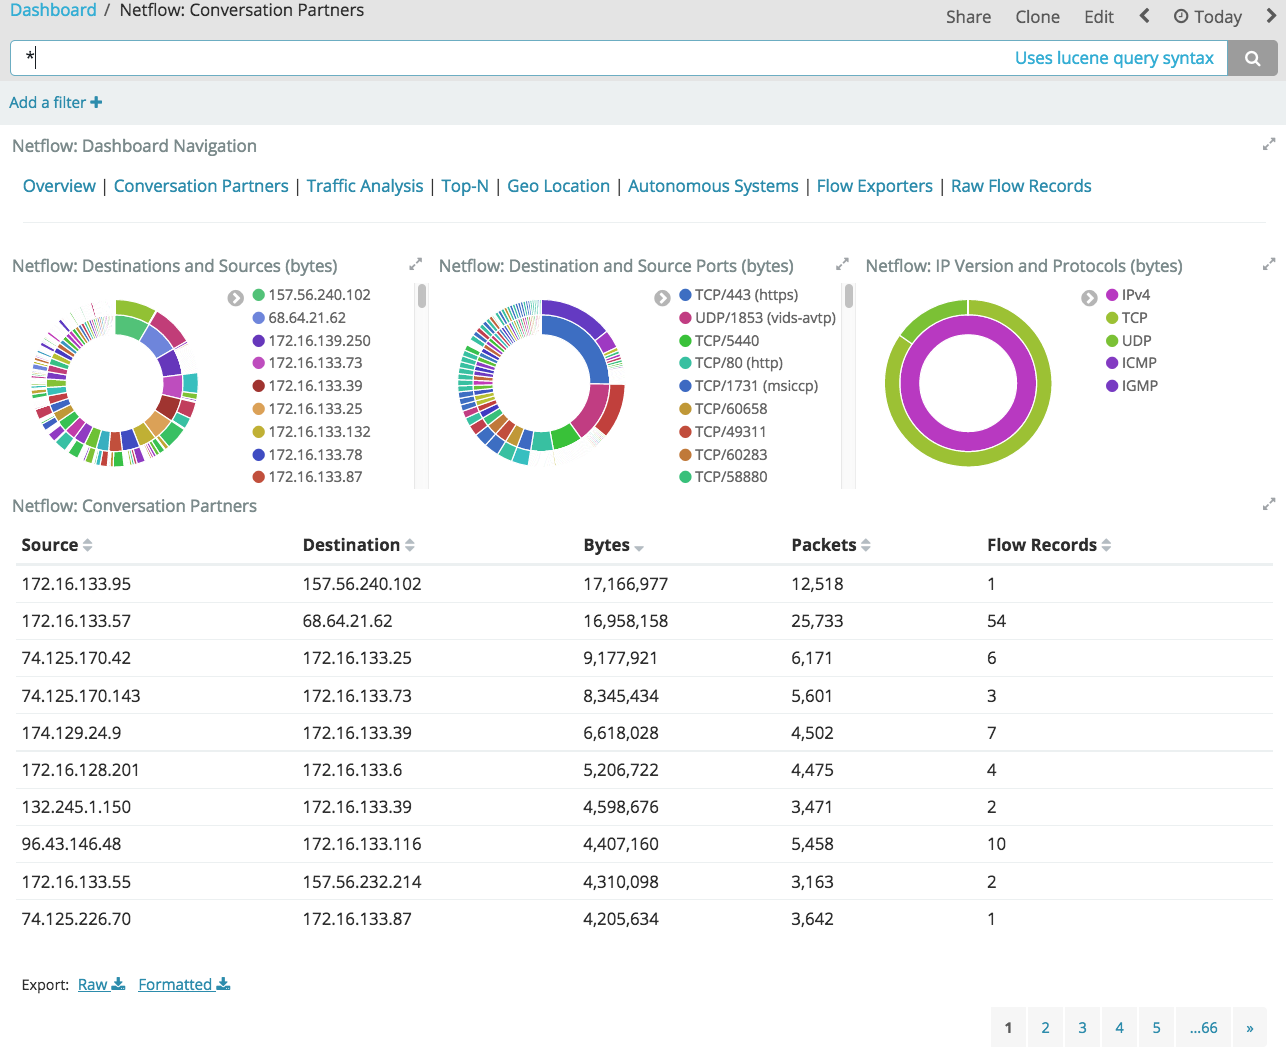
For example, on the Conversation Partners dashboard, you can see the source and destination addresses of the client and server in any conversation.
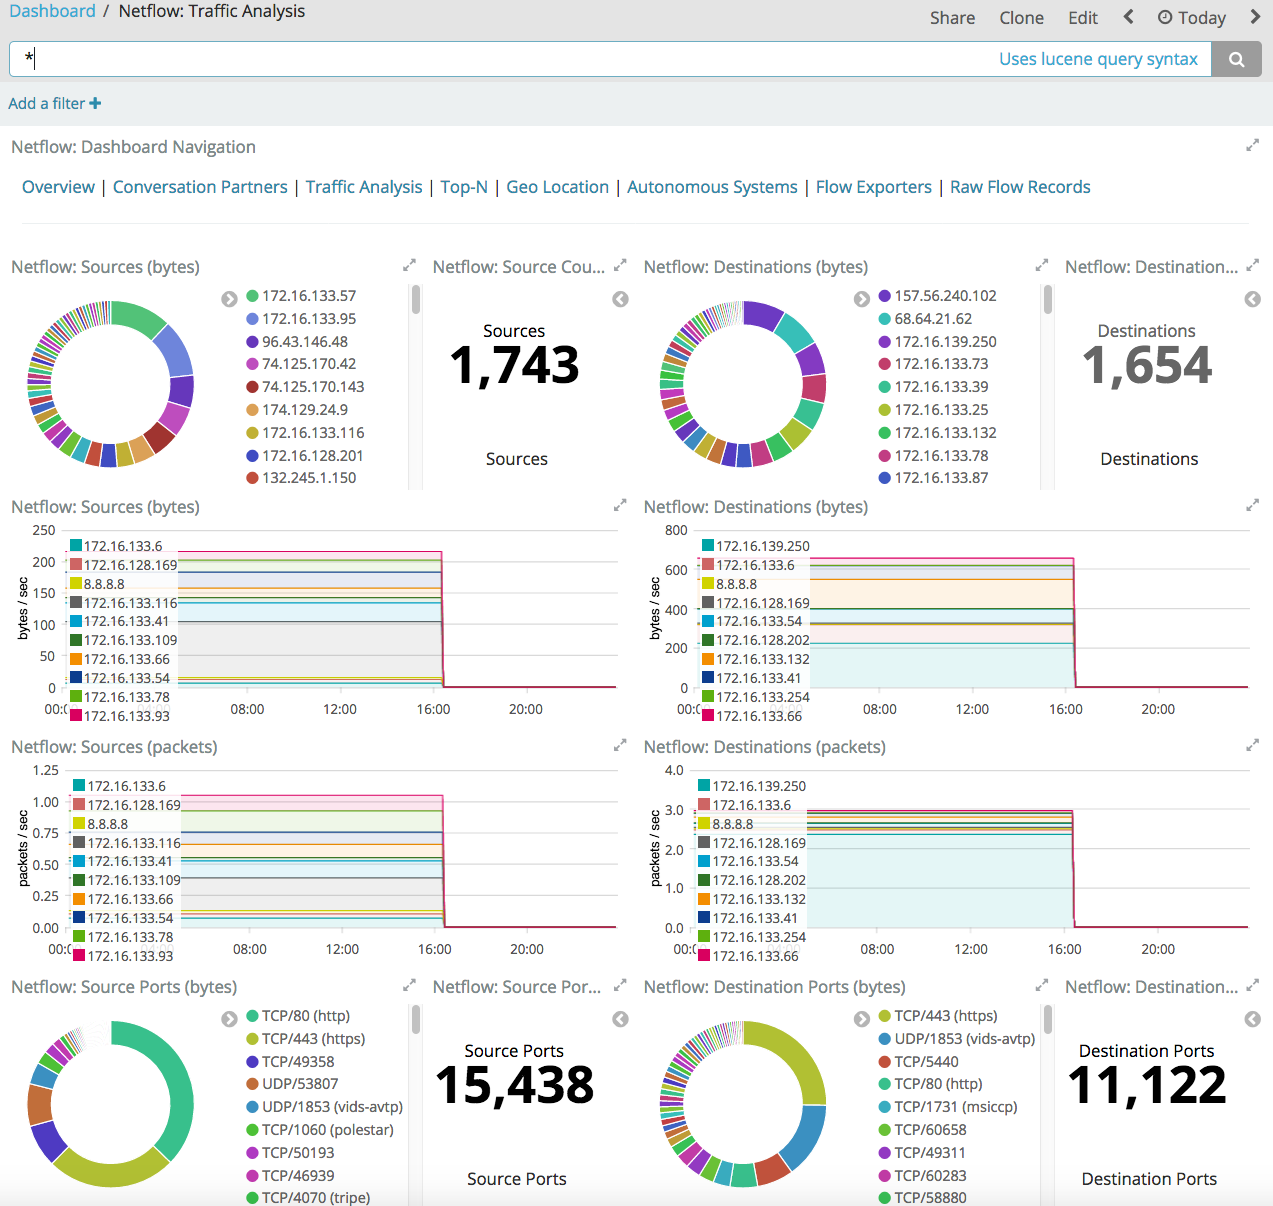
On the Traffic Analysis dashboard, you can identify high volume conversations by viewing the traffic volume in bytes.
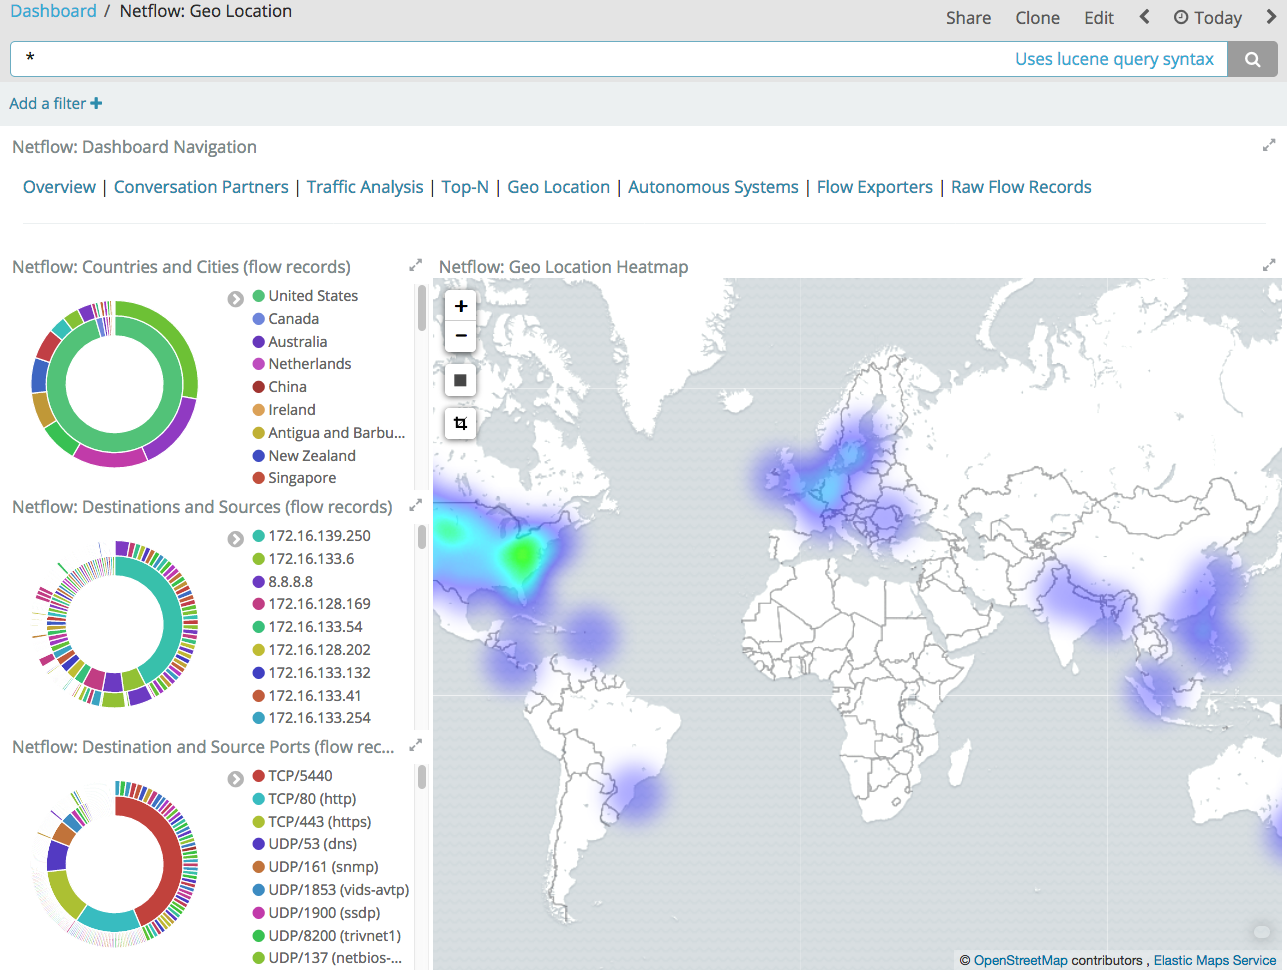
Then you can go to the Geo Location dashboard where you can visualize the location of destinations and sources on a heat map.
Configuring the Module
editYou can further refine the behavior of the Logstash Netflow module by specifying
settings in the logstash.yml settings file, or overriding settings at the
command line.
For example, the following configuration in the logstash.yml file sets
Logstash to listen on port 9996 for network traffic data:
modules:
  - name: netflow
    var.input.udp.port: 9996
To specify the same settings at the command line, you use:
bin/logstash --modules netflow -M netflow.var.input.udp.port=9996
For more information about configuring modules, see Working with Logstash Modules.
Configuration Options
editThe Netflow module provides the following settings for configuring the behavior of the module. These settings include Netflow-specific options plus common options that are supported by all Logstash modules.
When you override a setting at the command line, remember to prefix the setting
with the module name, for example, netflow.var.input.udp.port instead of
var.input.udp.port.
If you don’t specify configuration settings, Logstash uses the defaults.
Netflow Options
-
var.input.udp.port: -
- Value type is number
- Default value is 2055.
Sets the UDP port on which Logstash listens for network traffic data. Although 2055 is the default for this setting, some devices use ports in the range of 9995 through 9998, with 9996 being the most commonly used alternative.
-
var.input.udp.workers: -
- Value type is number
- Default value is 2.
Number of threads processing packets.
-
var.input.udp.receive_buffer_bytes: -
- Value type is number
- Default value is 212992.
The socket receive buffer size in bytes. The operating system will use the max allowed value if receive_buffer_bytes is larger than allowed. Consult your operating system documentation if you need to increase this max allowed value.
-
var.input.udp.queue_size: -
- Value type is number
- Default value is 2000.
This is the number of unprocessed UDP packets you can hold in memory before packets will start dropping.
Common options
The following configuration options are supported by all modules:
-
var.elasticsearch.hosts -
- Value type is uri
- Default value is "localhost:9200"
Sets the host(s) of the Elasticsearch cluster. For each host, you must specify the hostname and port. For example, "myhost:9200". If given an array, Logstash will load balance requests across the hosts specified in the hosts parameter. It is important to exclude dedicated master nodes from the hosts list to prevent Logstash from sending bulk requests to the master nodes. So this parameter should only reference either data or client nodes in Elasticsearch.
Any special characters present in the URLs here MUST be URL escaped! This means # should be put in as %23 for instance.
-
var.elasticsearch.username -
- Value type is string
- Default value is "elastic"
The username to authenticate to a secure Elasticsearch cluster.
-
var.elasticsearch.password -
- Value type is string
- Default value is "changeme"
The password to authenticate to a secure Elasticsearch cluster.
-
var.elasticsearch.ssl.enabled -
- Value type is boolean
- There is no default value for this setting.
Enable SSL/TLS secured communication to the Elasticsearch cluster. Leaving this unspecified will use whatever scheme is specified in the URLs listed in
hosts. If no explicit protocol is specified, plain HTTP will be used. If SSL is explicitly disabled here, the plugin will refuse to start if an HTTPS URL is given in hosts. -
var.elasticsearch.ssl.verification_mode -
- Value type is string
- Default value is "strict"
The hostname verification setting when communicating with Elasticsearch. Set to
disableto turn off hostname verification. Disabling this has serious security concerns. -
var.elasticsearch.ssl.certificate_authority -
- Value type is string
- There is no default value for this setting
The path to an X.509 certificate to use to validate SSL certificates when communicating with Elasticsearch.
-
var.elasticsearch.ssl.certificate -
- Value type is string
- There is no default value for this setting
The path to an X.509 certificate to use for client authentication when communicating with Elasticsearch.
-
var.elasticsearch.ssl.key -
- Value type is string
- There is no default value for this setting
The path to the certificate key for client authentication when communicating with Elasticsearch.
-
var.kibana.host -
- Value type is string
- Default value is "localhost:5601"
Sets the hostname and port of the Kibana instance to use for importing dashboards and visualizations. For example: "myhost:5601".
-
var.kibana.scheme -
- Value type is string
- Default value is "http"
Sets the protocol to use for reaching the Kibana instance. The options are: "http" or "https". The default is "http".
-
var.kibana.username -
- Value type is string
- Default value is "elastic"
The username to authenticate to a secured Kibana instance.
-
var.kibana.password -
- Value type is string
- Default value is "changeme"
The password to authenticate to a secure Kibana instance.
-
var.kibana.ssl.enabled -
- Value type is boolean
- Default value is false
Enable SSL/TLS secured communication to the Kibana instance.
-
var.kibana.ssl.verification_mode -
- Value type is string
- Default value is "strict"
The hostname verification setting when communicating with Kibana. Set to
disableto turn off hostname verification. Disabling this has serious security concerns. -
var.kibana.ssl.certificate_authority -
- Value type is string
- There is no default value for this setting
The path to an X.509 certificate to use to validate SSL certificates when communicating with Kibana.
-
var.kibana.ssl.certificate -
- Value type is string
- There is no default value for this setting
The path to an X.509 certificate to use for client authentication when communicating with Kibana.
-
var.kibana.ssl.key -
- Value type is string
- There is no default value for this setting
The path to the certificate key for client authentication when communicating with Kibana.