Tuning and Profiling Logstash Performance
editTuning and Profiling Logstash Performance
editThe Logstash defaults are chosen to provide fast, safe performance for most
users. However if you notice performance issues, you may need to modify
some of the defaults. Logstash provides the following configurable options
for tuning pipeline performance: pipeline.workers, pipeline.batch.size, and pipeline.batch.delay. For more information about setting these options, see logstash.yml.
Make sure you’ve read the Performance Troubleshooting before modifying these options.
-
The
pipeline.workerssetting determines how many threads to run for filter and output processing. If you find that events are backing up, or that the CPU is not saturated, consider increasing the value of this parameter to make better use of available processing power. Good results can even be found increasing this number past the number of available processors as these threads may spend significant time in an I/O wait state when writing to external systems. Legal values for this parameter are positive integers. -
The
pipeline.batch.sizesetting defines the maximum number of events an individual worker thread collects before attempting to execute filters and outputs. Larger batch sizes are generally more efficient, but increase memory overhead. Some hardware configurations require you to increase JVM heap space in thejvm.optionsconfig file to avoid performance degradation. (See Logstash Configuration Files for more info.) Values in excess of the optimum range cause performance degradation due to frequent garbage collection or JVM crashes related to out-of-memory exceptions. Output plugins can process each batch as a logical unit. The Elasticsearch output, for example, issues bulk requests for each batch received. Tuning thepipeline.batch.sizesetting adjusts the size of bulk requests sent to Elasticsearch. -
The
pipeline.batch.delaysetting rarely needs to be tuned. This setting adjusts the latency of the Logstash pipeline. Pipeline batch delay is the maximum amount of time in milliseconds that Logstash waits for new messages after receiving an event in the current pipeline worker thread. After this time elapses, Logstash begins to execute filters and outputs.The maximum time that Logstash waits between receiving an event and processing that event in a filter is the product of thepipeline.batch.delayandpipeline.batch.sizesettings.
Notes on Pipeline Configuration and Performance
editIf you plan to modify the default pipeline settings, take into account the following suggestions:
-
The total number of inflight events is determined by the product of the
pipeline.workersandpipeline.batch.sizesettings. This product is referred to as the inflight count. Keep the value of the inflight count in mind as you adjust thepipeline.workersandpipeline.batch.sizesettings. Pipelines that intermittently receive large events at irregular intervals require sufficient memory to handle these spikes. Set the JVM heap space accordingly in thejvm.optionsconfig file. (See Logstash Configuration Files for more info.) - Measure each change to make sure it increases, rather than decreases, performance.
- Ensure that you leave enough memory available to cope with a sudden increase in event size. For example, an application that generates exceptions that are represented as large blobs of text.
- The number of workers may be set higher than the number of CPU cores since outputs often spend idle time in I/O wait conditions.
-
Threads in Java have names and you can use the
jstack,top, and the VisualVM graphical tools to figure out which resources a given thread uses. -
On Linux platforms, Logstash labels all the threads it can with something descriptive. For example, inputs show up as
[base]<inputname, and pipeline workers show up as[base]>workerN, where N is an integer. Where possible, other threads are also labeled to help you identify their purpose.
Profiling the Heap
editWhen tuning Logstash you may have to adjust the heap size. You can use the VisualVM tool to profile the heap. The Monitor pane in particular is useful for checking whether your heap allocation is sufficient for the current workload. The screenshots below show sample Monitor panes. The first pane examines a Logstash instance configured with too many inflight events. The second pane examines a Logstash instance configured with an appropriate amount of inflight events. Note that the specific batch sizes used here are most likely not applicable to your specific workload, as the memory demands of Logstash vary in large part based on the type of messages you are sending.
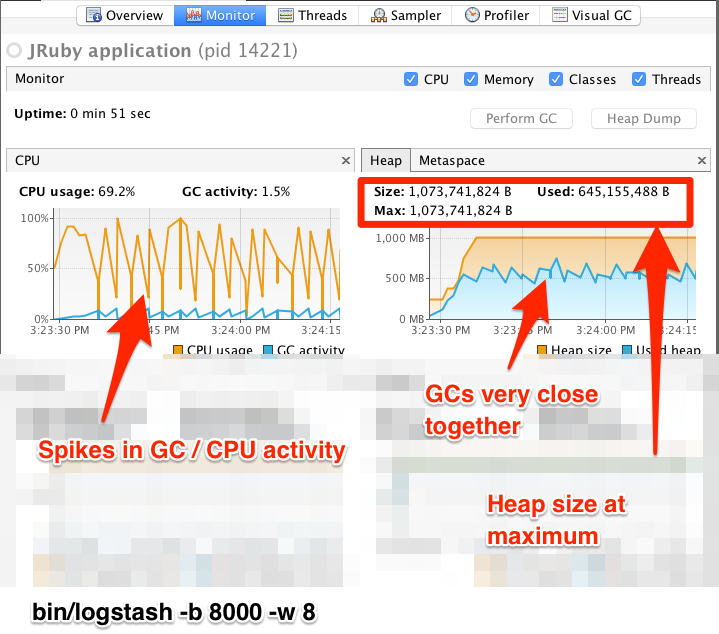
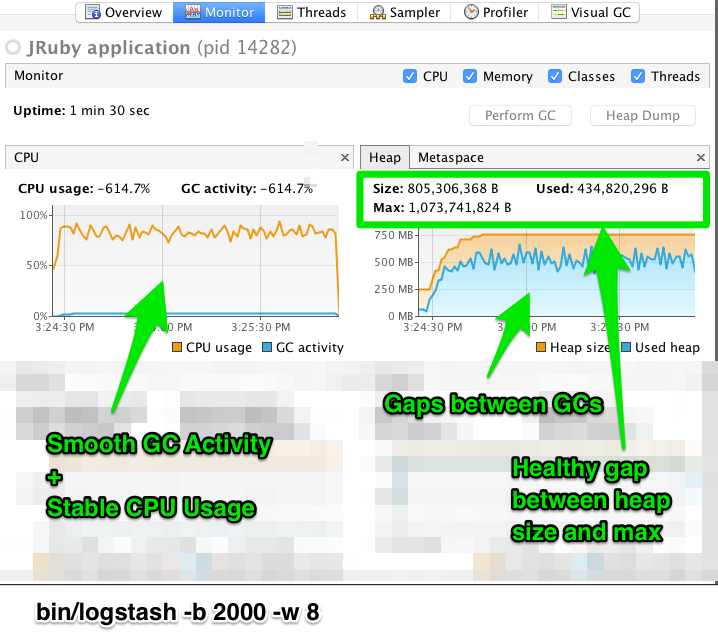
In the first example we see that the CPU isn’t being used very efficiently. In fact, the JVM is often times having to stop the VM for “full GCs”. Full garbage collections are a common symptom of excessive memory pressure. This is visible in the spiky pattern on the CPU chart. In the more efficiently configured example, the GC graph pattern is more smooth, and the CPU is used in a more uniform manner. You can also see that there is ample headroom between the allocated heap size, and the maximum allowed, giving the JVM GC a lot of room to work with.
Examining the in-depth GC statistics with a tool similar to the excellent VisualGC plugin shows that the over-allocated VM spends very little time in the efficient Eden GC, compared to the time spent in the more resource-intensive Old Gen “Full” GCs.
As long as the GC pattern is acceptable, heap sizes that occasionally increase to the maximum are acceptable. Such heap size spikes happen in response to a burst of large events passing through the pipeline. In general practice, maintain a gap between the used amount of heap memory and the maximum. This document is not a comprehensive guide to JVM GC tuning. Read the official Oracle guide for more information on the topic. We also recommend reading Debugging Java Performance.