Deploying and Scaling Logstash
editDeploying and Scaling Logstash
editAs your use case for Logstash evolves, the preferred architecture at a given scale will change. This section discusses a range of Logstash architectures in increasing order of complexity, starting from a minimal installation and adding elements to the system. The example deployments in this section write to an Elasticsearch cluster, but Logstash can write to a large variety of endpoints.
The Minimal Installation
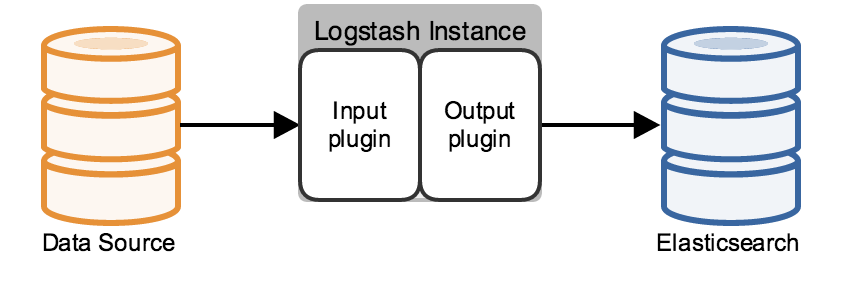
editThe minimal Logstash installation has one Logstash instance and one Elasticsearch instance. These instances are
directly connected. Logstash uses an input plugin to ingest data and an
Elasticsearch output plugin to index the data in Elasticsearch, following the Logstash
processing pipeline. A Logstash instance has a fixed pipeline constructed at startup,
based on the instance’s configuration file. You must specify an input plugin. Output defaults to stdout, and the
filtering section of the pipeline, which is discussed in the next section, is optional.
Using Filters
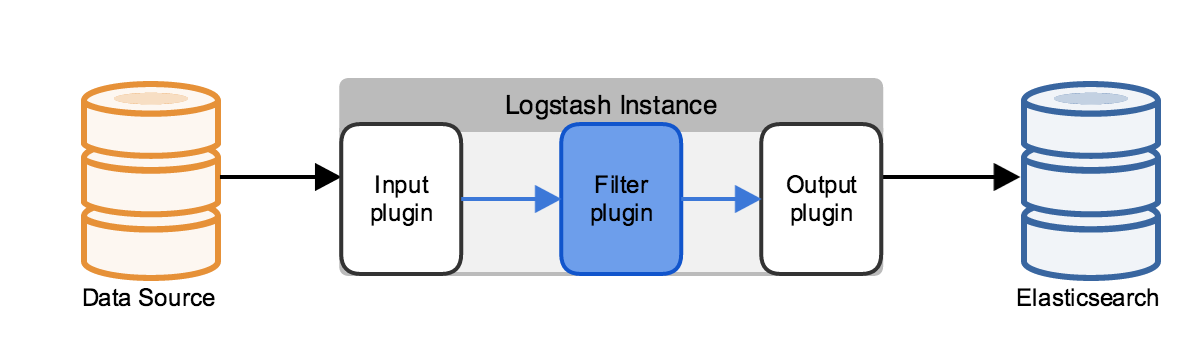
editLog data is typically unstructured, often contains extraneous information that isn’t relevant to your use case, and sometimes is missing relevant information that can be derived from the log contents. You can use a filter plugin to parse the log into fields, remove unnecessary information, and derive additional information from the existing fields. For example, filters can derive geolocation information from an IP address and add that information to the logs, or parse and structure arbitrary text with the grok filter.
Adding a filter plugin can significantly affect performance, depending on the amount of computation the filter plugin
performs, as well as on the volume of the logs being processed. The grok filter’s regular expression computation is
particularly resource-intensive. One way to address this increased demand for computing resources is to use
parallel processing on multicore machines. Use the -w switch to set the number of execution threads for Logstash
filtering tasks. For example the bin/logstash -w 8 command uses eight different threads for filter processing.
Using Filebeat
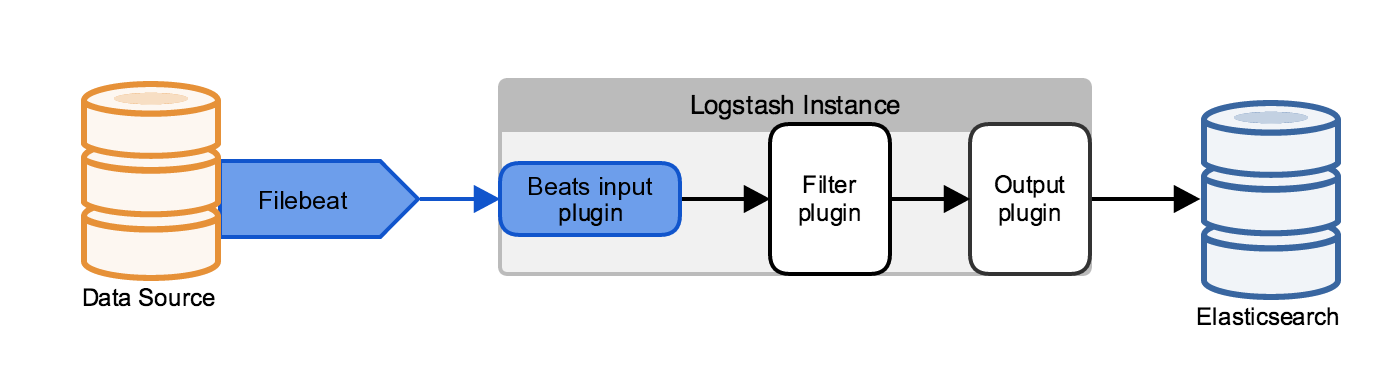
editFilebeat is a lightweight, resource-friendly tool written in Go that collects logs from files on the server and forwards these logs to other machines for processing. Filebeat uses the Beats protocol to communicate with a centralized Logstash instance. Configure the Logstash instances that receive Beats data to use the Beats input plugin.
Filebeat uses the computing resources of the machine hosting the source data, and the Beats input plugin minimizes the resource demands on the Logstash instance, making this architecture attractive for use cases with resource constraints.
Scaling to a Larger Elasticsearch Cluster
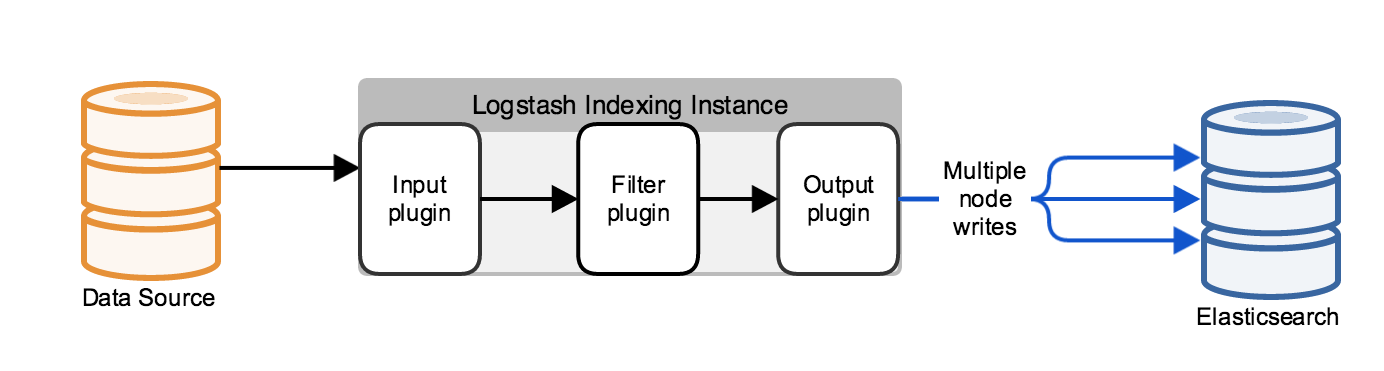
editTypically, Logstash does not communicate with a single Elasticsearch node, but with a cluster that comprises several nodes. By default, Logstash uses the HTTP protocol to move data into the cluster.
You can use the Elasticsearch HTTP REST APIs to index data into the Elasticsearch cluster. These APIs represent the indexed data in JSON. Using the REST APIs does not require the Java client classes or any additional JAR files and has no performance disadvantages compared to the transport or node protocols. You can secure communications that use the HTTP REST APIs with the Shield plugin, which supports SSL and HTTP basic authentication.
When you use the HTTP protocol, you can configure the Logstash Elasticsearch output plugin to automatically load-balance indexing requests across a specified set of hosts in the Elasticsearch cluster. Specifying multiple Elasticsearch nodes also provides high availability for the Elasticsearch cluster by routing traffic to active Elasticsearch nodes.
You can also use the Elasticsearch Java APIs to serialize the data into a binary representation, using the transport protocol. The transport protocol can sniff the endpoint of the request and select an arbitrary client or data node in the Elasticsearch cluster.
Using the HTTP or transport protocols keep your Logstash instances separate from the Elasticsearch cluster. The node protocol, by contrast, has the machine running the Logstash instance join the Elasticsearch cluster, running an Elasticsearch instance. The data that needs indexing propagates from this node to the rest of the cluster. Since the machine is part of the cluster, the cluster topology is available, making the node protocol a good fit for use cases that use a relatively small number of persistent connections.
You can also use a third-party hardware or software load balancer to handle connections between Logstash and external applications.
Make sure that your Logstash configuration does not connect directly to Elasticsearch dedicated master nodes, which perform dedicated cluster management. Connect Logstash to client or data nodes to protect the stability of your Elasticsearch cluster.
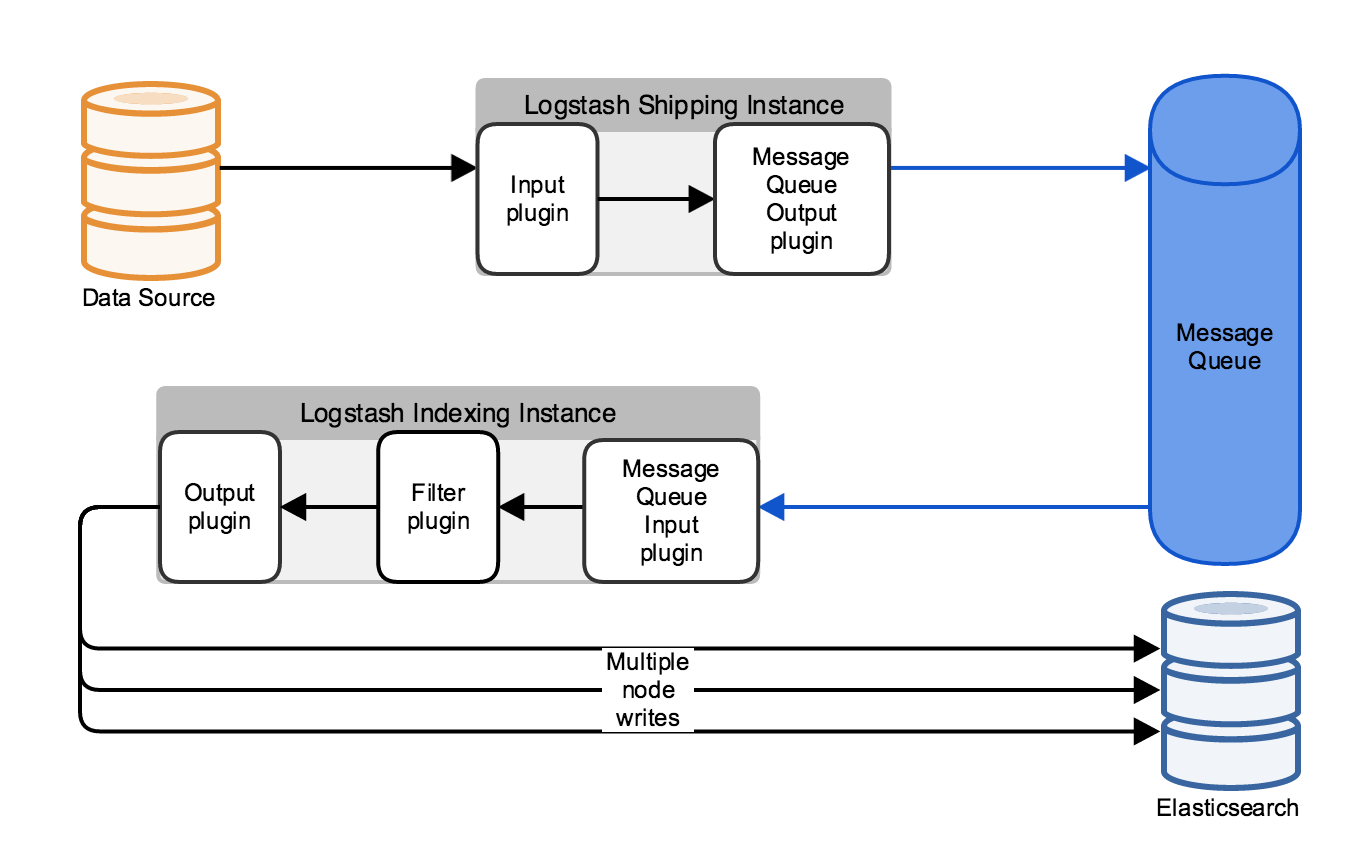
Managing Throughput Spikes with Message Queueing
editWhen the data coming into a Logstash pipeline exceeds the Elasticsearch cluster’s ability to ingest the data, you can use a message queue as a buffer. By default, Logstash throttles incoming events when indexer consumption rates fall below incoming data rates. Since this throttling can lead to events being buffered at the data source, preventing backpressure with message queues becomes an important part of managing your deployment.
Adding a message queue to your Logstash deployment also provides a level of protection from data loss. When a Logstash instance that has consumed data from the message queue fails, the data can be replayed from the message queue to an active Logstash instance.
Several third-party message queues exist, such as Redis, Kafka, or RabbitMQ. Logstash provides input and output plugins to integrate with several of these third-party message queues. When your Logstash deployment has a message queue configured, Logstash functionally exists in two phases: shipping instances, which handles data ingestion and storage in the message queue, and indexing instances, which retrieve the data from the message queue, apply any configured filtering, and write the filtered data to an Elasticsearch index.
Multiple Connections for Logstash High Availability
editTo make your Logstash deployment more resilient to individual instance failures, you can set up a load balancer between your data source machines and the Logstash cluster. The load balancer handles the individual connections to the Logstash instances to ensure continuity of data ingestion and processing even when an individual instance is unavailable.
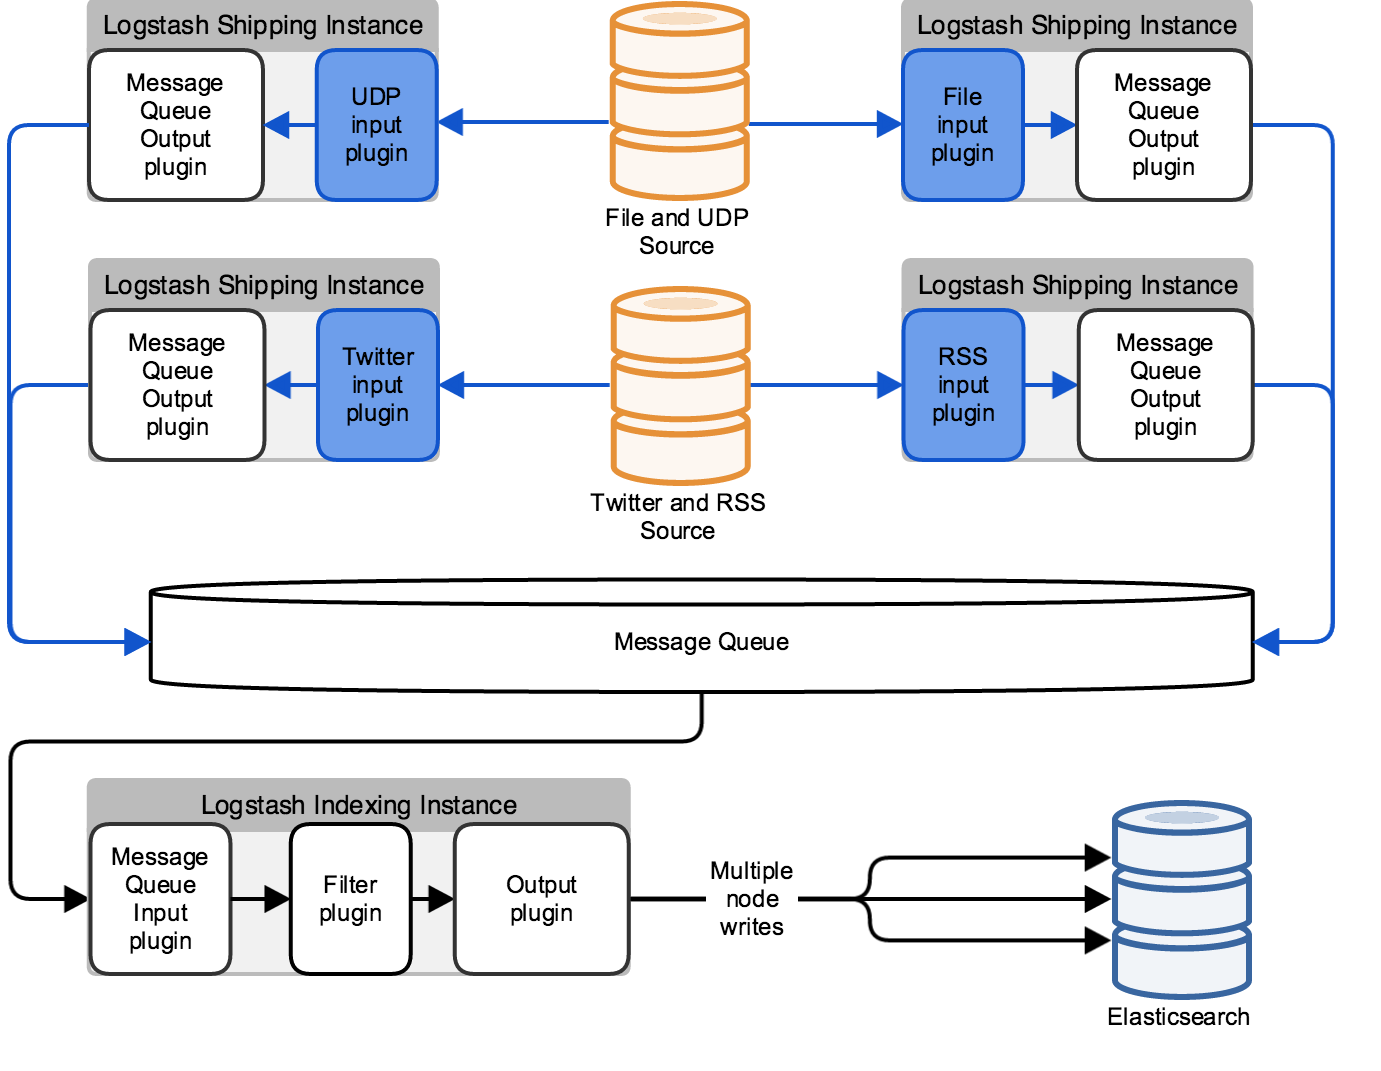
The architecture in the previous diagram is unable to process input from a specific type, such as an RSS feed or a file, if the Logstash instance dedicated to that input type becomes unavailable. For more robust input processing, configure each Logstash instance for multiple inputs, as in the following diagram:
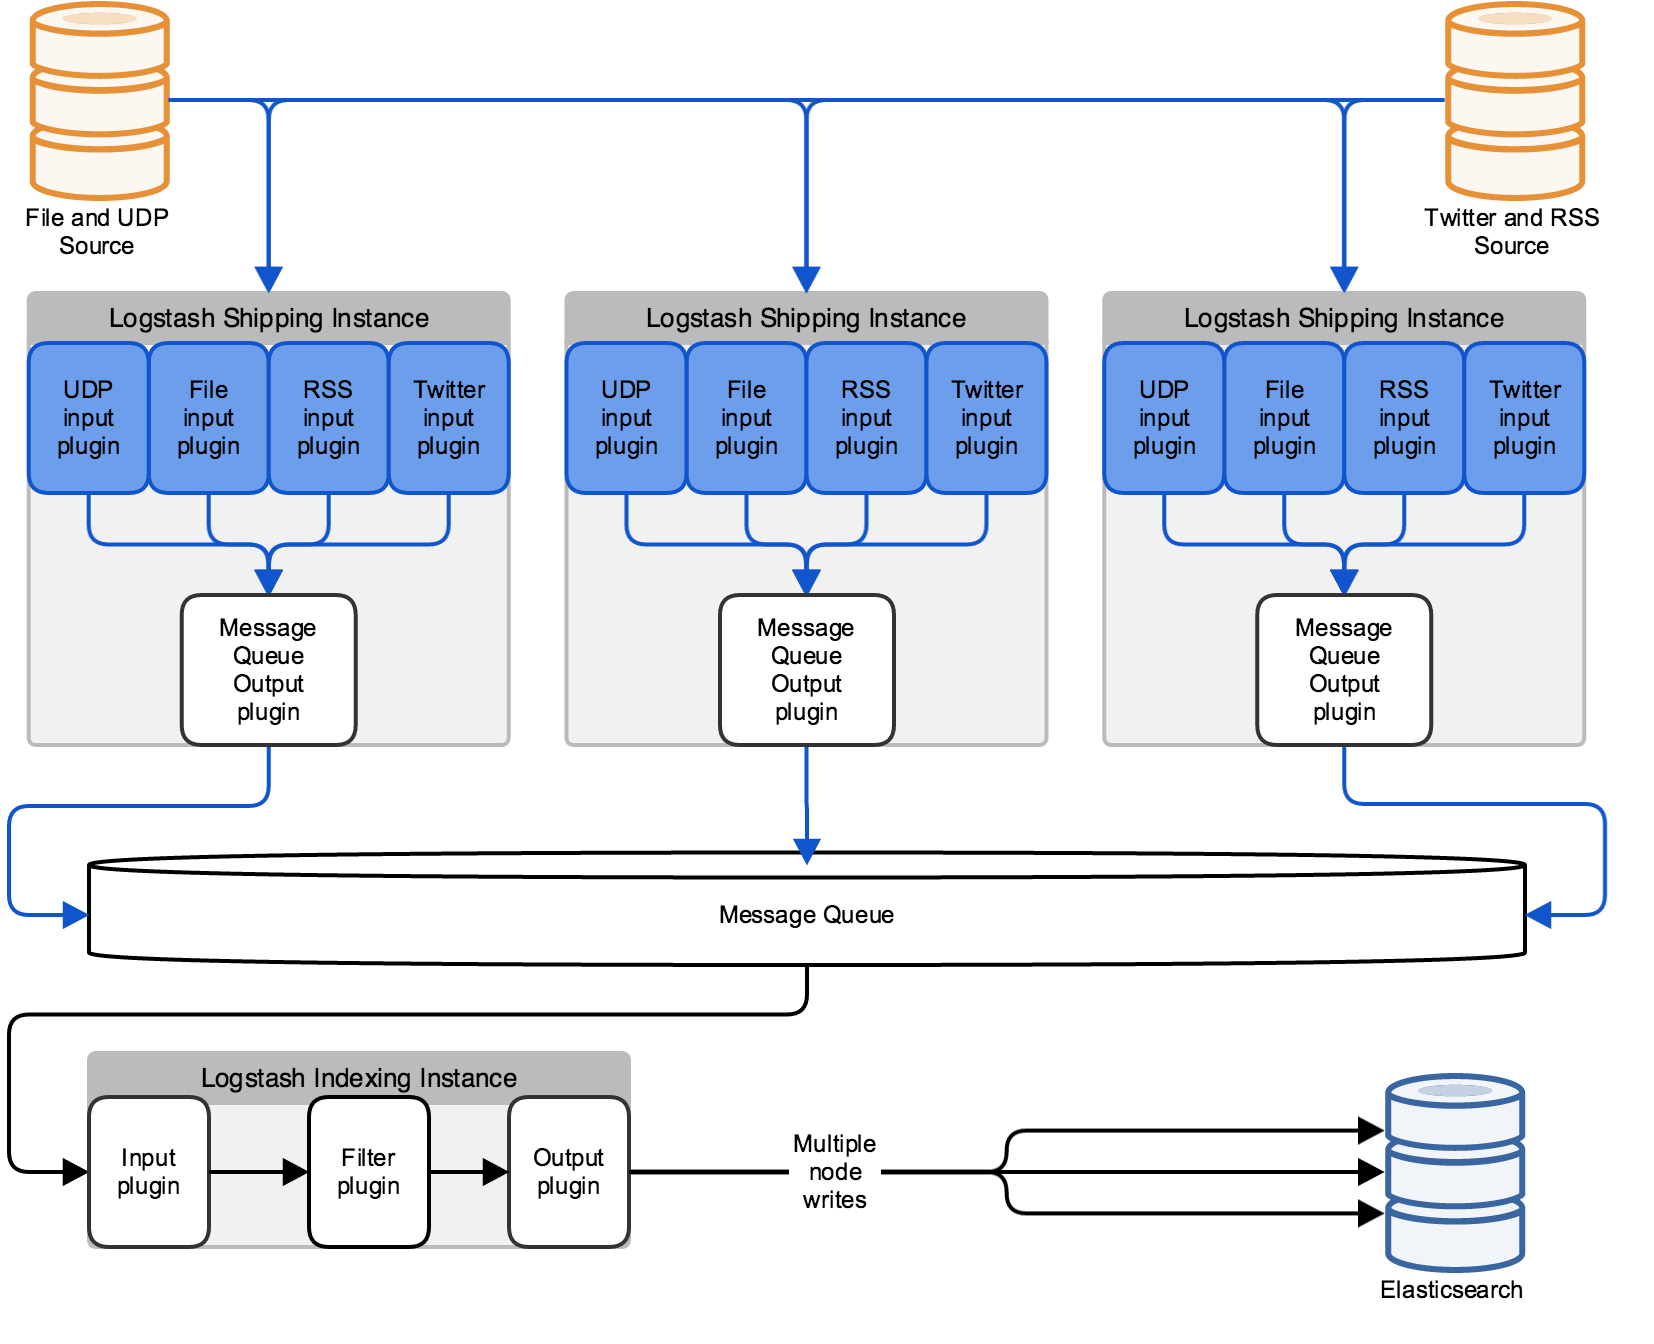
This architecture parallelizes the Logstash workload based on the inputs you configure. With more inputs, you can add more Logstash instances to scale horizontally. Separate parallel pipelines also increases the reliability of your stack by eliminating single points of failure.
Scaling Logstash
editA mature Logstash deployment typically has the following pipeline:
- The input tier consumes data from the source, and consists of Logstash instances with the proper input plugins.
- The message queue serves as a buffer to hold ingested data and serve as failover protection.
- The filter tier applies parsing and other processing to the data consumed from the message queue.
- The indexing tier moves the processed data into Elasticsearch.
Any of these layers can be scaled by adding computing resources. Examine the performance of these components regularly as your use case evolves and add resources as needed. When Logstash routinely throttles incoming events, consider adding storage for your message queue. Alternately, increase the Elasticsearch cluster’s rate of data consumption by adding more Logstash indexing instances.