Traces
editTraces
editTraces link together related transactions to show an end-to-end performance of how a request was served and which services were part of it. In addition to the Traces overview, you can view your application traces in the trace sample timeline waterfall.
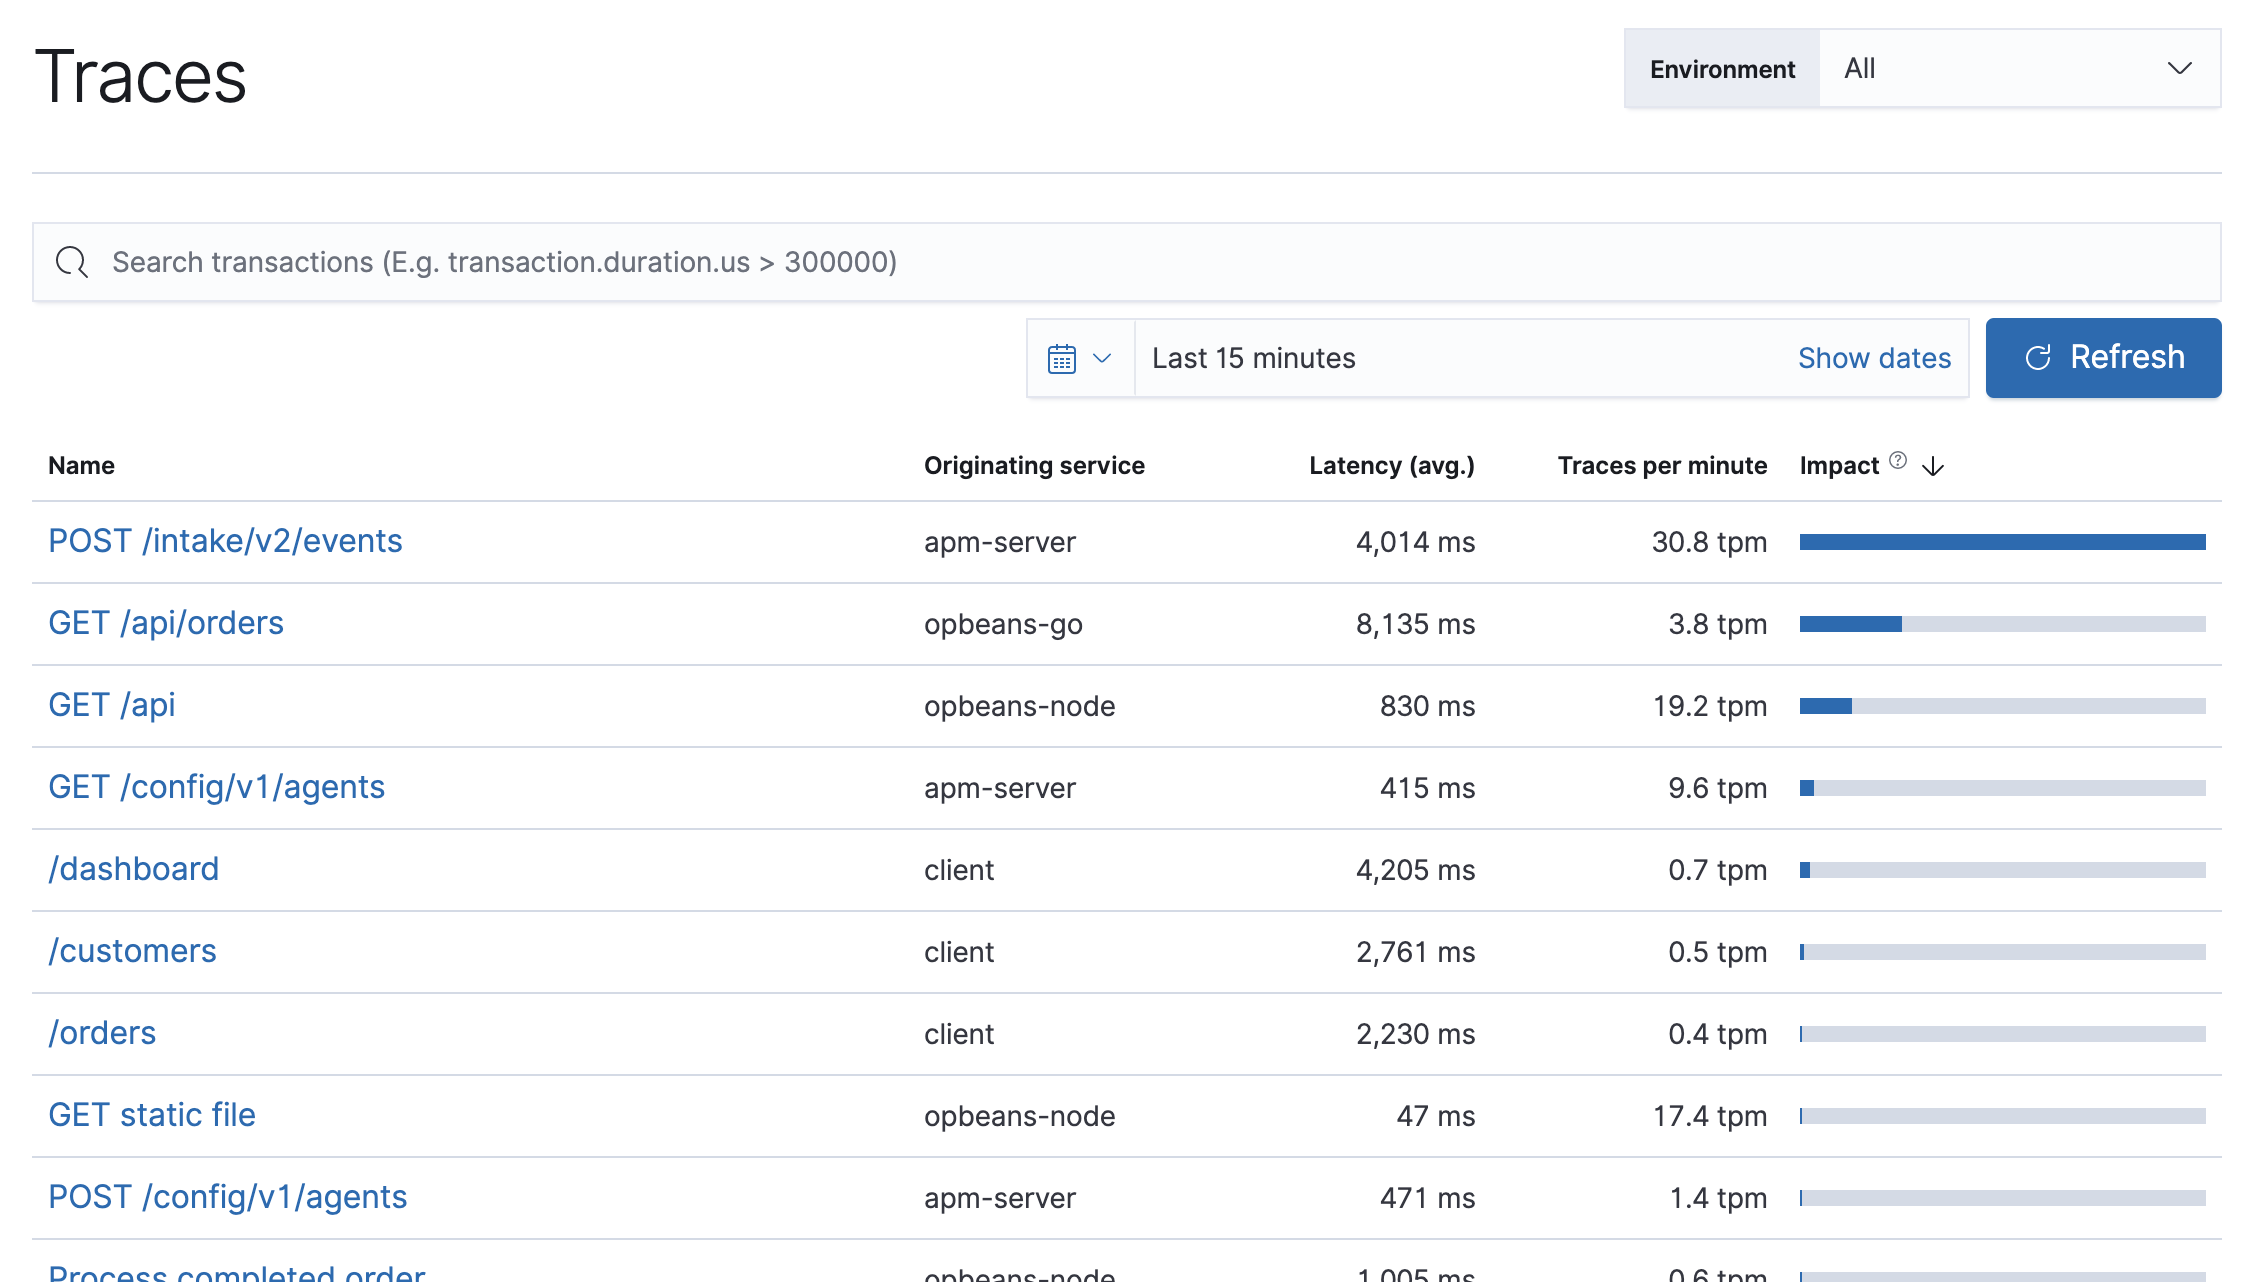
Traces displays your application’s entry (root) transactions. Transactions with the same name are grouped together and only shown once in this table. If you’re using distributed tracing, this view is key to finding the critical paths within your application.
By default, transactions are sorted by Impact. Impact helps show the most used and slowest endpoints in your service — in other words, it’s the collective amount of pain a specific endpoint is causing your users. If there’s a particular endpoint you’re worried about, select it to view its transaction details.
