Alerting
editAlerting
editAlerting allows you to define rules to detect complex conditions within different Kibana apps and trigger actions when those conditions are met. Alerting is integrated with Observability, Security, Maps and Machine Learning, can be centrally managed from the Management UI, and provides a set of built-in connectors and rules (known as stack rules) for you to use.
To make sure you can access alerting and actions, see the setup and prerequisites section.
Concepts and terminology
editAlerting works by running checks on a schedule to detect conditions defined by a rule. When a condition is met, the rule tracks it as an alert and responds by triggering one or more actions. Actions typically involve interaction with Kibana services or third party integrations. Connectors allow actions to talk to these services and integrations. This section describes all of these elements and how they operate together.
Rules
editA rule specifies a background task that runs on the Kibana server to check for specific conditions. Kibana provides two types of rules: stack rules that are built into Kibana and the rules that are registered by Kibana apps. For more information, refer to Rule types.
A rule consists of three main parts:
- Conditions: what needs to be detected?
- Schedule: when/how often should detection checks run?
- Actions: what happens when a condition is detected?
For example, when monitoring a set of servers, a rule might:
- Check for average CPU usage > 0.9 on each server for the last two minutes (condition).
- Check every minute (schedule).
-
Send a warning email message via SMTP with subject
CPU on {{server}} is high(action).

The following sections describe each part of the rule in more detail.
Conditions
editUnder the hood, Kibana rules detect conditions by running a JavaScript function on the Kibana server, which gives it the flexibility to support a wide range of conditions, anything from the results of a simple Elasticsearch query to heavy computations involving data from multiple sources or external systems.
These conditions are packaged and exposed as rule types. A rule type hides the underlying details of the condition, and exposes a set of parameters to control the details of the conditions to detect.
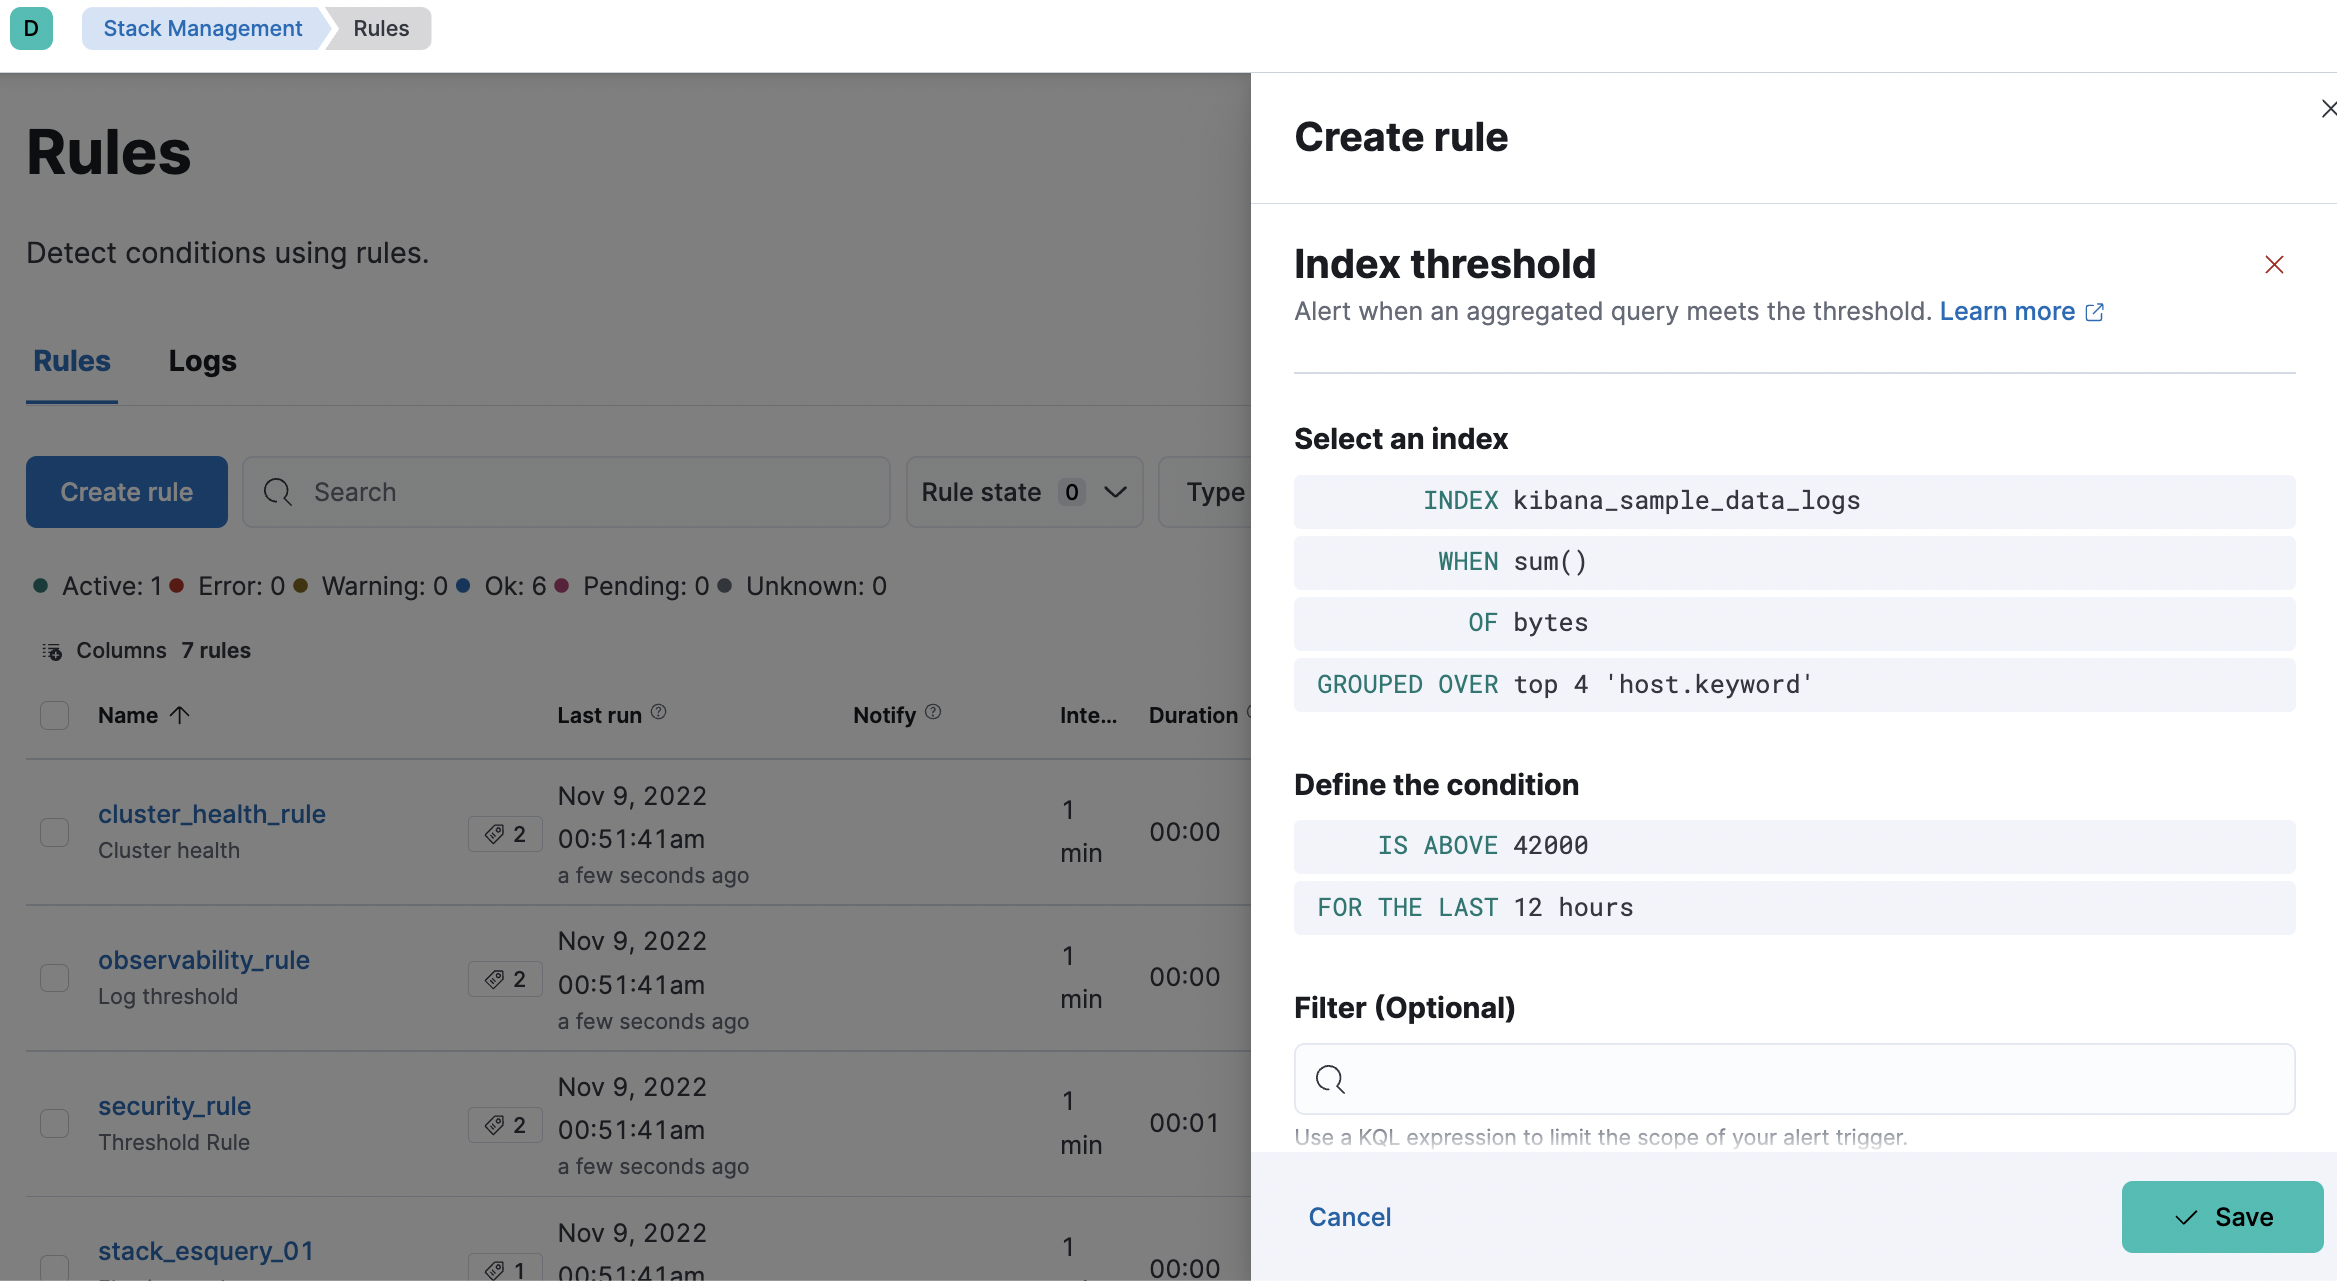
For example, an index threshold rule type lets you specify the index to query, an aggregation field, and a time window, but the details of the underlying Elasticsearch query are hidden.
See Rule types for the rules provided by Kibana and how they express their conditions.
Schedule
editRule schedules are defined as an interval between subsequent checks, and can range from a few seconds to months.
The intervals of rule checks in Kibana are approximate. Their timing is affected by factors such as the frequency at which tasks are claimed and the task load on the system. Refer to Alerting for more information.
Actions
editActions are invocations of connectors, which allow interaction with Kibana services or integrations with third-party systems. Actions run as background tasks on the Kibana server when rule conditions are met.
When defining actions in a rule, you specify:
- The connector type: the type of service or integration to use
- The connection for that type by referencing a connector
- A mapping of rule values to properties exposed for that type of action
The result is a template: all the parameters needed to invoke a service are supplied except for specific values that are only known at the time the rule condition is detected.
In the server monitoring example, the email connector type is used, and server is mapped to the body of the email, using the template string CPU on {{server}} is high.
When the rule detects the condition, it creates an alert containing the details of the condition, renders the template with these details such as server name, and runs the action on the Kibana server by invoking the email connector type.

See Connectors for details on the types of connectors provided by Kibana.
Alerts
editWhen checking for a condition, a rule might identify multiple occurrences of the condition. Kibana tracks each of these alerts separately and takes an action per alert.
Using the server monitoring example, each server with average CPU > 0.9 is tracked as an alert. This means a separate email is sent for each server that exceeds the threshold.

Connectors
editActions often involve connecting with services inside Kibana or integrating with third-party systems. Rather than repeatedly entering connection information and credentials for each action, Kibana simplifies action setup using connectors.
Connectors provide a central place to store connection information for services and integrations. For example if four rules send email notifications via the same SMTP service, they can all reference the same SMTP connector. When the SMTP settings change, you can update them once in the connector, instead of having to update four rules.

Putting it all together
editA rule consists of conditions, actions, and a schedule. When conditions are met, alerts are created that render actions and invoke them. To make action setup and update easier, actions use connectors that centralize the information used to connect with Kibana services and third-party integrations. The following example ties these concepts together:

- Anytime a rule’s conditions are met, an alert is created. This example checks for servers with average CPU > 0.9. Three servers meet the condition, so three alerts are created.
- Alerts create actions as long as they are not muted or throttled. When actions are created, the template that was setup in the rule is filled with actual values. In this example, three actions are created, and the template string {{server}} is replaced with the server name for each alert.
- Kibana invokes the actions, sending them to a third party integration like an email service.
- If the third party integration has connection parameters or credentials, Kibana will fetch these from the connector referenced in the action.
Differences from Watcher
editWatcher and the Kibana alerting features are both used to detect conditions and can trigger actions in response, but they are completely independent alerting systems.
This section will clarify some of the important differences in the function and intent of the two systems.
Functionally, the alerting features differ in that:
- Scheduled checks are run on Kibana instead of Elasticsearch
- Kibana rules hide the details of detecting conditions through rule types, whereas watches provide low-level control over inputs, conditions, and transformations.
- Kibana rules track and persist the state of each detected condition through alerts. This makes it possible to mute and throttle individual alerts, and detect changes in state such as resolution.
- Actions are linked to alerts in Alerting. Actions are fired for each occurrence of a detected condition, rather than for the entire rule.
At a higher level, the alerting features allow rich integrations across use cases like APM, Metrics, Security, and Uptime. Prepackaged rule types simplify setup and hide the details of complex, domain-specific detections, while providing a consistent interface across Kibana.