Beats Monitoring Metrics
editBeats Monitoring Metrics
editIf you are monitoring Beats, the Stack Monitoring page in Kibana contains a panel for Beats in the cluster overview.
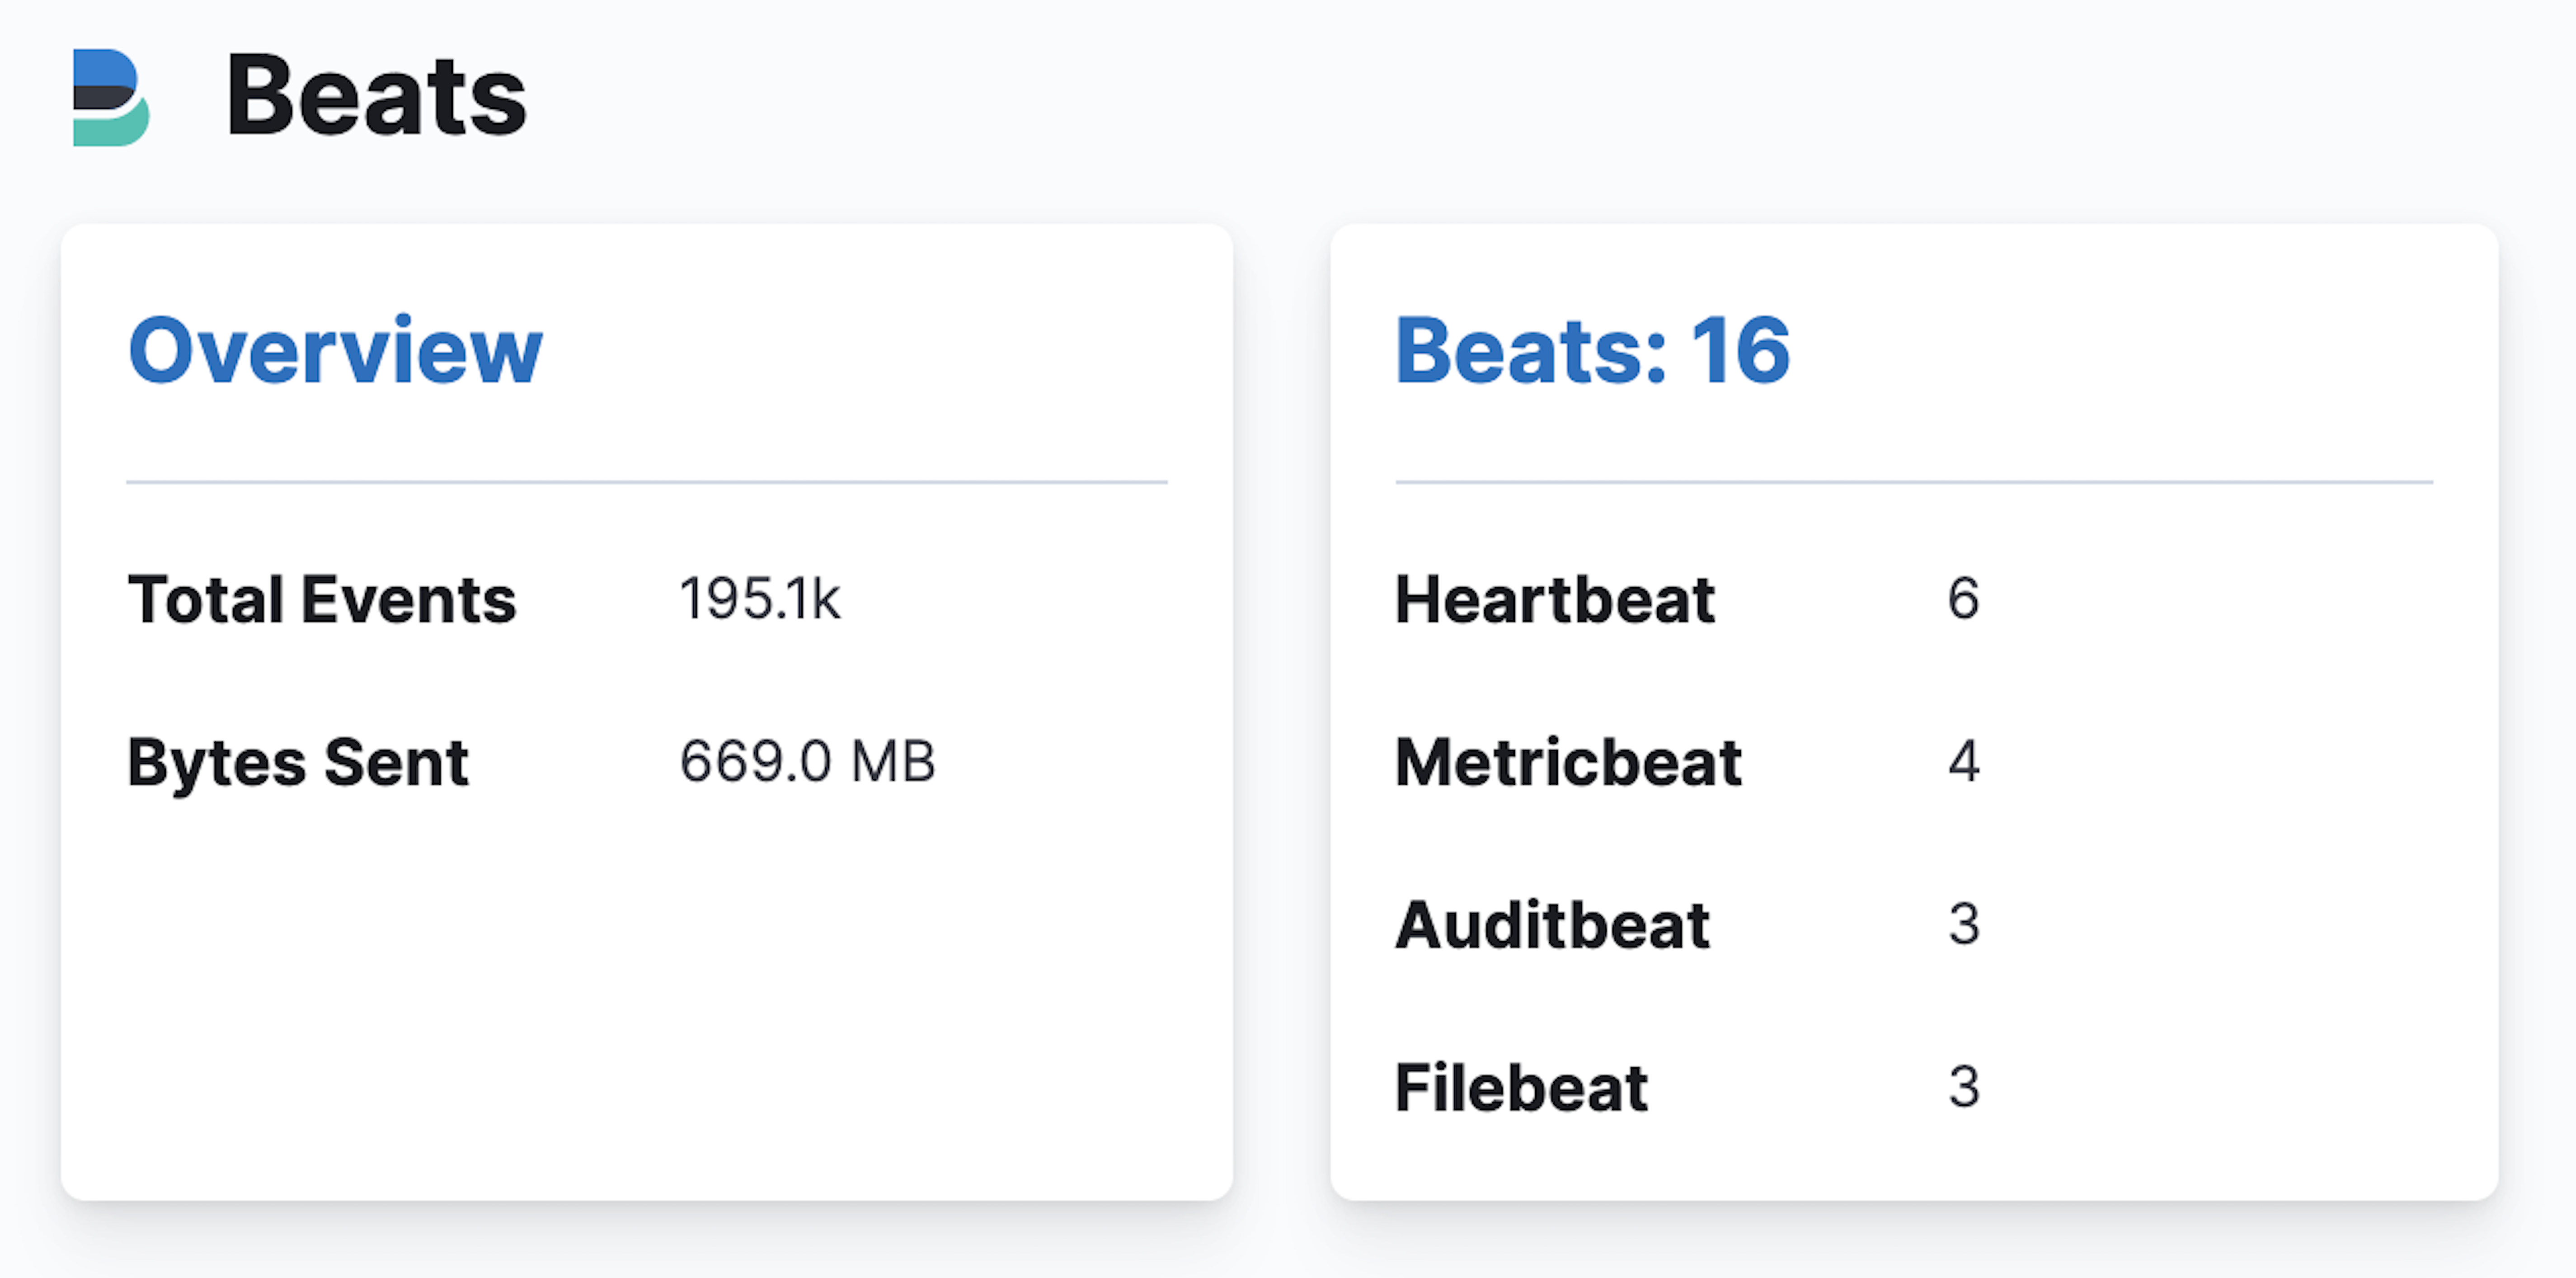
To view an overview of the Beats data in the cluster, click Overview. The overview page has a section for activity in the last day, which is a real-time sample of data. The summary bar and charts follow the typical paradigm of data in the Monitoring UI, which is bound to the span of the time filter. This overview page can therefore show up-to-date or historical information.
To view a listing of the individual Beat instances in the cluster, click Beats. The table listing shows each Beat instance that reports data to the monitoring cluster. All columns are sortable. Clicking a Beat name takes you to the detail page. For example:
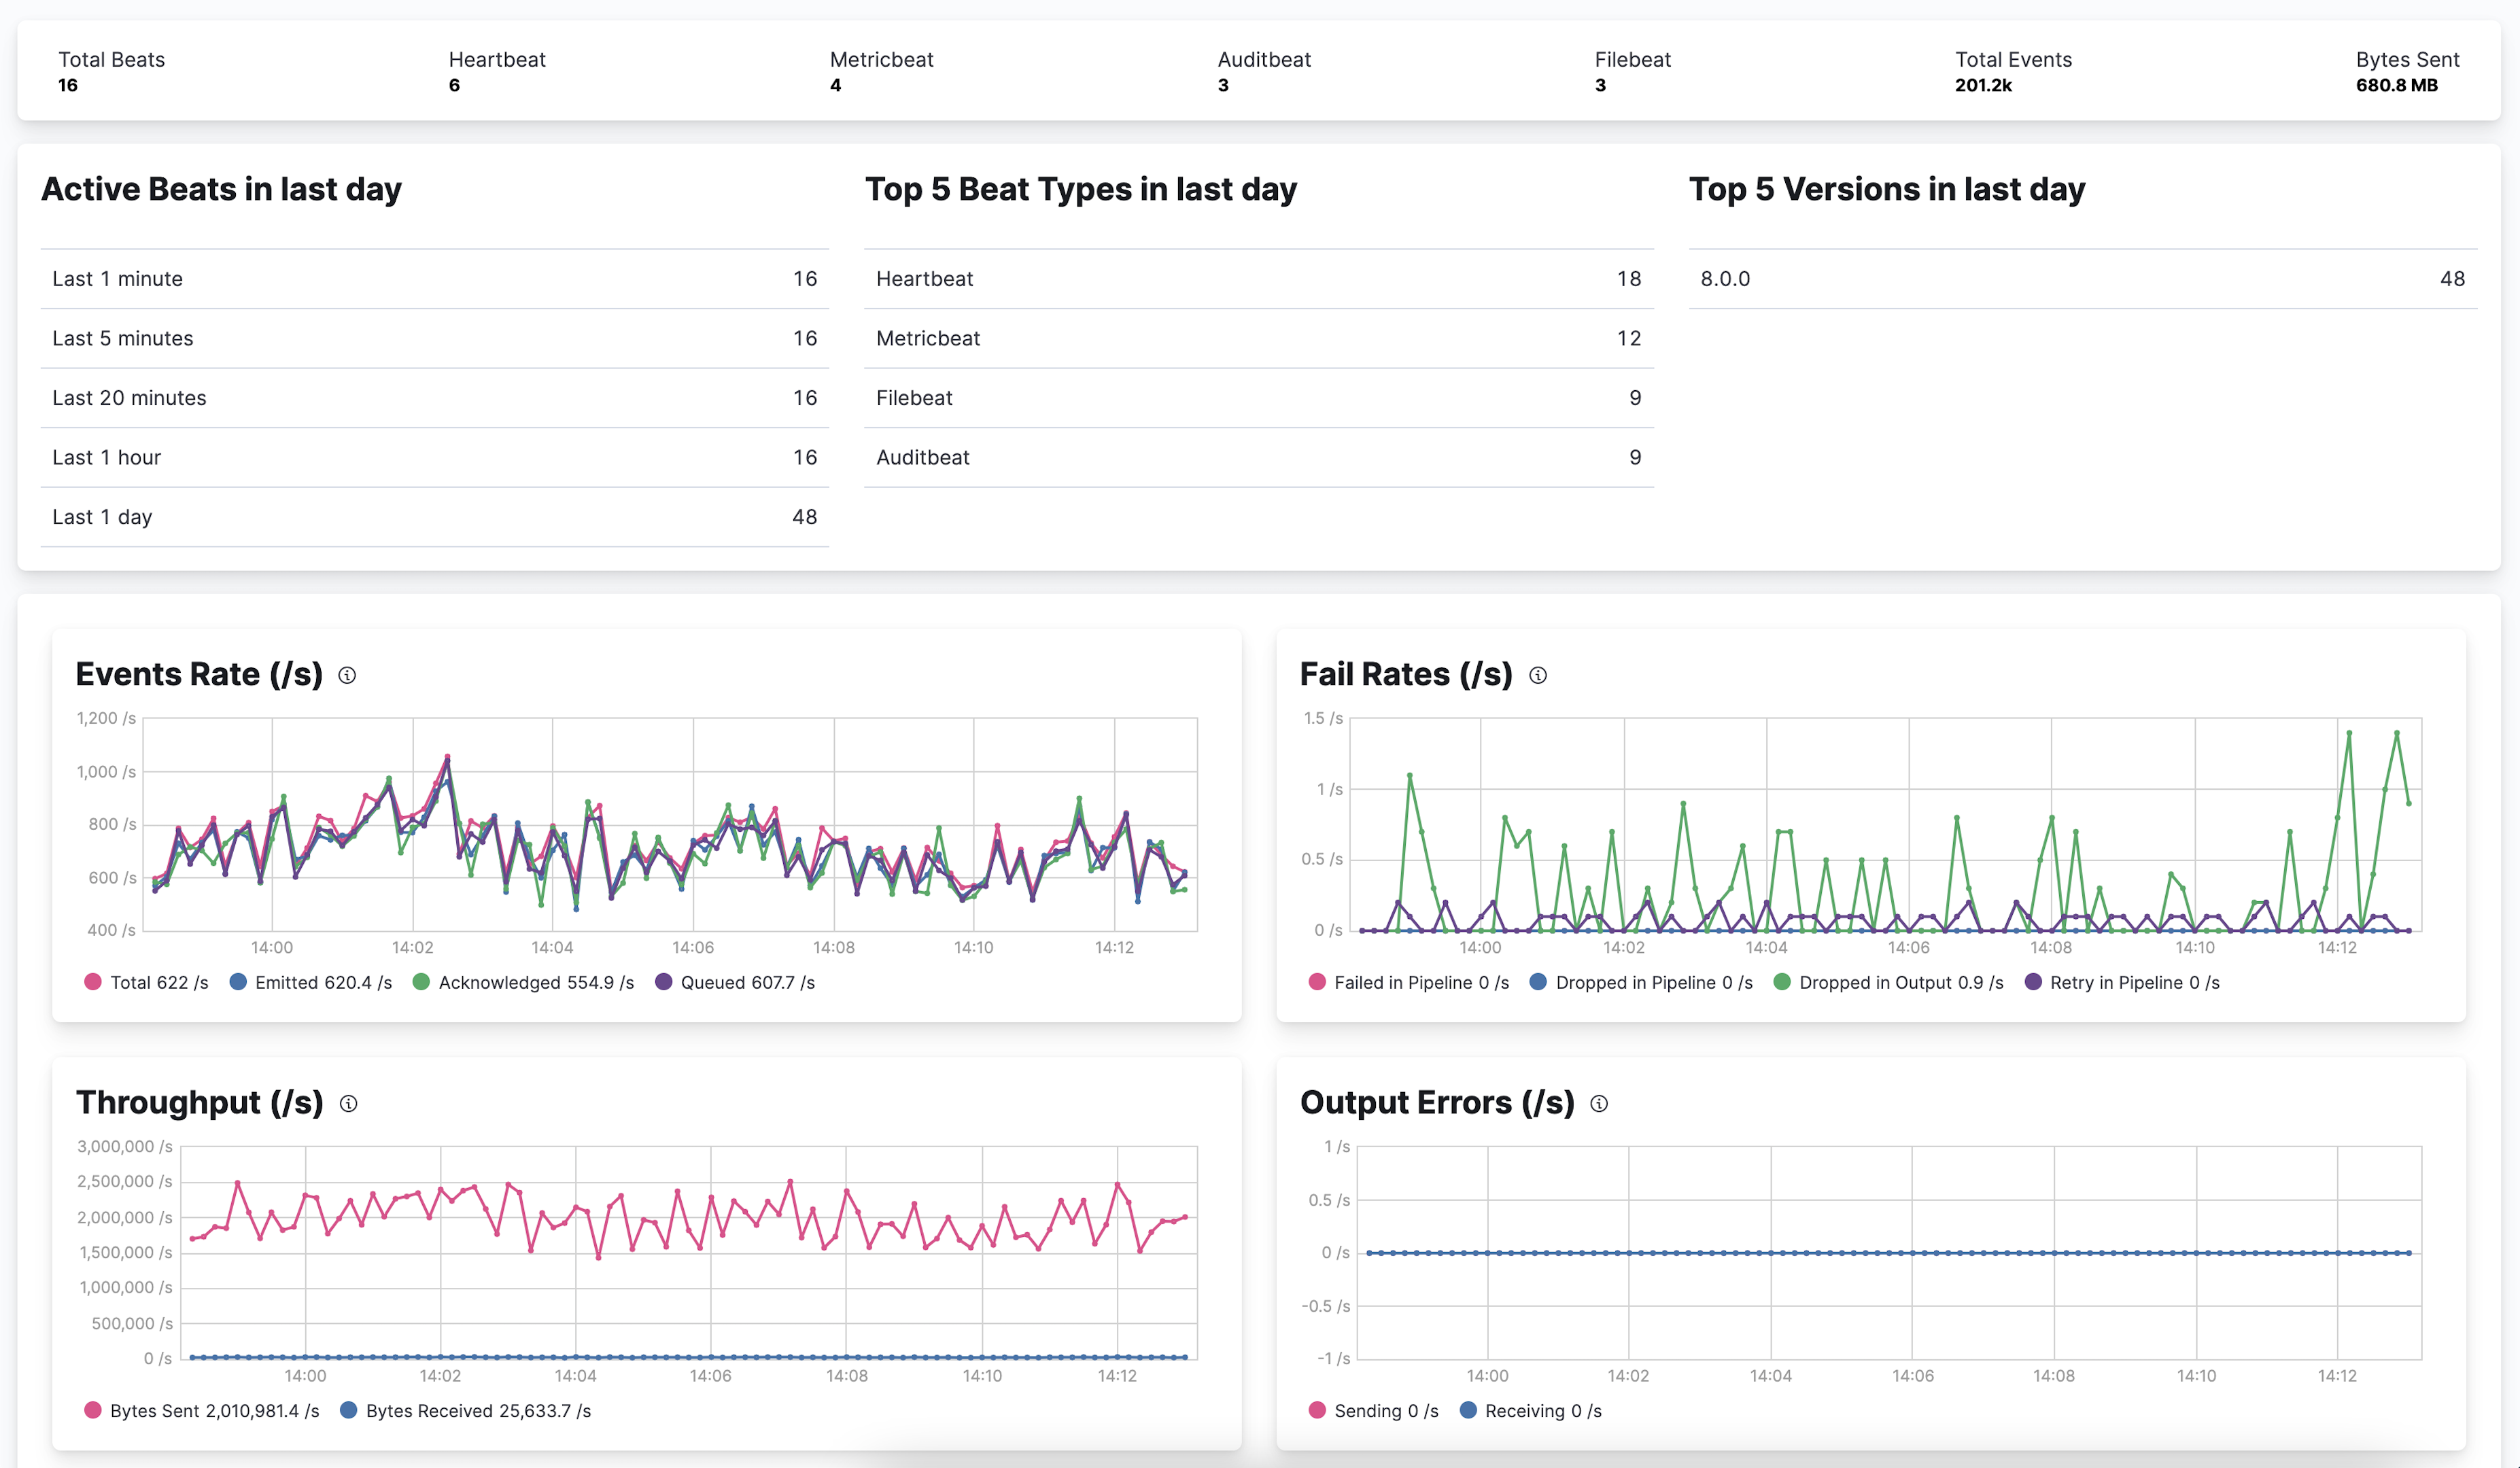
The detail page contains a summary bar and charts. There are more charts on this page than the overview page and they are specific to a single Beat instance.