Index threshold
editIndex threshold
editThe index threshold rule type runs an Elasticsearch query. It aggregates field values from documents, compares them to threshold values, and schedules actions to run when the thresholds are met.
Create the rule
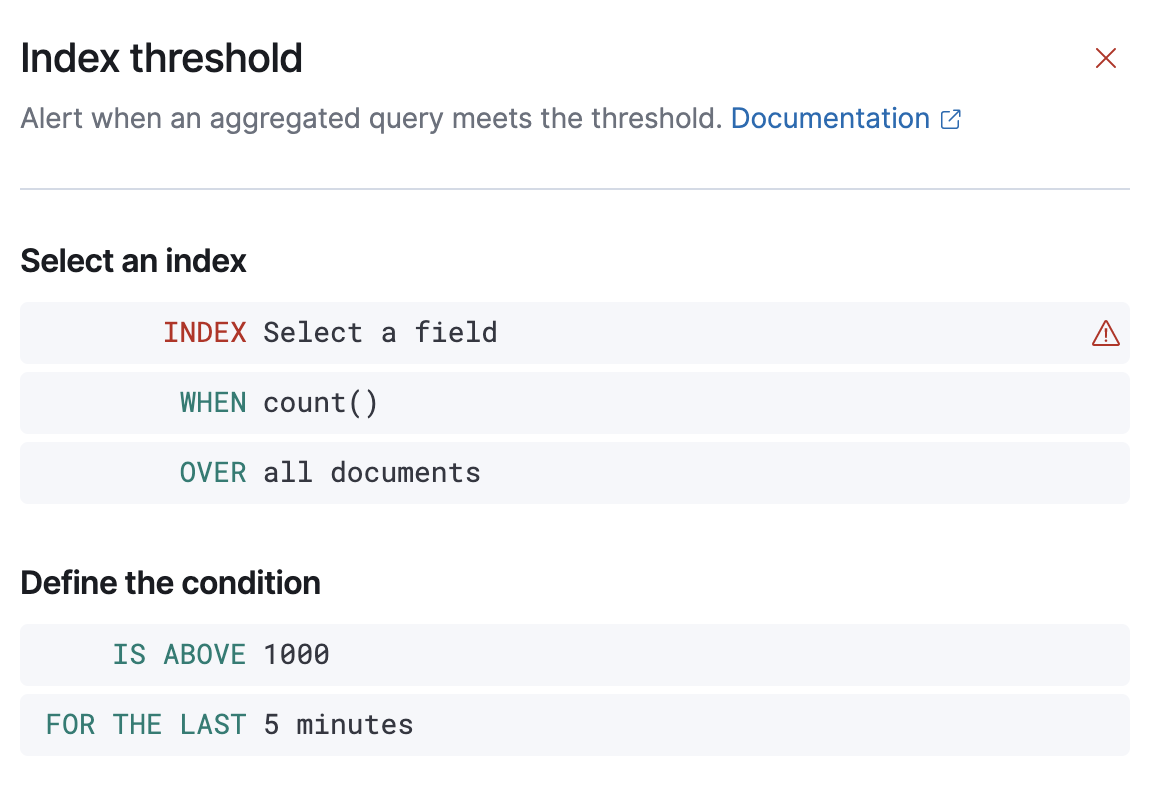
editFill in the rule details, then select Index Threshold.
Define the conditions
editDefine properties to detect the condition.
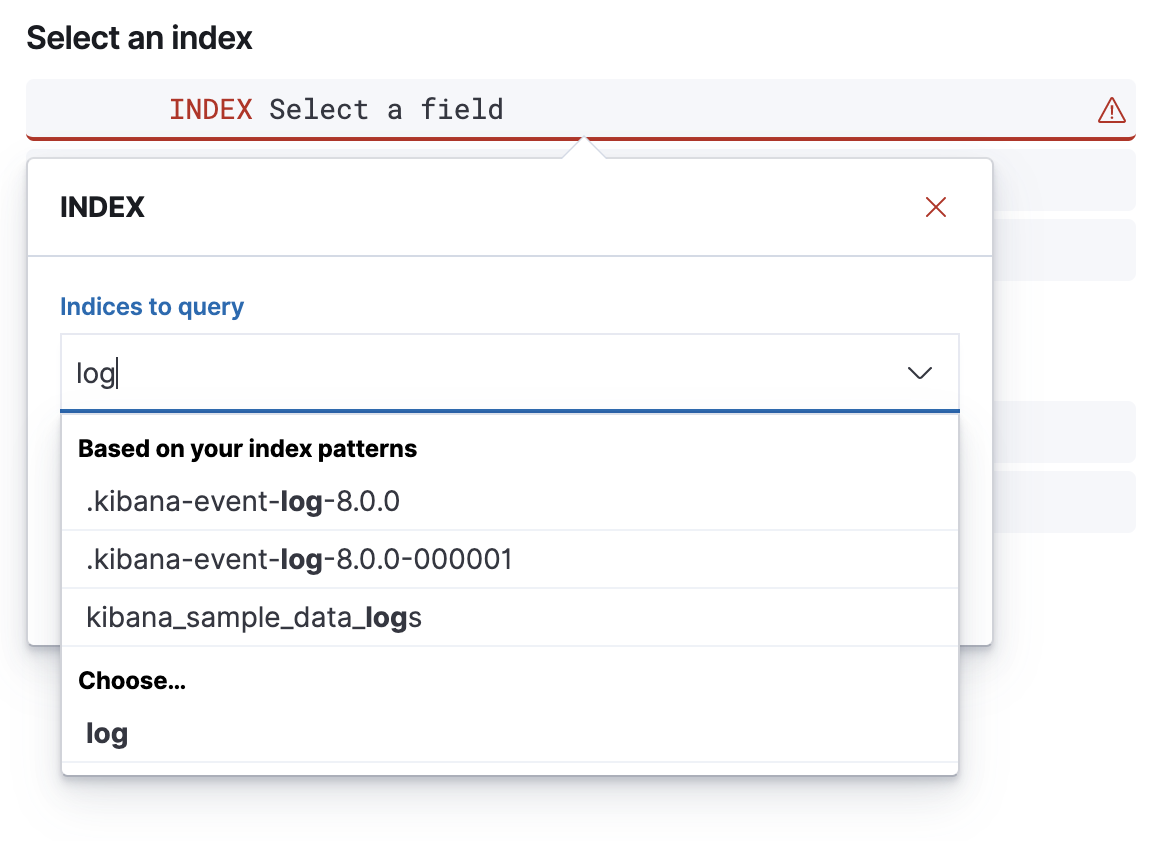
- Index
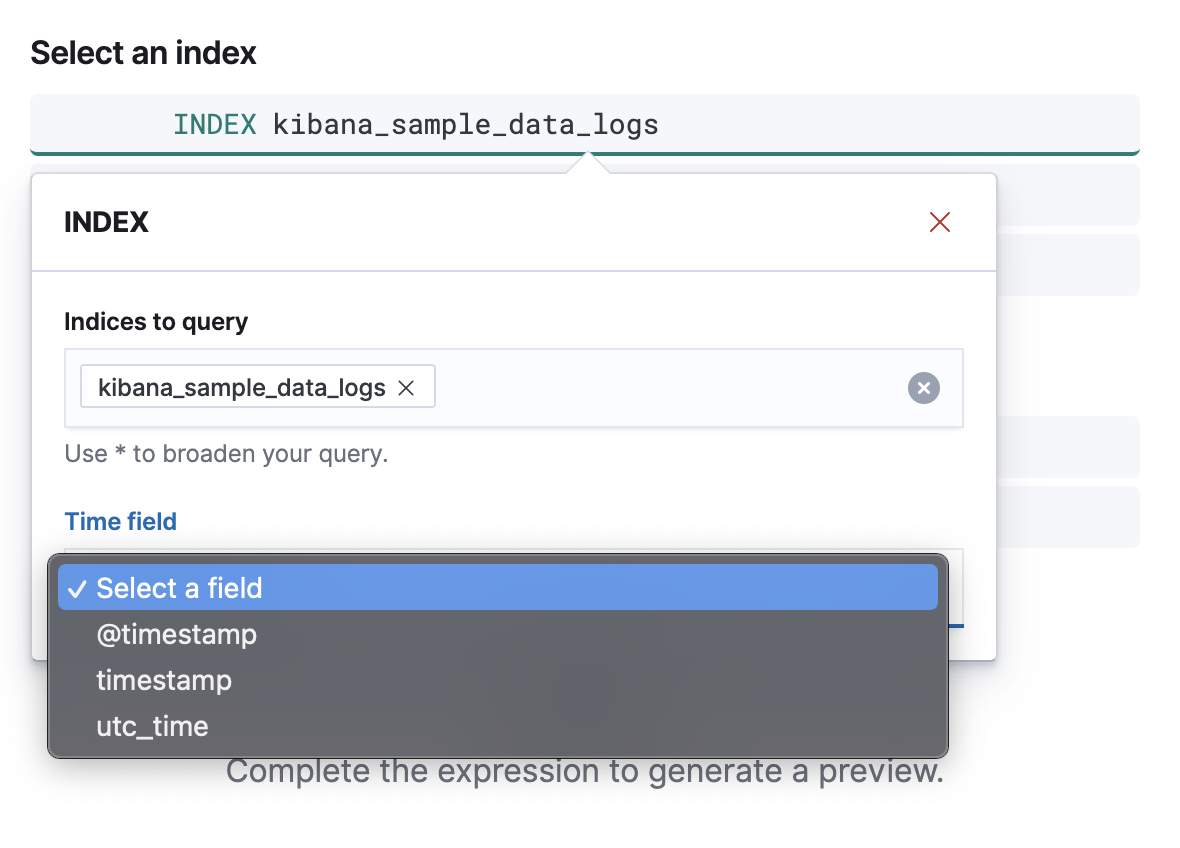
- This clause requires an index or data view and a time field that will be used for the time window.
- When
-
This clause specifies how the value to be compared to the threshold is calculated. The value is calculated by aggregating a numeric field a the time window. The aggregation options are:
count,average,sum,min, andmax. When usingcountthe document count is used, and an aggregation field is not necessary. - Over/Grouped Over
- This clause lets you configure whether the aggregation is applied over all documents, or should be split into groups using a grouping field. If grouping is used, an alert will be created for each group when it exceeds the threshold. To limit the number of alerts on high cardinality fields, you must specify the number of groups to check against the threshold. Only the top groups are checked.
- Threshold
-
This clause defines a threshold value and a comparison operator (one of
is above,is above or equals,is below,is below or equals, oris between). The result of the aggregation is compared to this threshold. - Time window
- This clause determines how far back to search for documents, using the time field set in the index clause. Generally this value should be to a value higher than the check every value in the general rule details, to avoid gaps in detection.
If data is available and all clauses have been defined, a preview chart will render the threshold value and display a line chart showing the value for the last 30 intervals. This can provide an indication of recent values and their proximity to the threshold, and help you tune the clauses.
Add action variables
editAdd an action to run when the rule condition is met. The following variables are specific to the index threshold rule. You can also specify variables common to all rules.
-
context.title -
A preconstructed title for the rule. Example:
rule kibana sites - high egress met threshold. -
context.message -
A preconstructed message for the rule. Example:
rule 'kibana sites - high egress' is active for group 'threshold met':
- Value: 42
- Conditions Met: count greater than 4 over 5m
- Timestamp: 2020-01-01T00:00:00.000Z -
context.group -
The name of the action group associated with the threshold condition. Example:
threshold met. -
context.date -
The date, in ISO format, that the rule met the threshold condition. Example:
2020-01-01T00:00:00.000Z. -
context.value - The value for the rule that met the threshold condition.
-
context.conditions -
A description of the threshold condition. Example:
count greater than 4
Example
editIn this example, you will use the Kibana sample weblog dataset to set up and tune the conditions on an index threshold rule. For this example, you want to detect when any of the top four sites serve more than 420,000 bytes over a 24 hour period.
- Open the main menu, then click Stack Management > Rules and Connectors.
-
Create a new rule that is checked every four hours and triggers actions when the rule status changes.
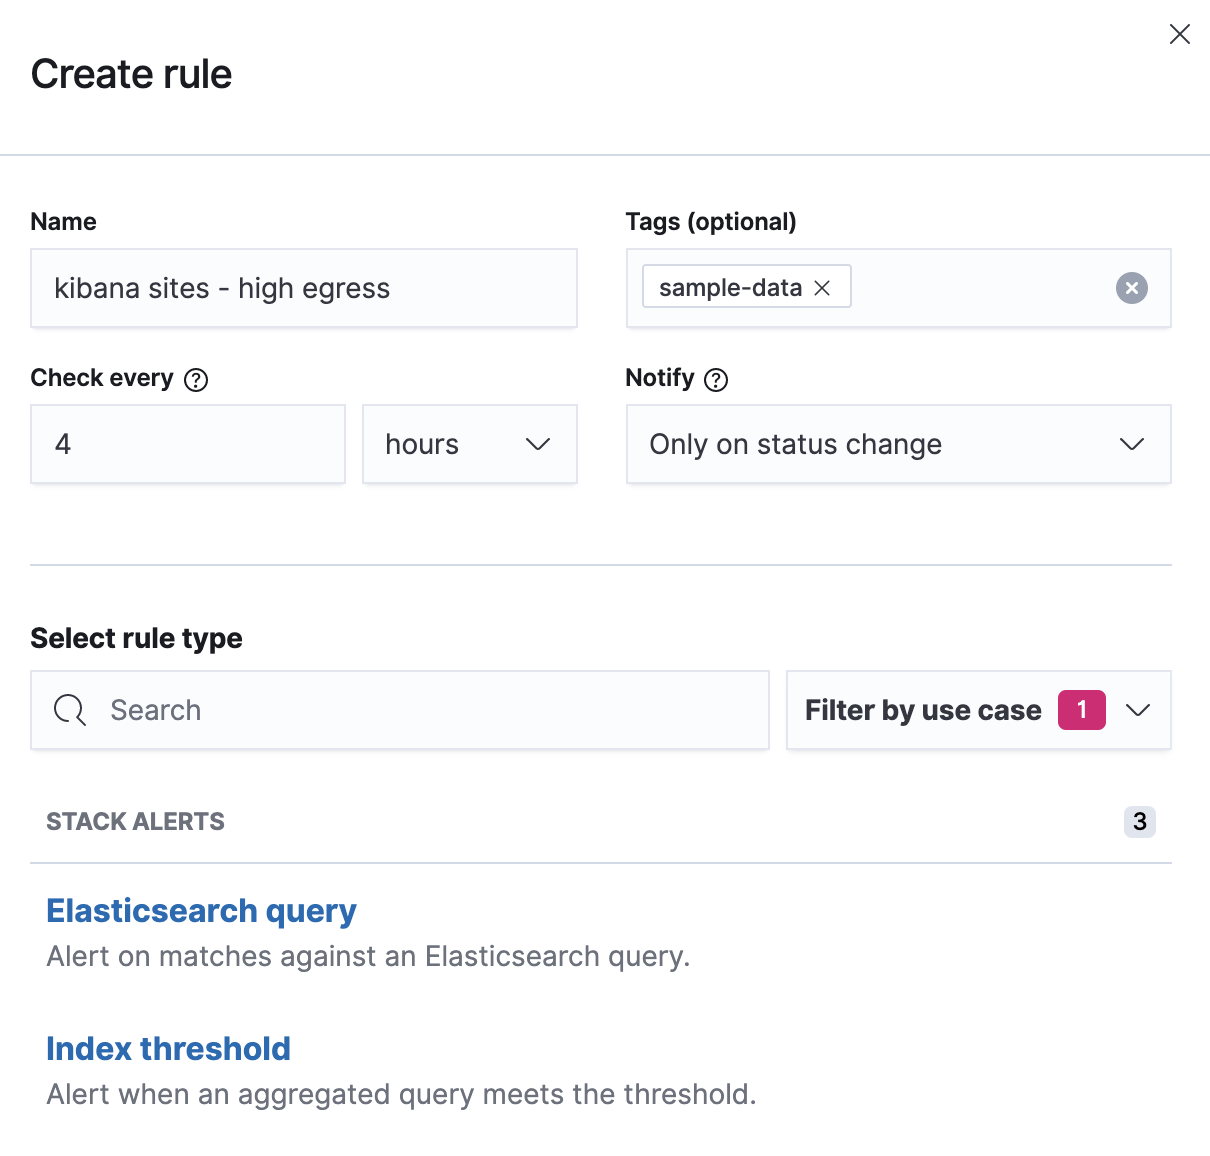
- Select the Index threshold rule type.
-
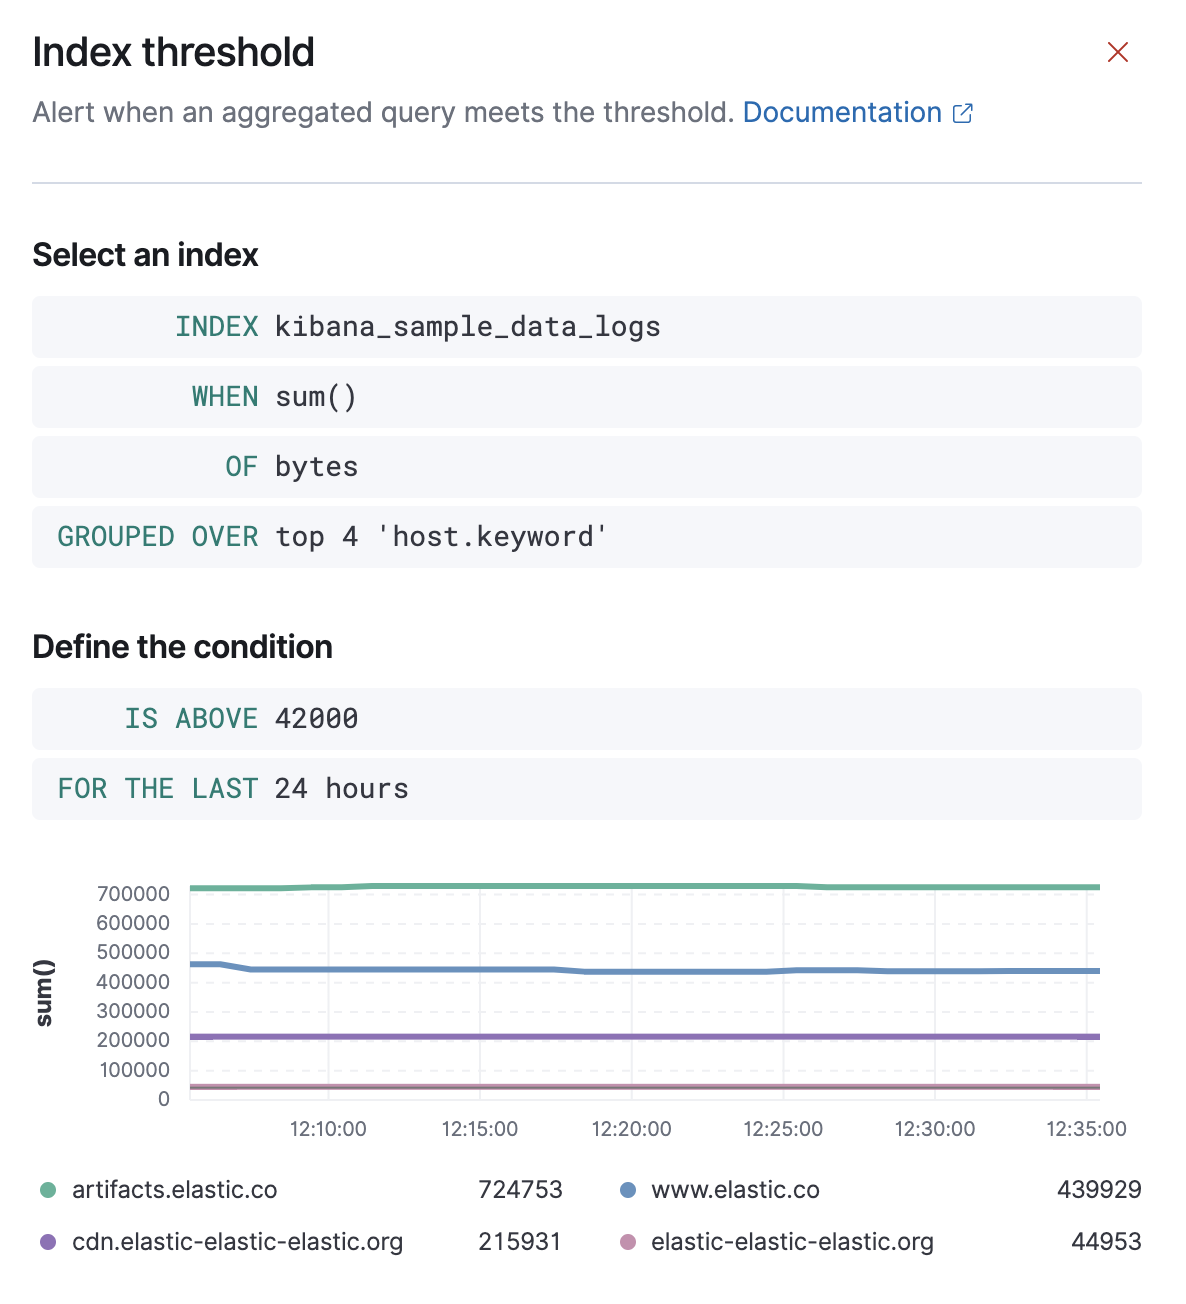
Click Index, and set Indices to query to kibana_sample_data_logs.
-
Set the Time field to @timestamp.
-
To detect the number of bytes served during the time window, click When and select
sumas the aggregation, and bytes as the field to aggregate.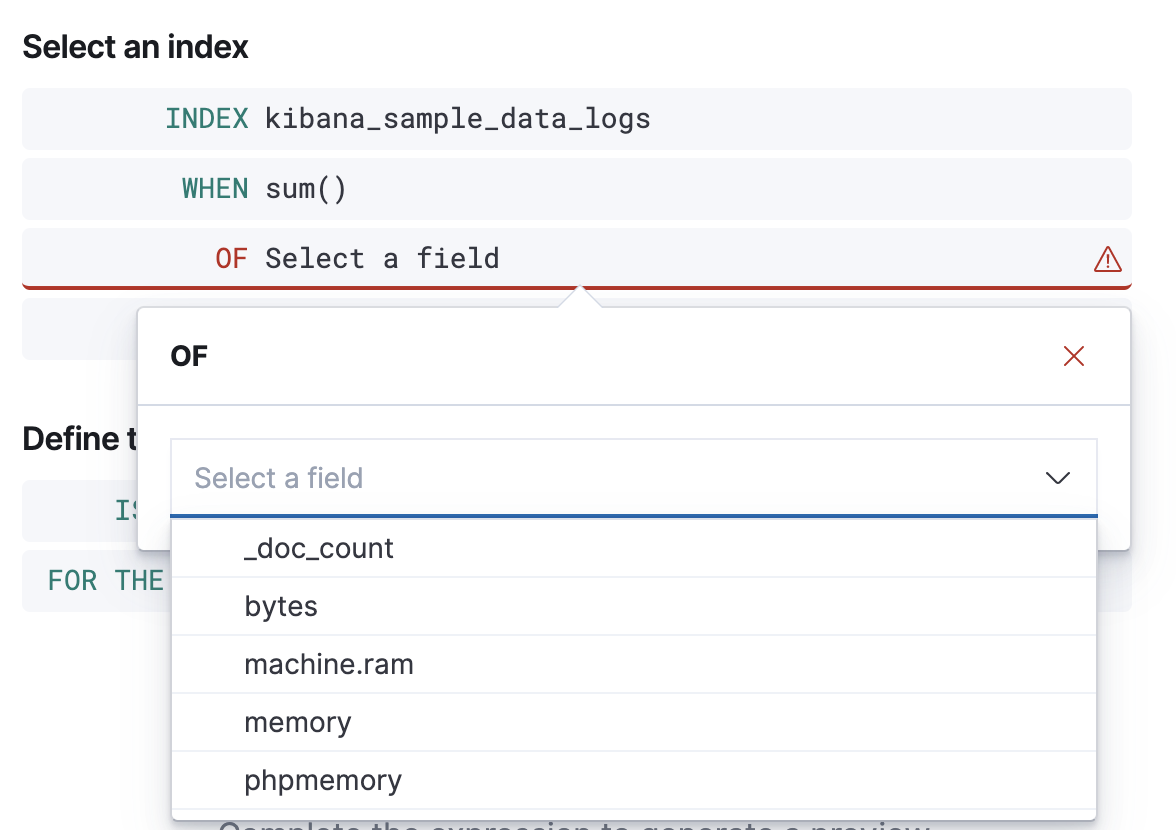
-
To detect the four sites that have the most traffic, click Over and select
top, enter4, and selecthost.keywordas the field.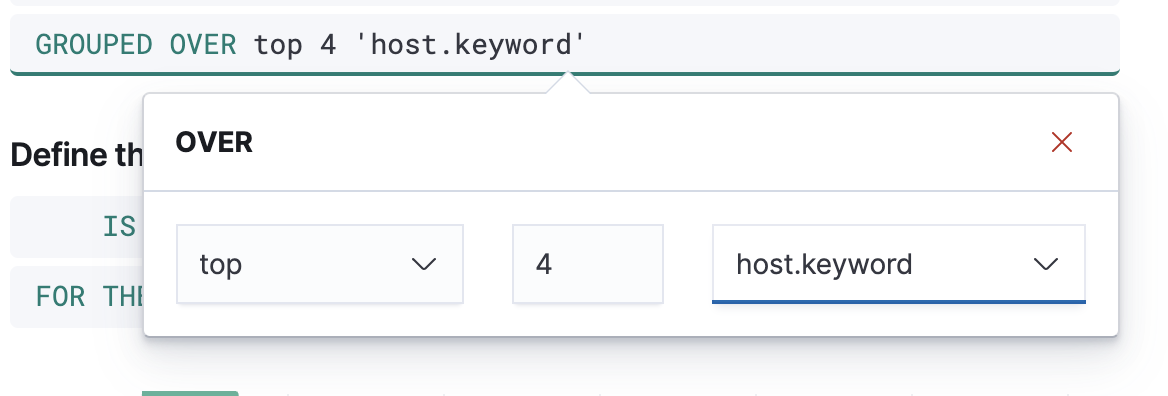
-
To trigger the rule when any of the top four sites exceeds 420,000 bytes over a 24 hour period, select
is aboveand enter420000.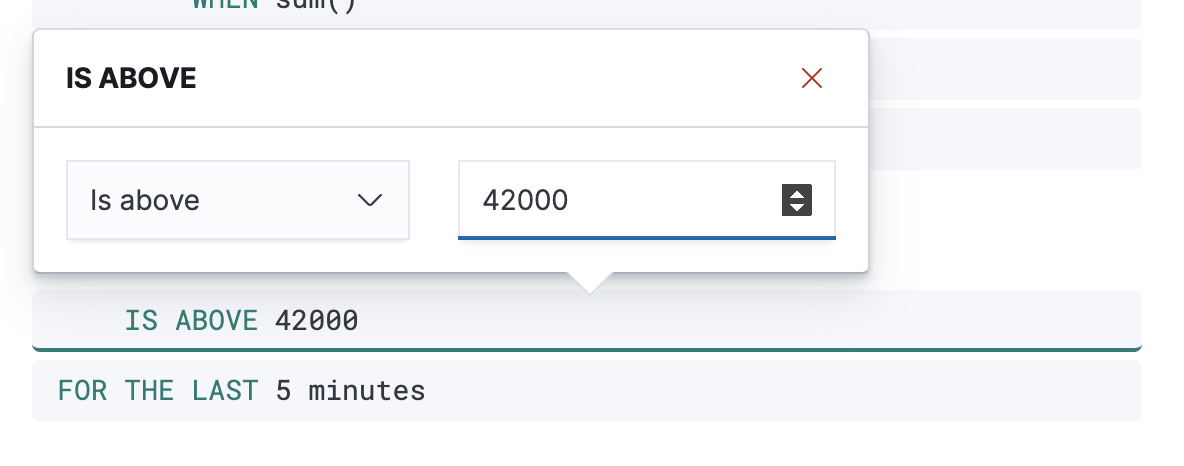
-
Finally, click For the last, enter
24and selecthoursto complete the rule configuration.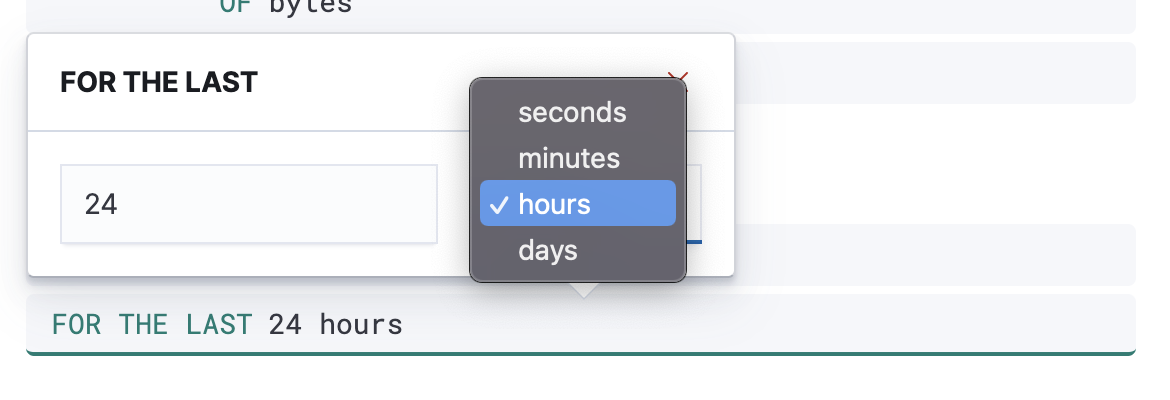
-
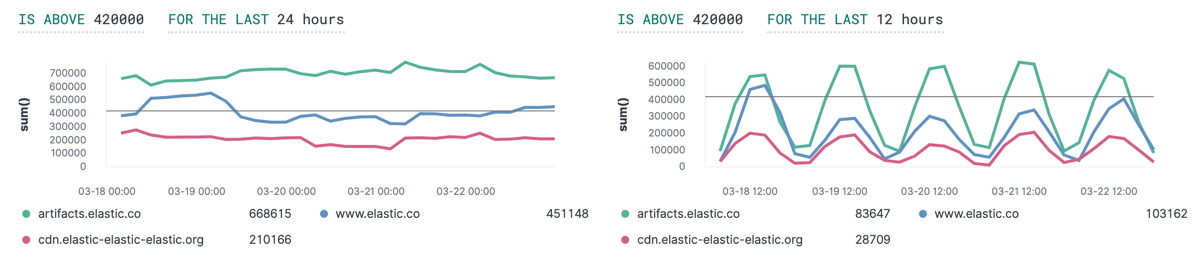
The preview chart will render showing the 24 hour sum of bytes at 4 hours intervals (the check every interval) for the past 120 hours (the last 30 intervals).
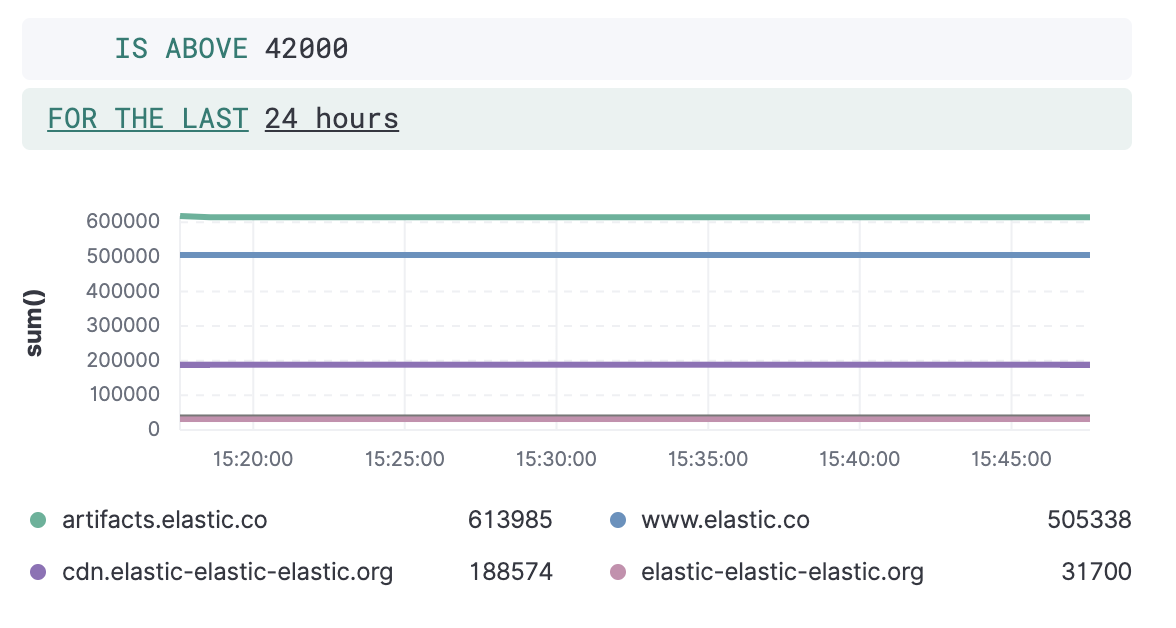
-
Change the time window and observe the effect it has on the chart. Compare a 24 window to a 12 hour window. Notice the variability in the sum of bytes, due to different traffic levels during the day compared to at night. This variability would result in noisy rules, so the 24 hour window is better. The preview chart can help you find the right values for your rule.