Add data
editAdd data
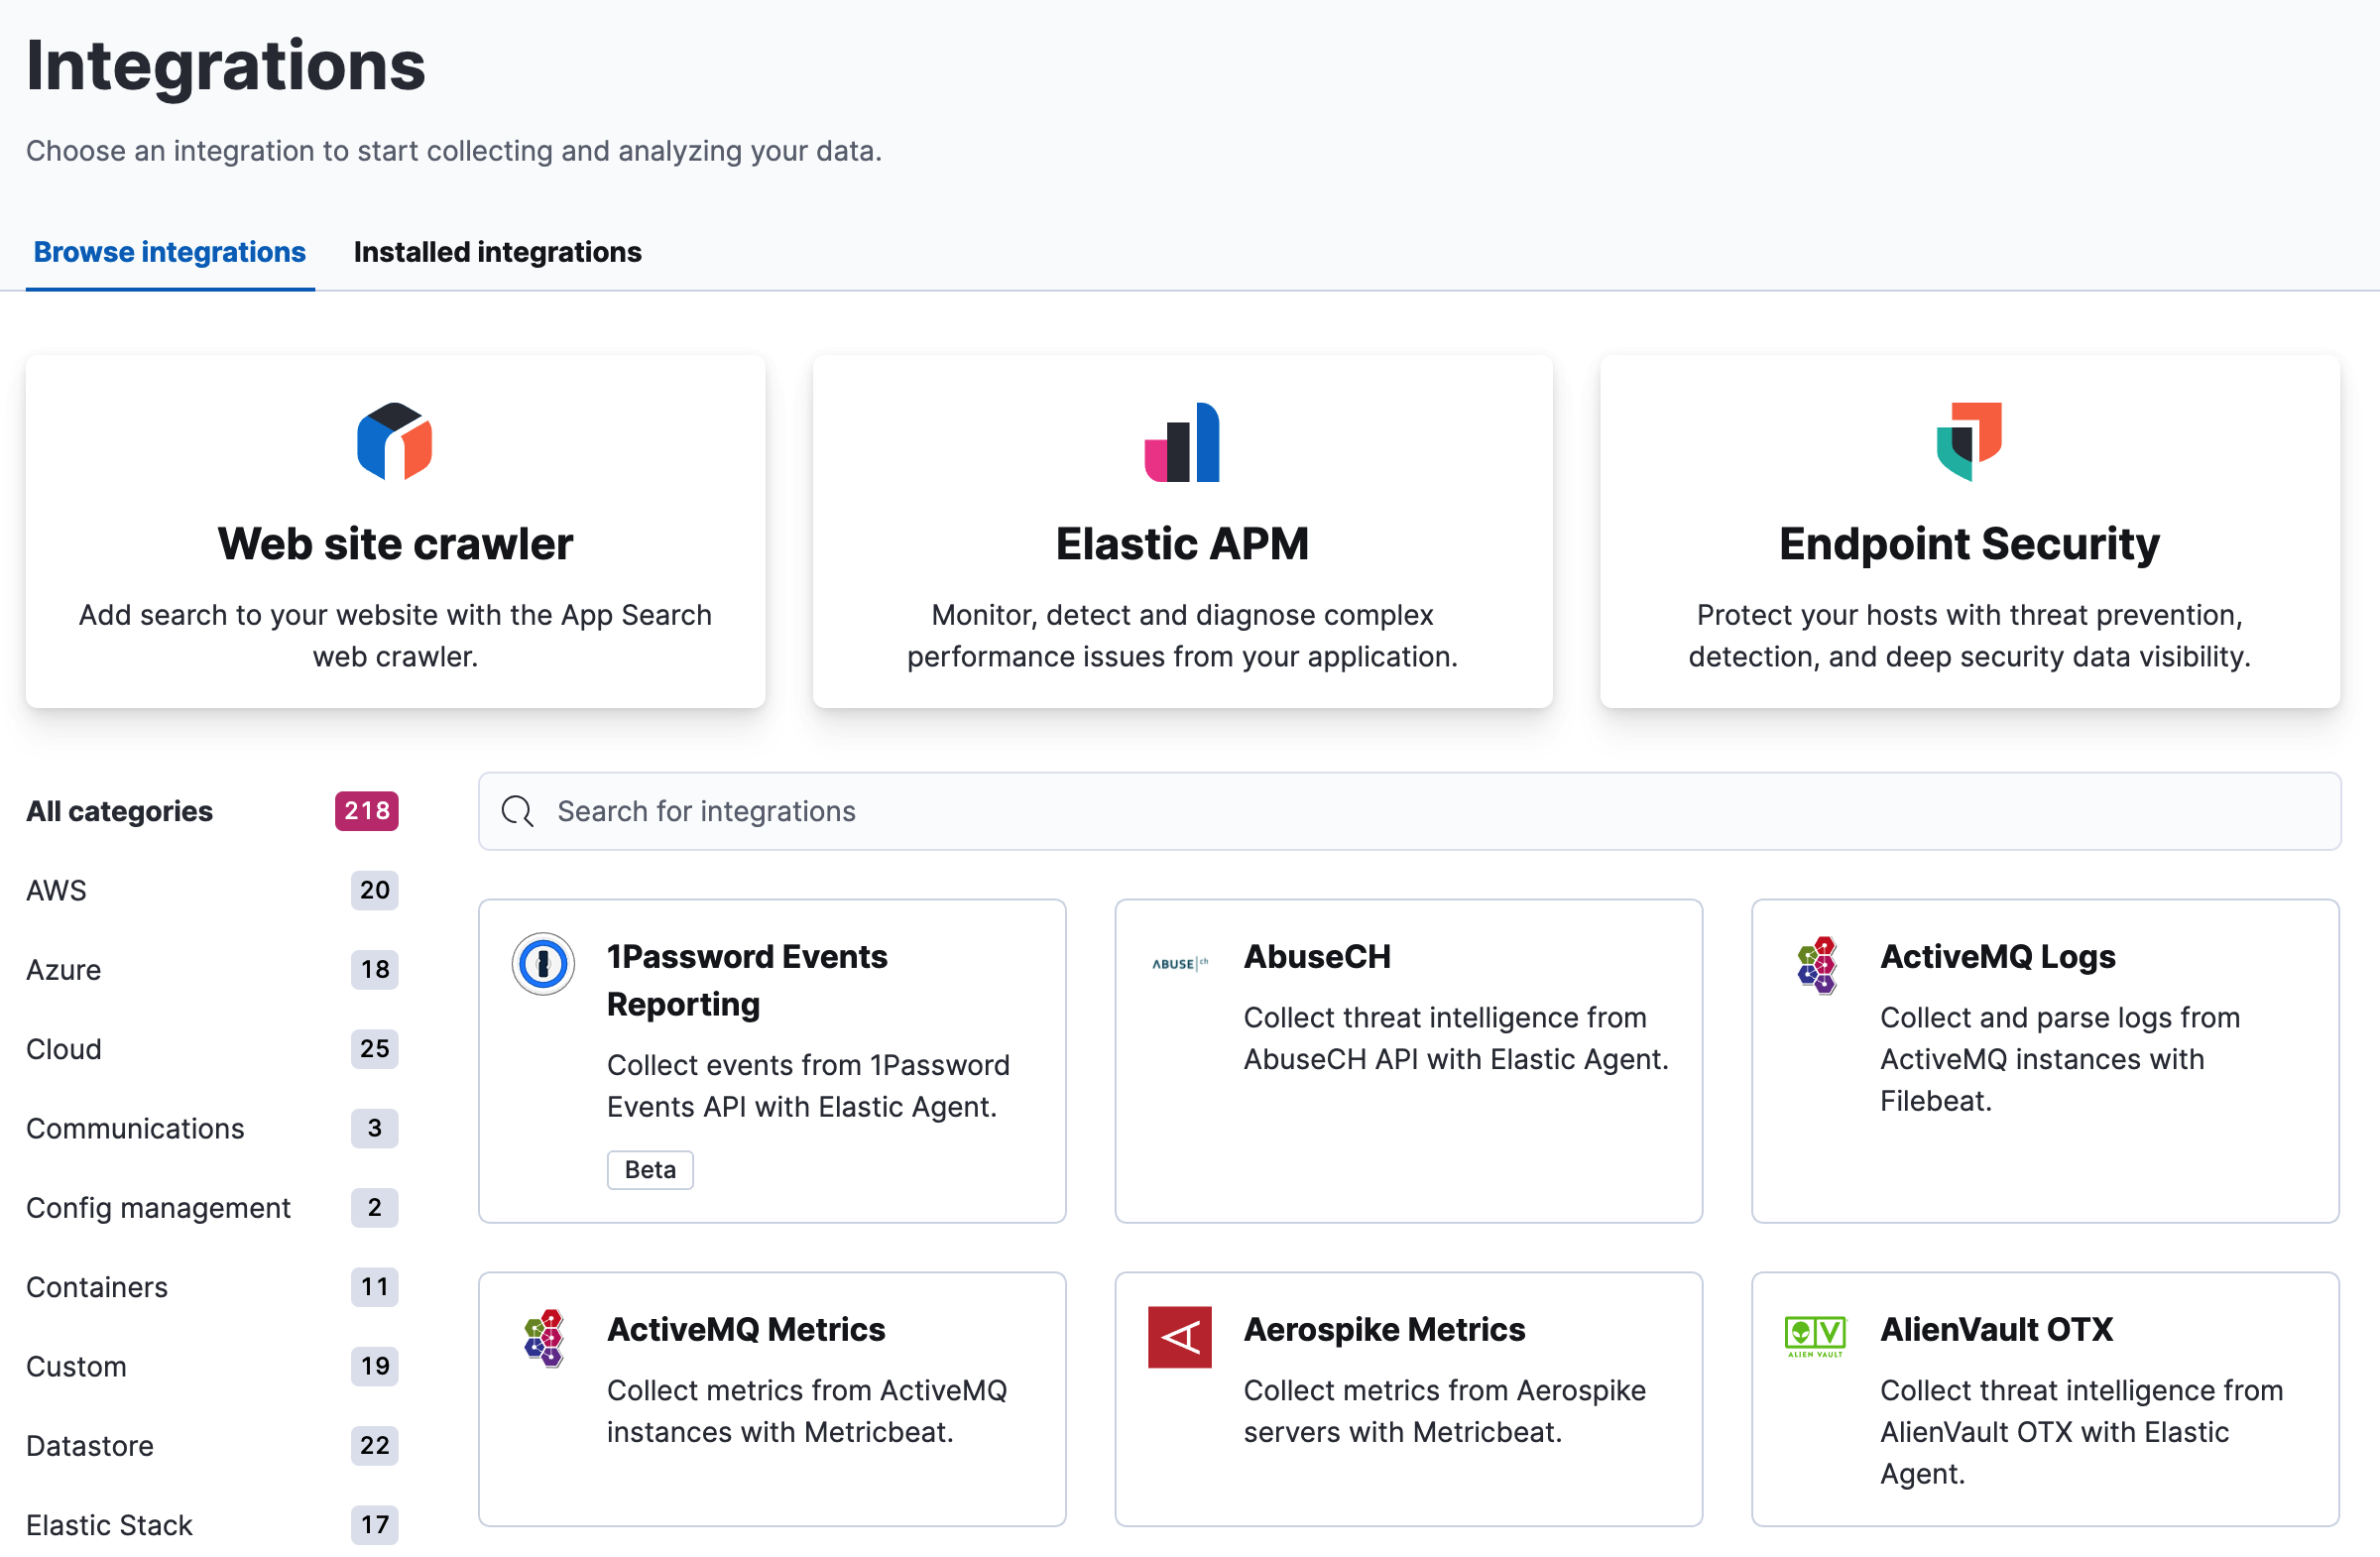
editThe best way to add data to the Elastic Stack is to use one of our many integrations, which are pre-packaged assets that are available for a wide array of popular services and platforms. With integrations, you can add monitoring for logs and metrics, protect systems from security threats, and more.
All integrations are available in a single view, and Kibana guides you there from the Welcome screen, home page, and main menu.
When an integration is available for both Elastic Agent and Beats, the Integrations view defaults to the Elastic Agent integration, if it is generally available (GA). To show a Beats integration, use the filter below the side navigation.
Add data with Elastic solutions
editA good place to start is with one of our Elastic solutions, which offer experiences for common use cases.
- Web site search crawler. Discover, extract, and index your web content into App Search engines using the Enterprise Search web site crawler. Search across Google Drive, GitHub, Salesforce, and many other web services using Workplace Search content sources.
- Elastic APM. Get logs, metrics, traces, and uptime data into the Elastic Stack. Integrations are available for popular services and platforms, such as Nginx, AWS, and MongoDB, and generic input types like log files. Refer to Elastic Observability for more information.
- Endpoint Security. Protect your hosts and send logs, metrics, and endpoint security data to Elastic Security. Refer to Ingest data to Elastic Security for more information.
Add data with programming languages
editAdd any data to the Elastic Stack using a programming language, such as JavaScript, Java, Python, and Ruby. Details for each programming language library that Elastic provides are in the Elasticsearch Client documentation.
If you are running Kibana on our hosted Elasticsearch Service, click View deployment details on the Integrations view to verify your Elasticsearch endpoint and Cloud ID, and create API keys for integration.
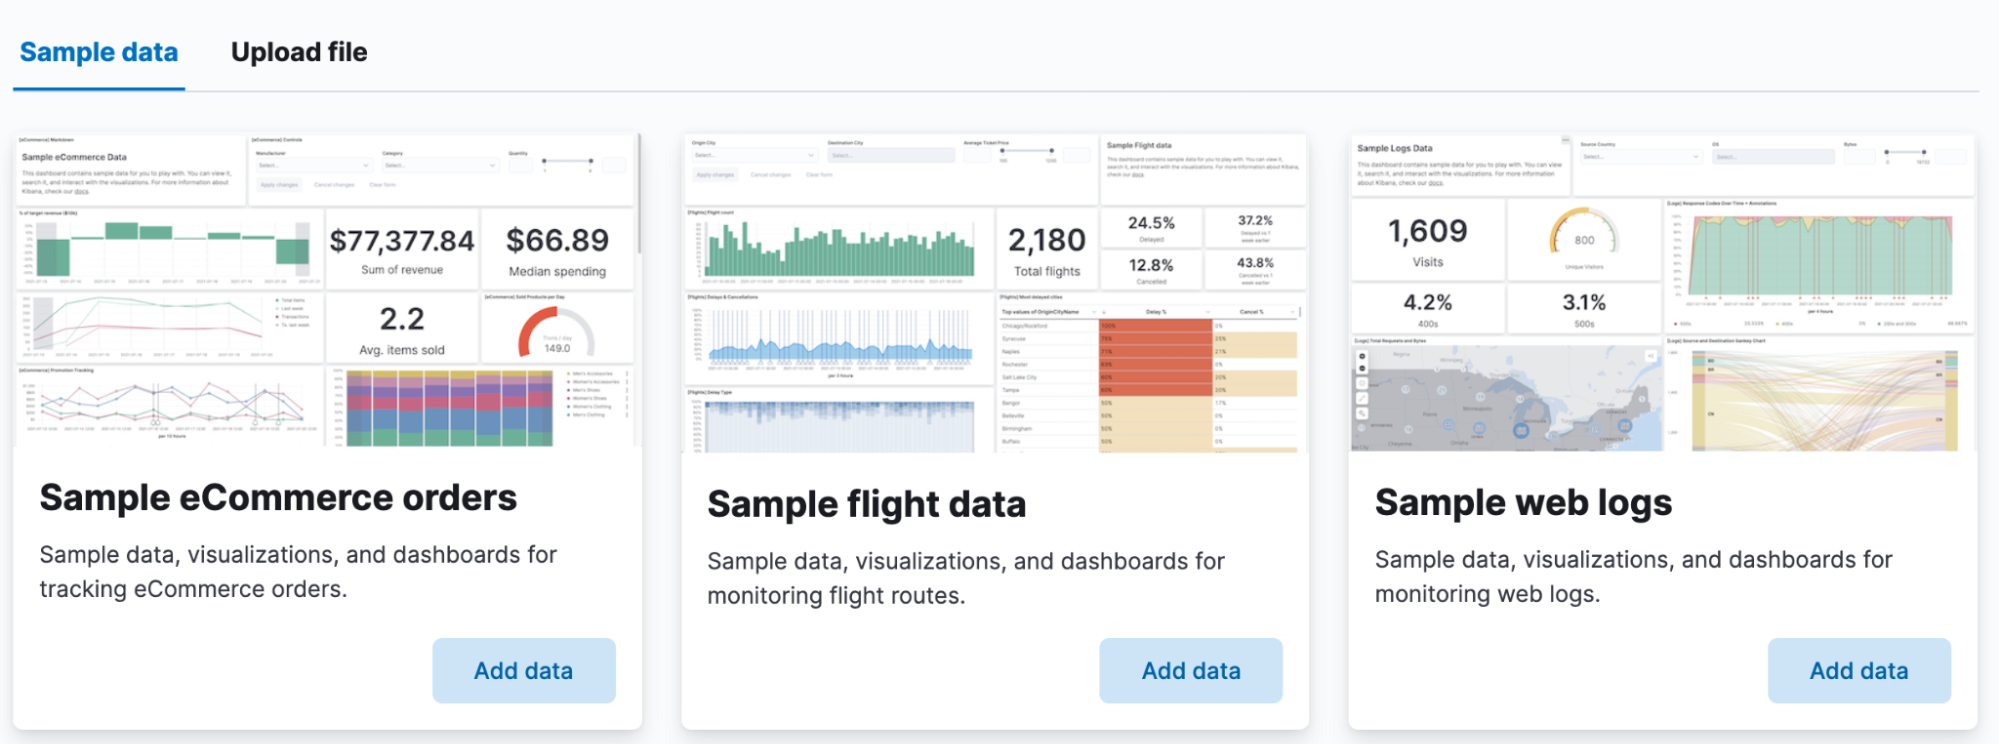
Add sample data
editSample data sets come with sample visualizations, dashboards, and more to help you explore Kibana before you add your own data. In the Integrations view, search for Sample Data, and then add the type of data you want.
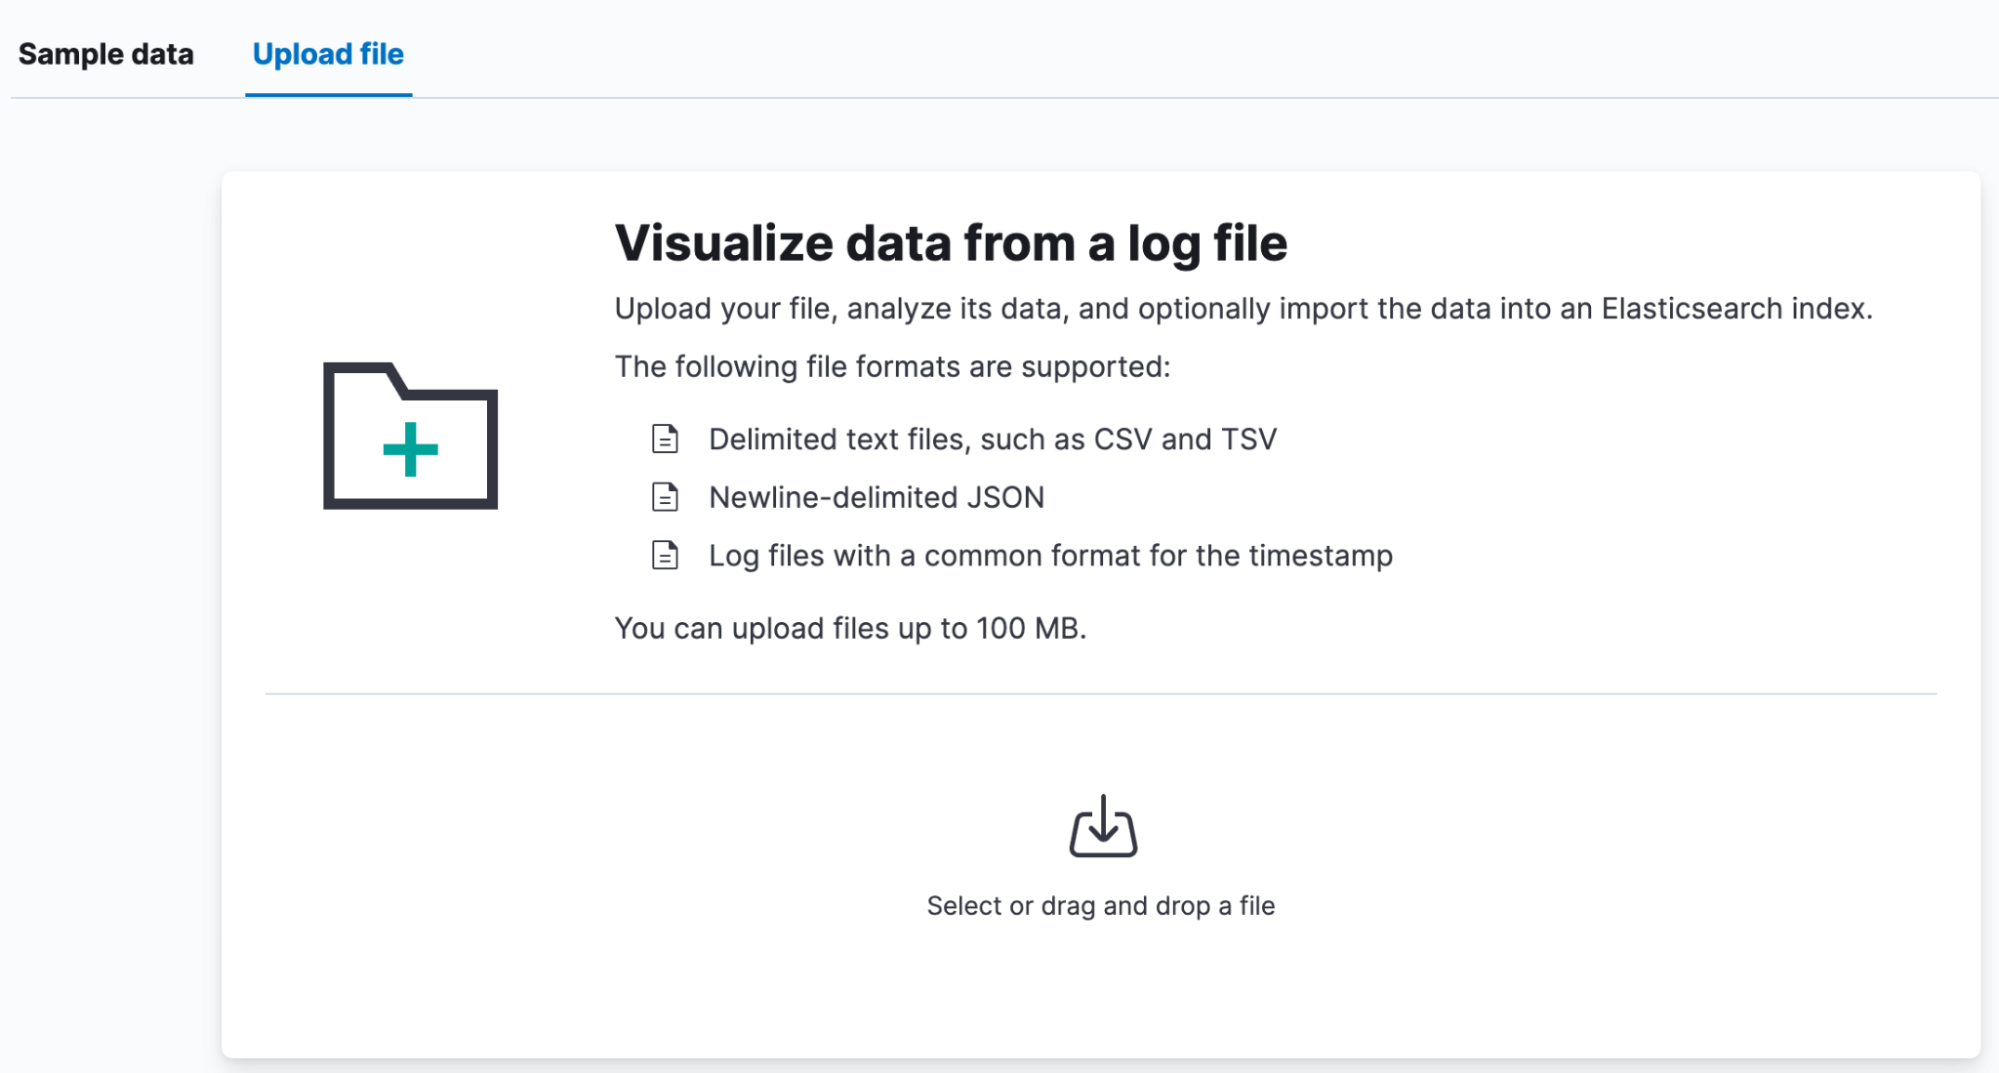
Upload a data file
editIf you have a log file or delimited CSV, TSV, or JSON file, you can upload it, view its fields and metrics, and optionally import it into Elasticsearch. In the Integrations view, search for Upload a file, and then drop your file on the target.
By default, you can upload a file up to 100 MB. This value is configurable up to 1 GB in Advanced Settings.
The upload feature is not intended for use as part of a repeated production process, but rather for the initial exploration of your data.
The Elastic Stack security features provide roles and privileges that control which users can upload files. To upload a file in Kibana and import it into an Elasticsearch index, you’ll need:
-
manage_pipelineormanage_ingest_pipelinescluster privilege -
create,create_index,manage, andreadindex privileges for the index -
allKibana privileges for Discover and Data Views Management
You can manage your roles, privileges, and spaces in Stack Management.
What’s next?
editTo take your investigation to a deeper level, use Discover and quickly gain insight to your data: search and filter your data, get information about the structure of the fields, and analyze your findings in a visualization.