Find transaction latency and failure correlations
editFind transaction latency and failure correlations
editCorrelations surface attributes of your data that are potentially correlated with high-latency or erroneous transactions. For example, if you are a site reliability engineer who is responsible for keeping production systems up and running, you want to understand what is causing slow transactions. Identifying attributes that are responsible for higher latency transactions can potentially point you toward the root cause. You may find a correlation with a particular piece of hardware, like a host or pod. Or, perhaps a set of users, based on IP address or region, is facing increased latency due to local data center issues.
To find correlations, select a service on the Services page in the APM app then select a transaction group from the Transactions tab.
Queries within the APM app are also applied to the correlations.
Find high transaction latency correlations
editThe correlations on the Latency correlations tab help you discover which attributes are contributing to increased transaction latency.
The progress bar indicates the status of the asynchronous analysis, which performs statistical searches across a large number of attributes. For large time ranges and services with high transaction throughput, this might take some time. To improve performance, reduce the time range.
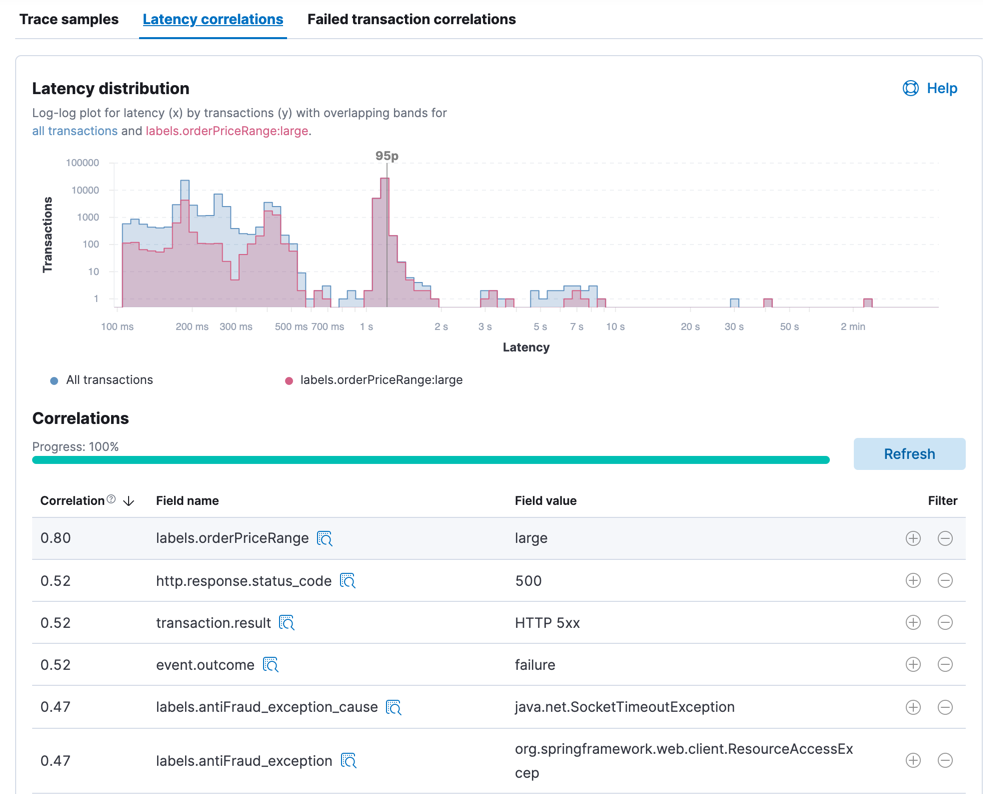
The latency distribution chart visualizes the overall latency of the transactions in the transaction group. If there are attributes that have a statistically significant correlation with slow response times, they are listed in a table below the chart. The table is sorted by correlation coefficients that range from 0 to 1. Attributes with higher correlation values are more likely to contribute to high latency transactions. By default, the attribute with the highest correlation value is added to the chart. To see the latency distribution for other attributes, select their row in the table.
If a correlated attribute seems noteworthy, use the Filter quick links:
-
+creates a new query in the APM app for filtering transactions containing the selected value. -
-creates a new query in the APM app to filter out transactions containing the selected value.
You can also click the icon beside the field name to view and filter its most popular values.
In this example screenshot, there are transactions that are skewed to the right
with slower response times than the overall latency distribution. If you select
the + filter in the appropriate row of the table, it creates a new query in
the APM app for transactions with this attribute. With the "noise" now
filtered out, you can begin viewing sample traces to continue your investigation.
Find failed transaction correlations
editThe correlations on the Failed transaction correlations tab help you discover
which attributes are most influential in distinguishing between transaction
failures and successes. In this context, the success or failure of a transaction
is determined by its event.outcome
value. For example, APM agents set the event.outcome to failure when an HTTP
transaction returns a 5xx status code.
The chart highlights the failed transactions in the overall latency distribution for the transaction group. If there are attributes that have a statistically significant correlation with failed transactions, they are listed in a table. The table is sorted by scores, which are mapped to high, medium, or low impact levels. Attributes with high impact levels are more likely to contribute to failed transactions. By default, the attribute with the highest score is added to the chart. To see a different attribute in the chart, select its row in the table.
For example, in the screenshot below, there are attributes such as a specific node and pod name that have medium impact on the failed transactions.
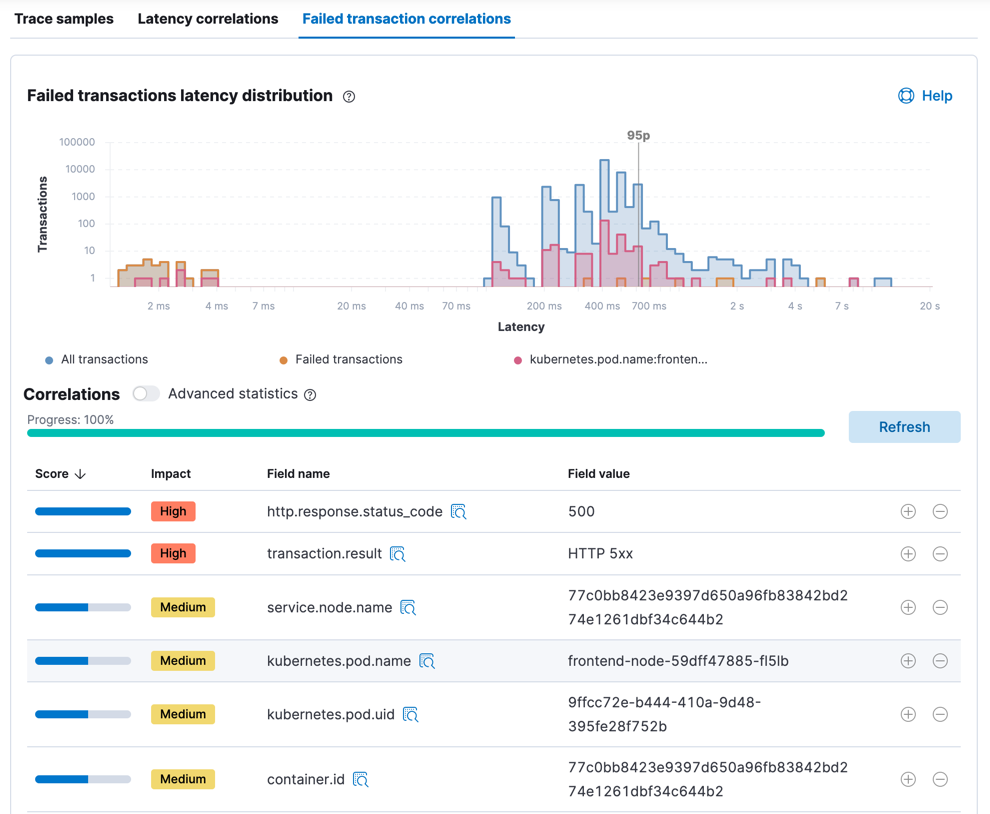
Select the + filter to create a new query in the APM app for transactions
with one or more of these attributes. If you are unfamiliar with a field, click
the icon beside its name to view its most popular values and optionally filter
on those values too. Each time that you add another attribute, it is filtering
out more and more noise and bringing you closer to a diagnosis.