Dashboard and visualizations troubleshooting
editDashboard and visualizations troubleshooting
editFind solutions to common dashboard and visualization issues.
Improve dashboard loading time
editTo improve the dashboard loading time, enable Defer loading panels below the fold Lab, which loads dashboard panels as they become visible on the dashboard.
-
In the toolbar, click Labs.
To enable Labs, contact your administrator, or configure the Advanced Settings.
-
To specify how you want to enable the lab, use the following actions:
- Kibana — Enables the lab in Kibana.
- Browser — Enables the lab for your browser, and persists after you close the browser.
- Session — Enables the lab for this browser session, then resets after you close the browser.
- Click Close.
Migrate Timelion app worksheets
editdeprecated::[The Timelion app is deprecated in 7.0.0, and will be removed in 7.16.0. To prepare for the removal of Timelion app, you must migrate Timelion app worksheets to a dashboard.
- Open the main menu, then click Dashboard.
- On the Dashboards page, click Create dashboard.
-
For each Timelion app worksheet, create a visualization with the Timelion editor.
- On the dashboard, click All types > Aggregation based, then select Timelion.
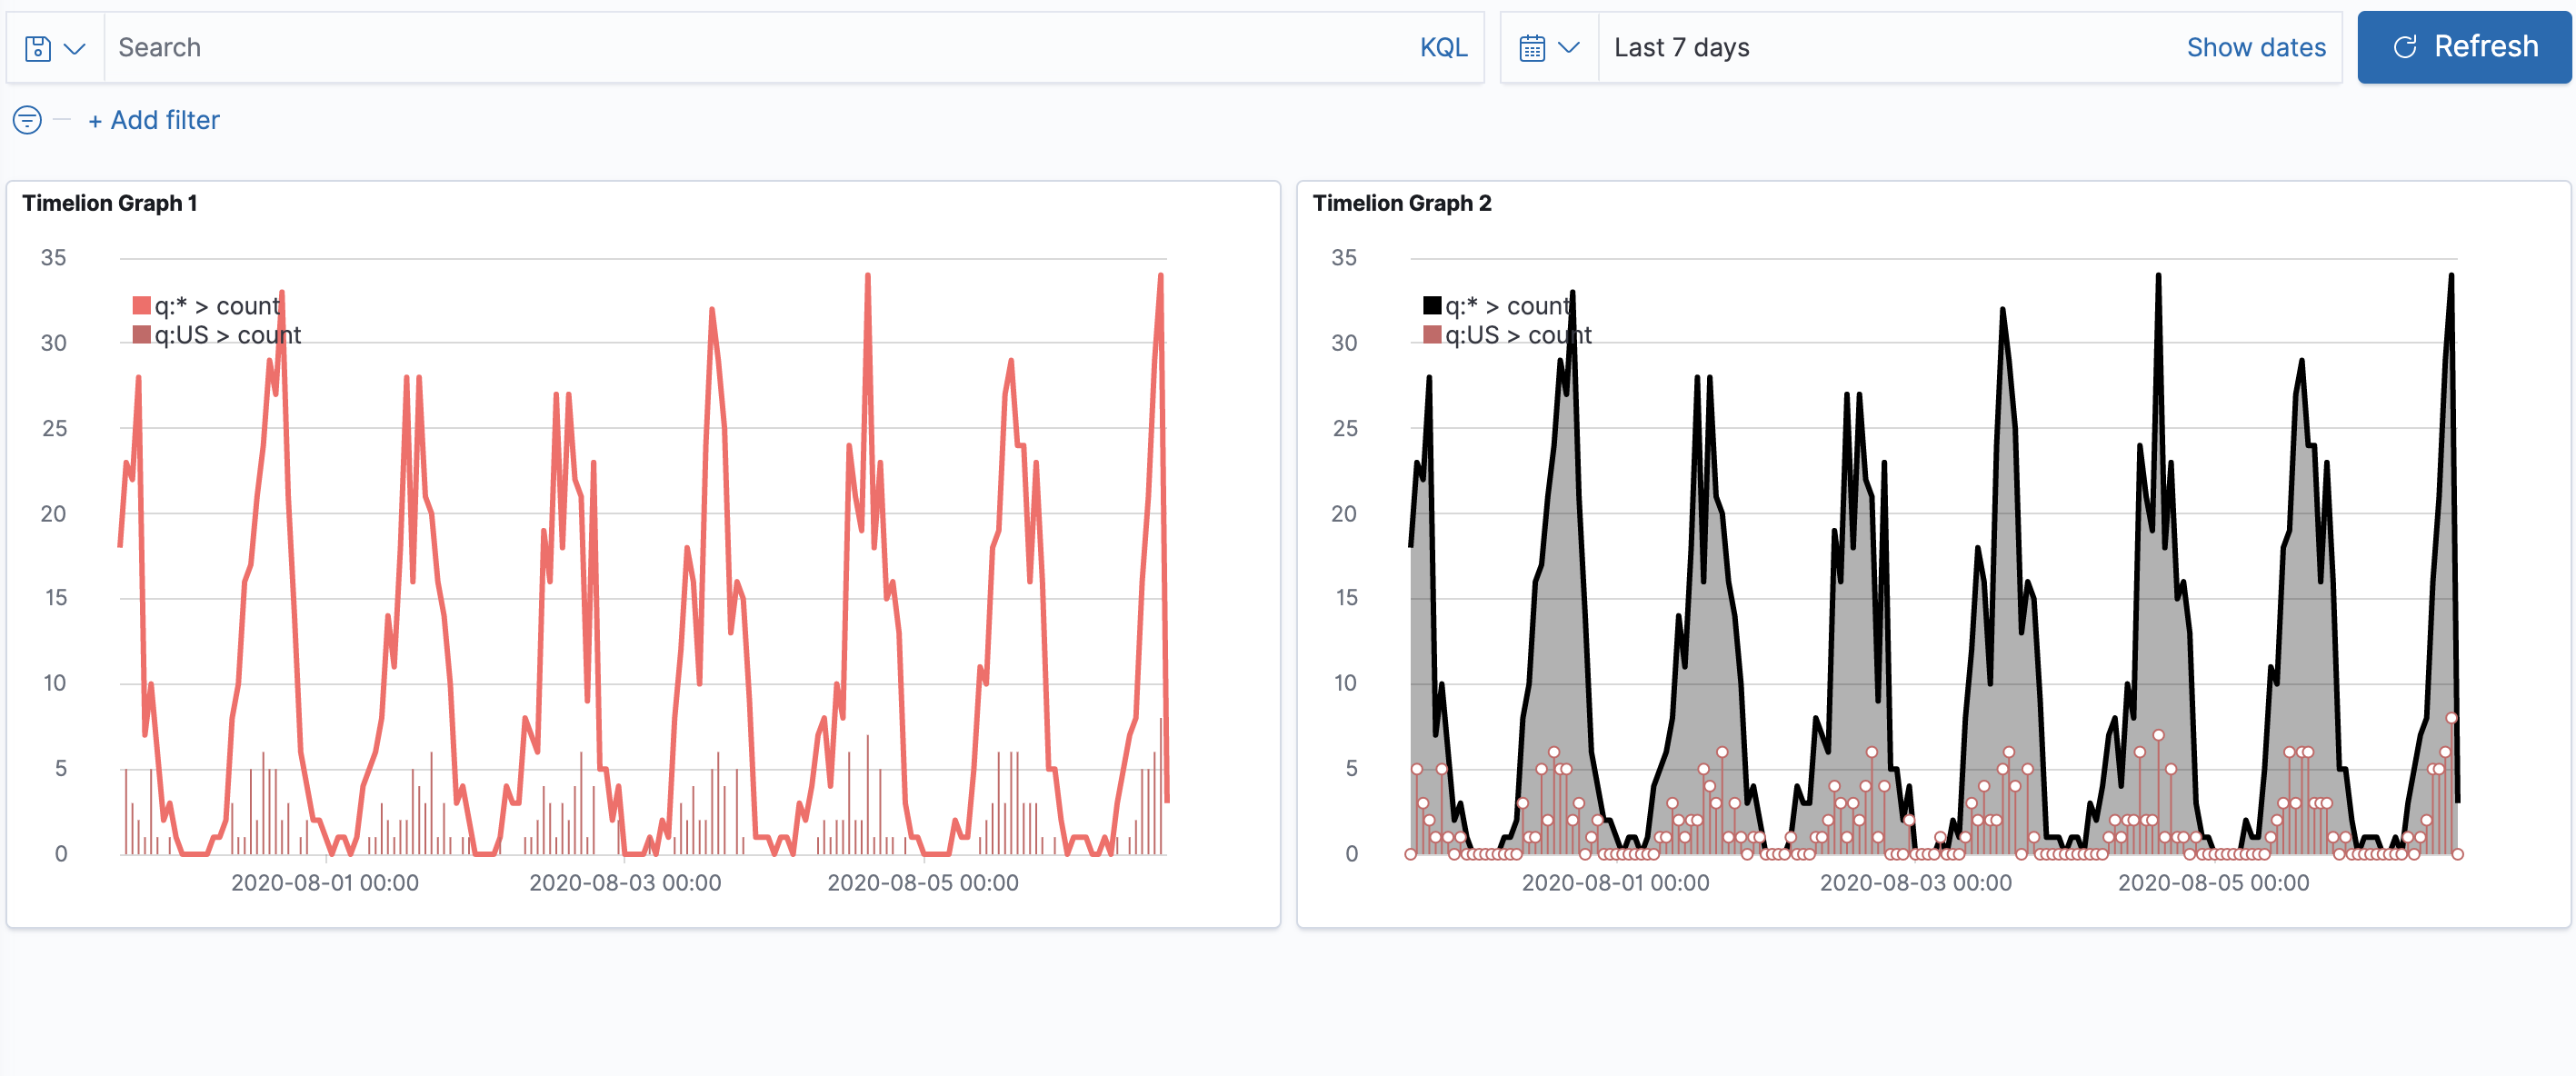
- In your browser, open a new tab, the open the Timelion app.
-
Select the chart you want to copy, then copy the chart expression.
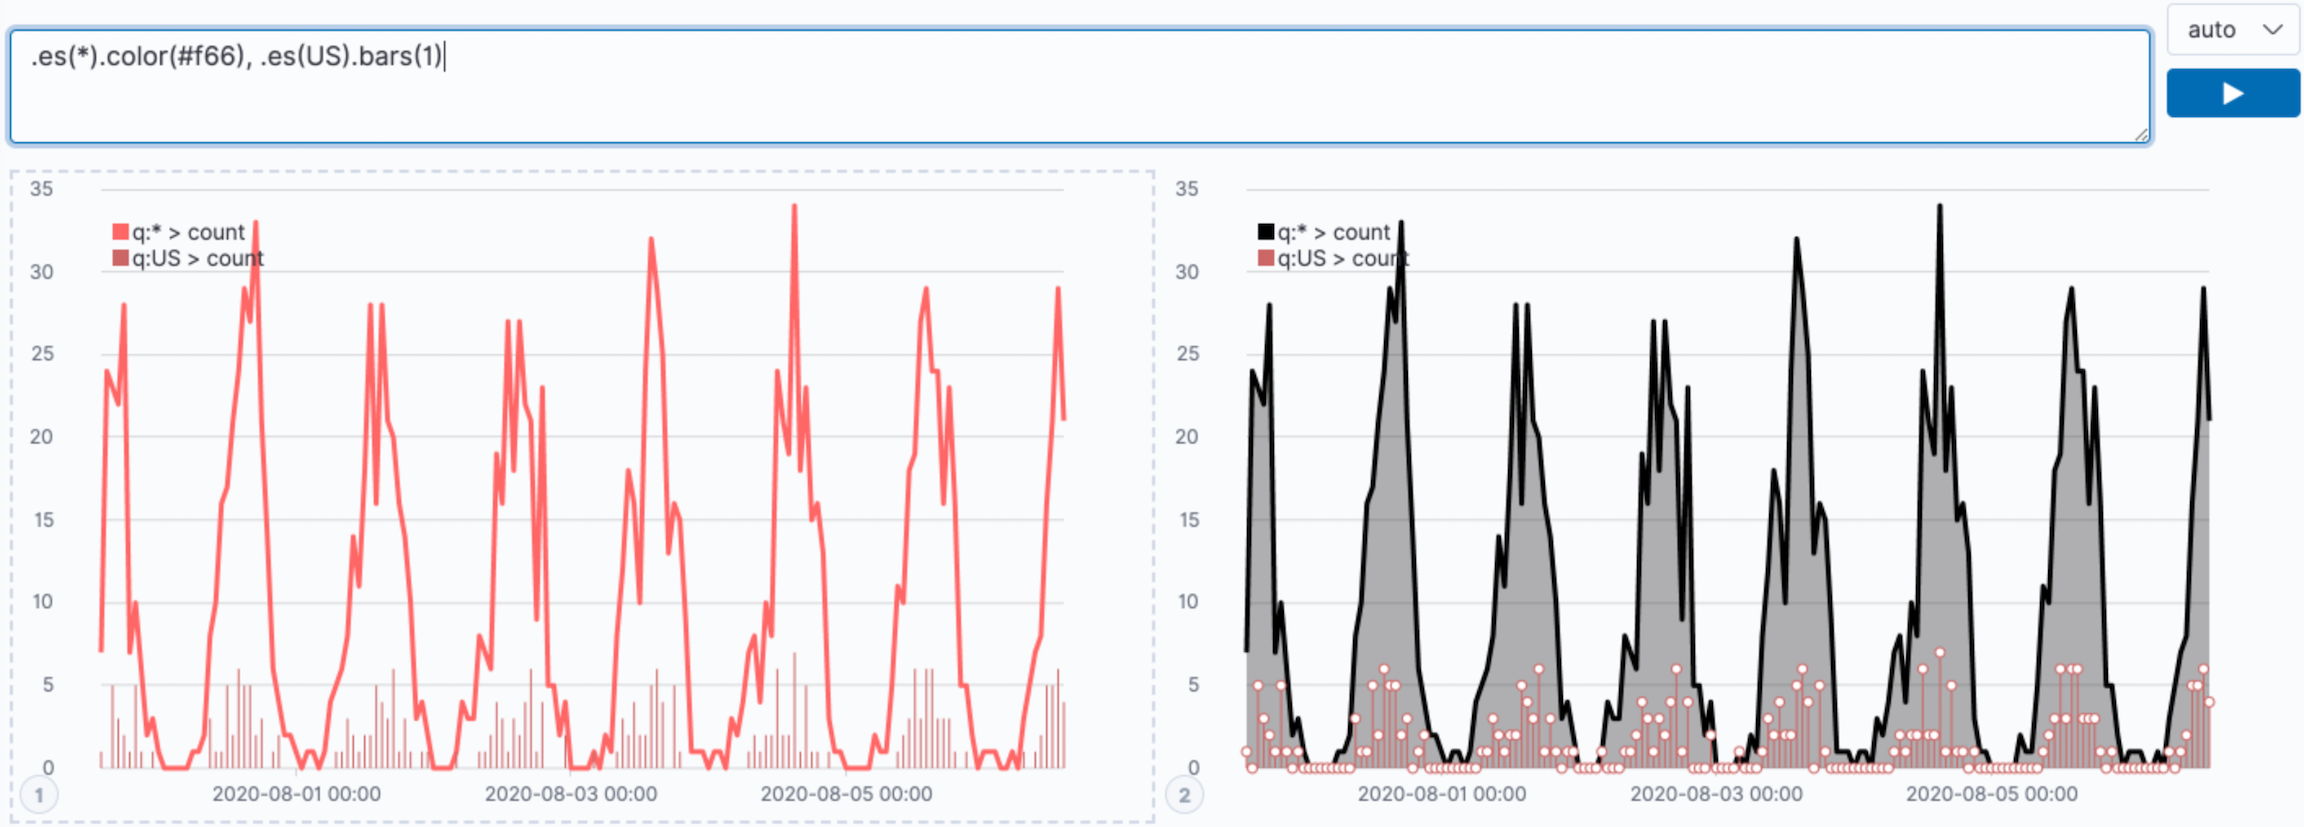
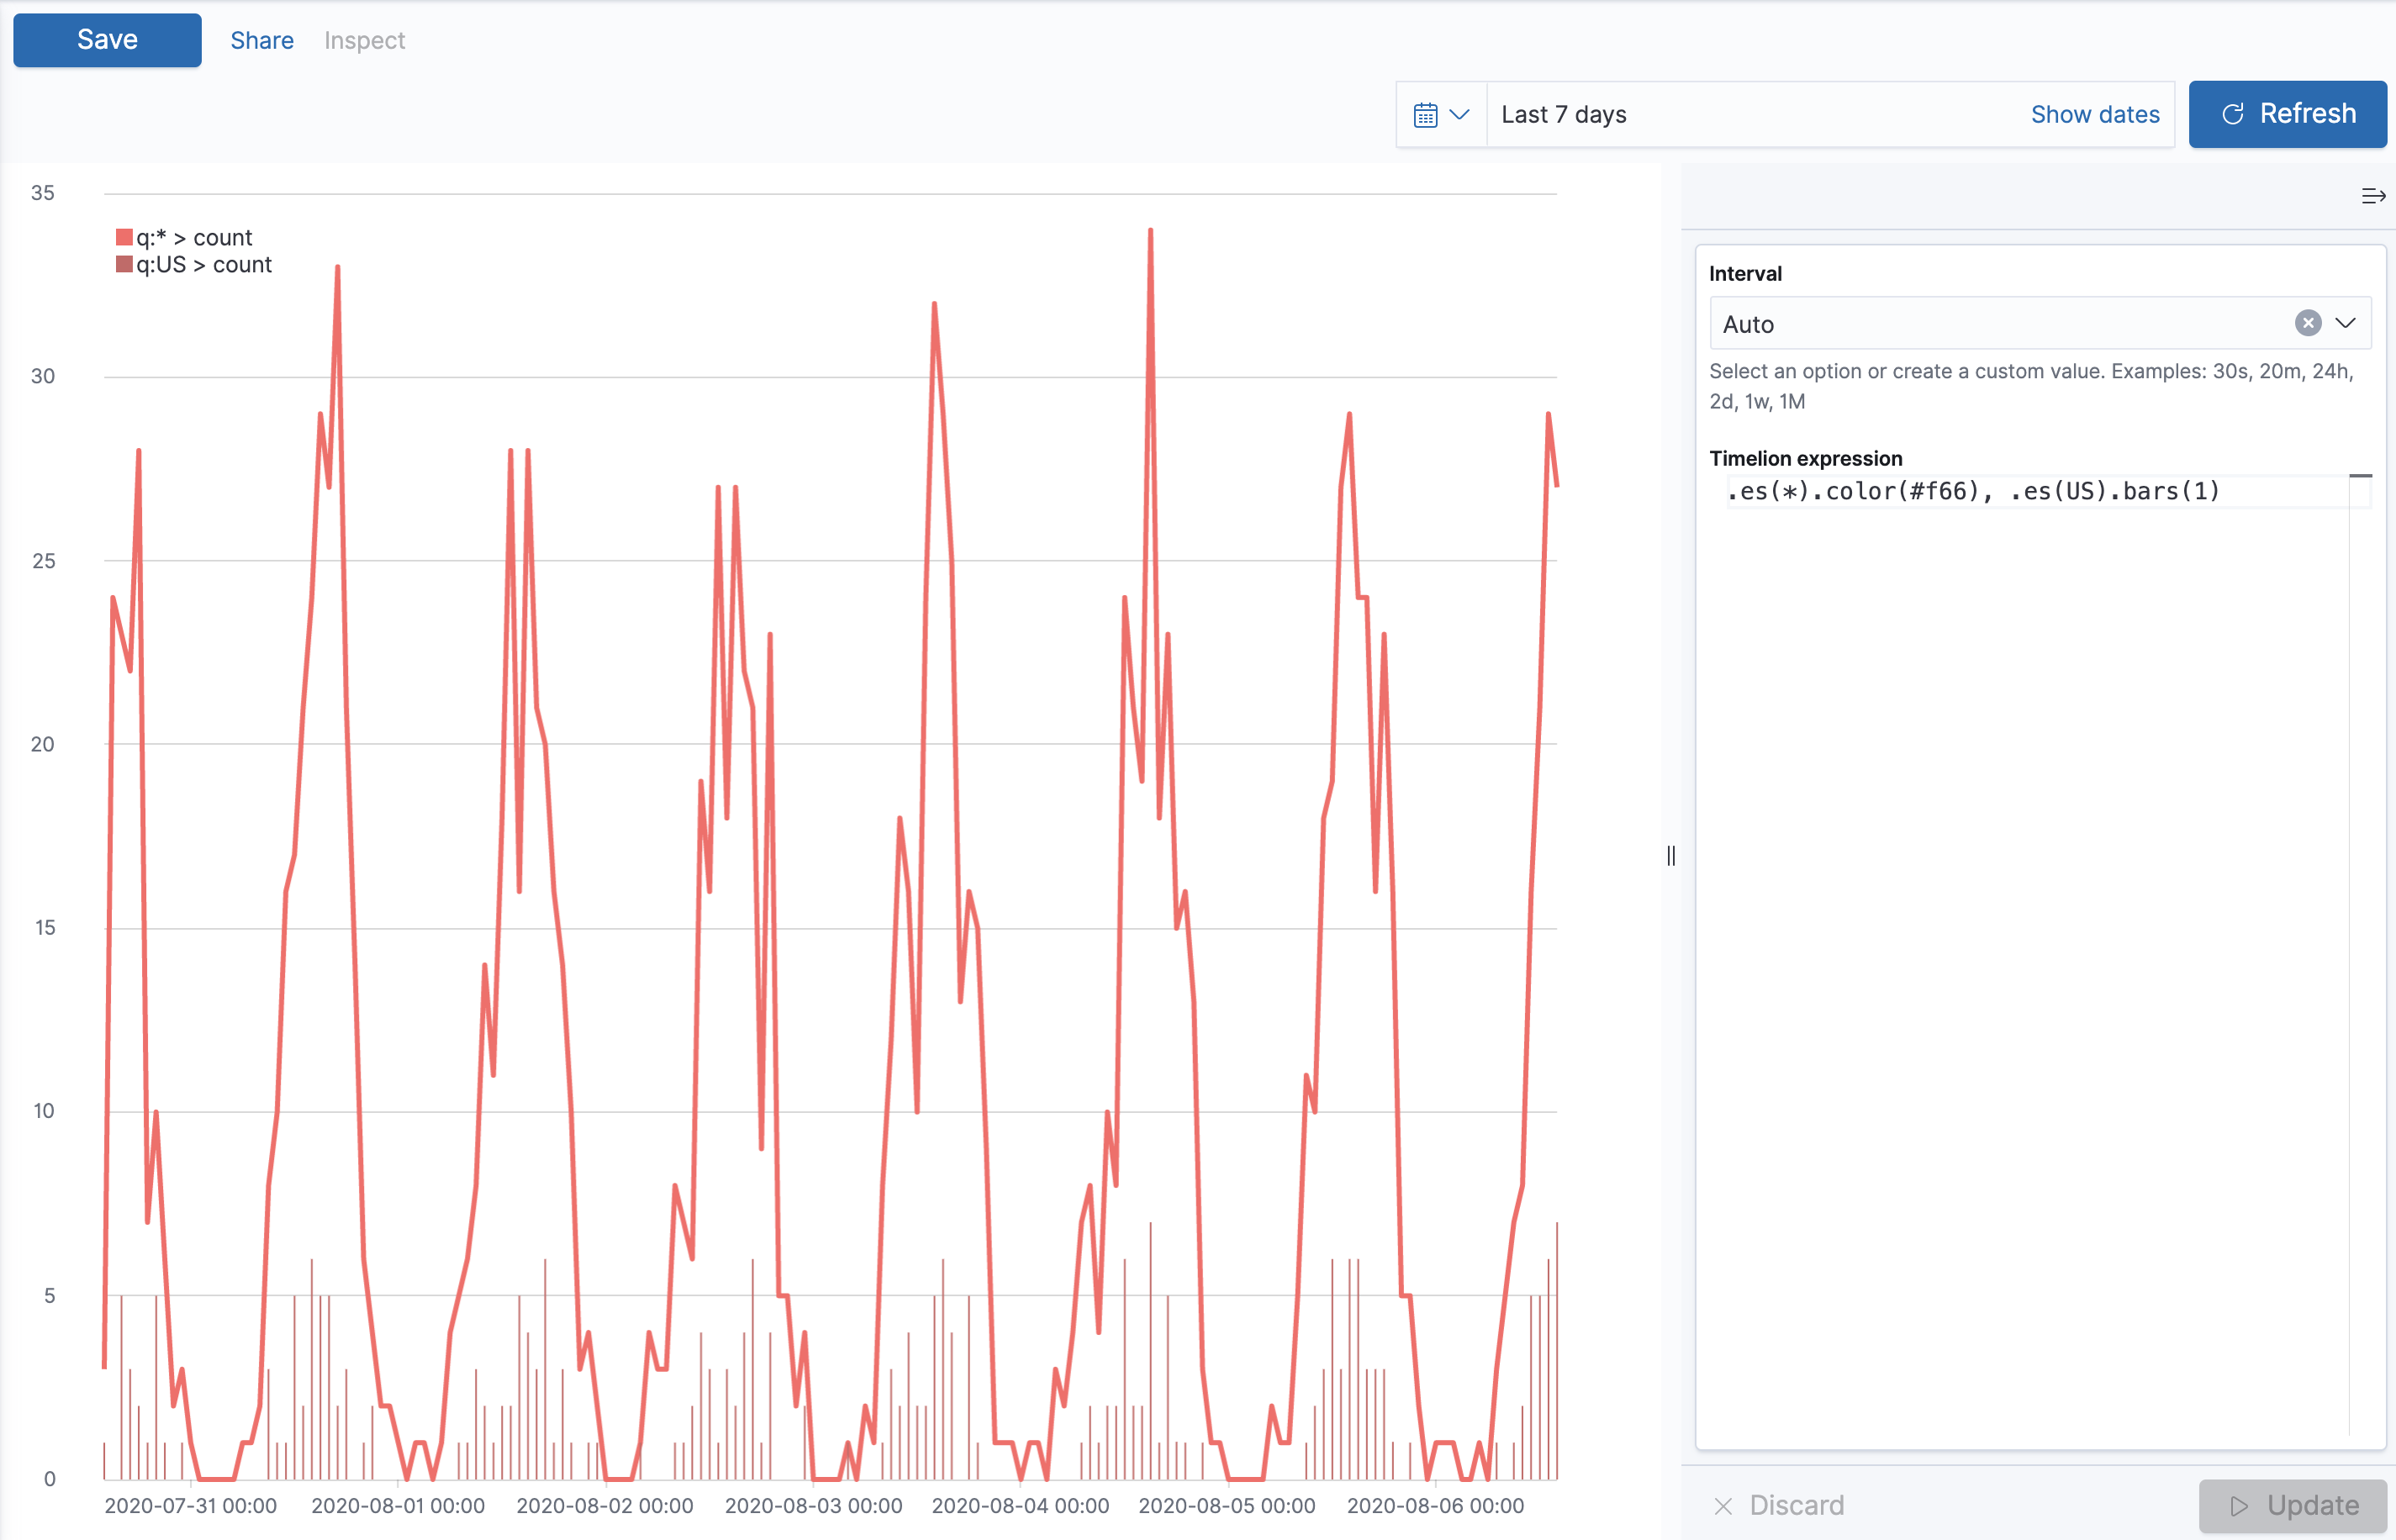
-
Go to the Timelion editor, paste the chart expression in the Timelion expression field, then click Update.
-
Save the visualization.
- In the toolbar, click Save to library.
- Enter the Title and add any applicable Tags.
- Make sure that Add to Dashboard after saving is selected.
-
Click Save and return.
The Timelion visualization panel appears on the dashboard.