Make dashboards interactive
editMake dashboards interactive
editAdd interactive capabilities to your dashboard, such as controls that allow you to apply dashboard-level filters, and drilldowns that allow you to navigate to Discover, other dashboards, and external websites.
Third-party developers can create drilldowns. To learn how to code drilldowns, refer to this example plugin.
[preview] This functionality is in technical preview and may be changed or removed in a future release. Elastic will work to fix any issues, but features in technical preview are not subject to the support SLA of official GA features. Add Controls panels
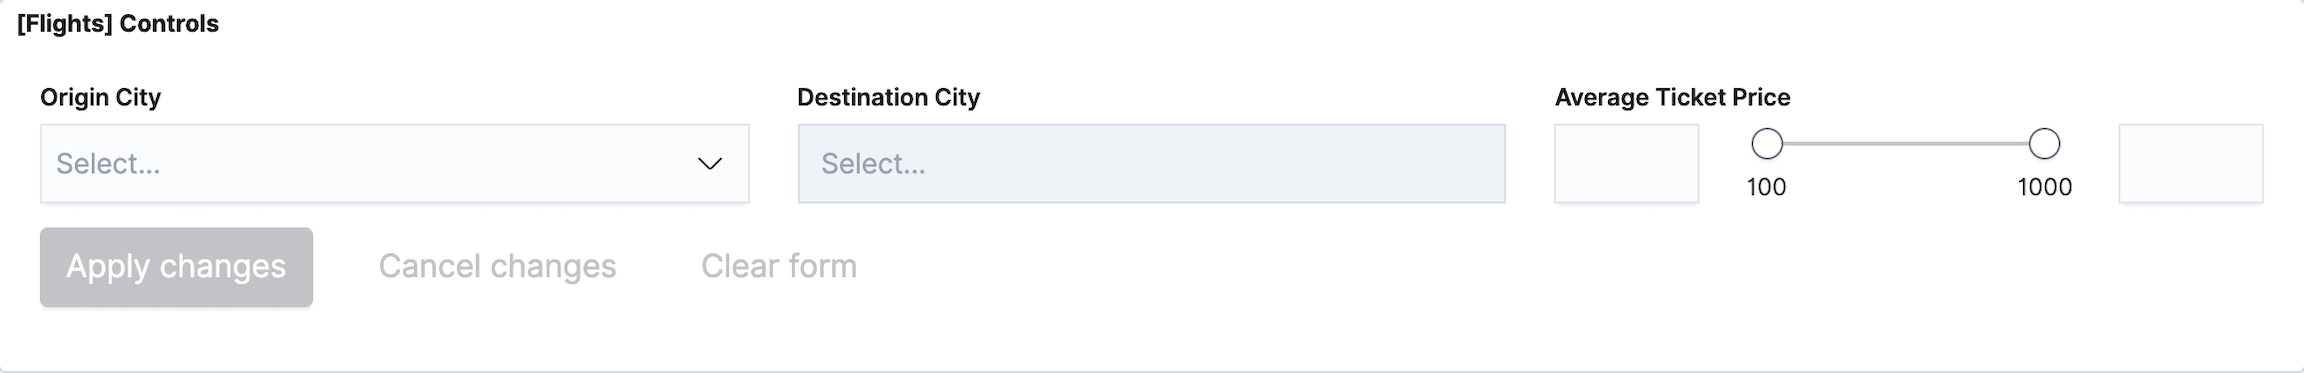
editControls panels allow you to apply dashboard-level filters based on values from a list, or a range of values.
There are two types of Controls you can add to dashboards:
- Options list — Filters content based on one or more specified options. The dropdown menu is dynamically populated with the results of a terms aggregation. For example, use the options list on the sample flight dashboard when you want to filter the data by origin city and destination city.
-
Range slider — Filters data within a specified range of numbers. The minimum and maximum values are dynamically populated with the results of a min and max aggregation. For example, use the range slider when you want to filter the sample flight dashboard by a specific average ticket price.
To create Controls panels:
- On the dashboard, click All types, then select Controls.
- Select the control panel type from the dropdown, then click Add.
- Enter the Control Label, then select the Data View and Field.
- If you are adding a Range slider, enter the Step Size and Decimal Places.
-
Click Options, then configure the following:
- Update Kibana filters on each change — When selected, all interactive inputs create filters that refresh the dashboard. When unselected, Kibana filters are created only when you click Apply changes.
- Use time filter — When selected, the aggregations that generate the options list and time range are connected to the time filter.
- Pin filters for all applications — When selected, all filters created by interacting with the inputs are automatically pinned.
- Click Update.
Save and add the panel
editSave the panel to the Visualize Library and add it to the dashboard, or add it to the dashboard without saving.
To save the panel to the Visualize Library:
- Click Save to library.
- Enter the Title and add any applicable Tags.
- Make sure that Add to Dashboard after saving is selected.
- Click Save and return.
To save the panel to the dashboard:
- Click Save and return.
-
Add an optional title to the panel.
- In the panel header, click No Title.
- On the Customize panel window, select Show panel title.
- Enter the Panel title, then click Save.
Open panel data in Discover
editYou can add interactions to panels that allow you to open and explore the data in Discover. To use the interactions, the panel must use only one {data-view}.
There are three types of Discover interactions you can add to dashboards:
-
Panel interactions — Opens panel data in Discover, including the dashboard-level filters, but not the panel-level filters.
To enable panel interactions, configure
xpack.discoverEnhanced.actions.in kibana.yml. If you are using 7.13.0 and earlier, panel interactions are enabled by default.To use panel interactions, open the panel menu, then click Explore underlying data.
-
Series data interactions — Opens the series data in Discover.
To enable series data interactions, configure
xpack.discoverEnhanced.actions.exploreDataInChart.enabledin kibana.yml. If you are using 7.13.0 and earlier, data series interactions are enabled by default.To use series data interactions, click a data series in the panel.
-
Saved search interactions — Opens saved search data in Discover.
To use saved search interactions, open the panel menu, then click More > View saved search.
Create drilldowns
editPanels have built-in interactive capabilities that apply filters to the dashboard data. For example, when you drag a time range or click a pie slice, a filter for the time range or pie slice is applied. Drilldowns let you customize the interactive behavior while keeping the context of the interaction.
There are two types of drilldowns you can add to dashboards:
- Dashboard — Navigates you from one dashboard to another dashboard. For example, when can create a drilldown for a Lens panel that navigates you from a summary dashboard to a dashboard with a filter for a specific host name.
- URL — Navigates you from a dashboard to an external website. For example, a website with the specific host name as a parameter.
Create dashboard drilldowns
editDashboard drilldowns enable you to open a dashboard from another dashboard, taking the time range, filters, and other parameters with you so the context remains the same. Dashboard drilldowns help you to continue your analysis from a new perspective.
For example, if you have a dashboard that shows the logs and metrics for multiple data centers, you can create a drilldown that navigates from the dashboard that shows multiple data centers, to a dashboard that shows a single data center or server.
The panels you create using the following editors support dashboard drilldowns:
- Lens
- Maps
- TSVB
- Vega
- Aggregation-based area chart, data table, heat map, horitizontal bar chart, line chart, pie chart, tag cloud, and vertical bar chart
- Timelion
Create and set up the dashboards you want to connect
editUse the Sample web logs data to create a dashboard and add panels, then set a search and filter on the [Logs] Web Traffic dashboard.
- Add the Sample web logs data.
-
Create a new dashboard, click Add from Library, then add the following panels:
- [Logs] Response Codes Over Time + Annotations
- [Logs] Visits
- Set the time filter to Last 30 days.
-
Save the dashboard. In the Title field, enter
Detailed logs. -
Open the [Logs] Web Traffic dashboard, then set a search and filter.
Search:
extension.keyword: ("gz" or "css" or "deb")
Filter:geo.src: CN
Create the dashboard drilldown
editCreate a drilldown that opens the Detailed logs dashboard from the [Logs] Web Traffic dashboard.
- Open the panel menu for the [Logs] Errors by host data table, then select Create drilldown.
-
Click Go to dashboard.
-
Give the drilldown a name. For example,
View details. - From the Choose a destination dashboard dropdown, select Detailed logs.
- To use the geo.src filter, KQL query, and time filter, select Use filters and query from origin dashboard and Use date range from origin dashboard.
- Click Create drilldown.
-
Give the drilldown a name. For example,
- Save the dashboard.
-
In the data table panel, hover over a value, click +, then select
View details.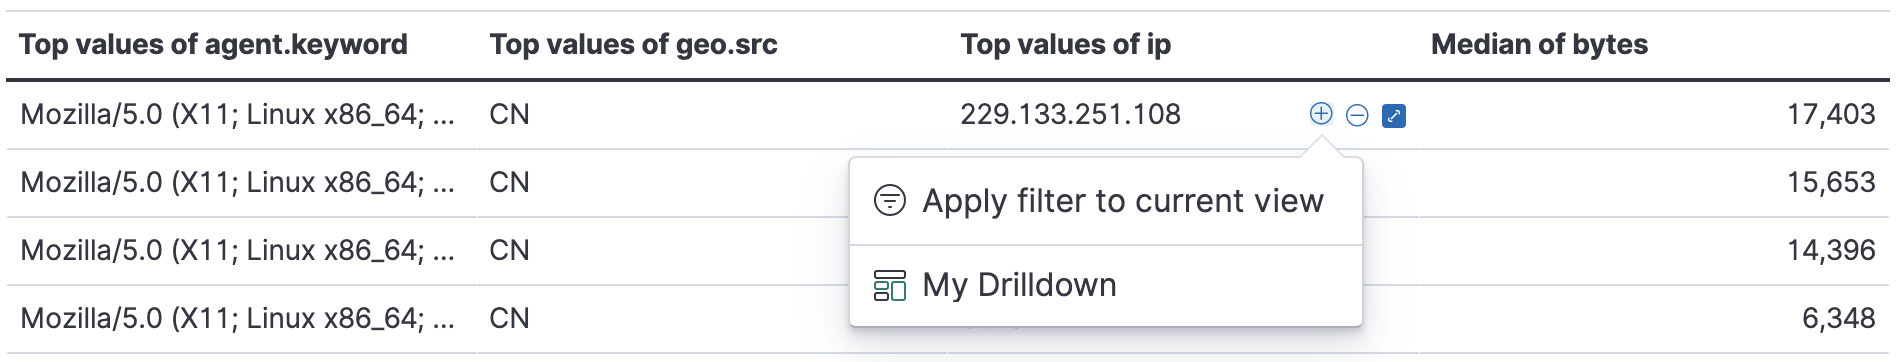
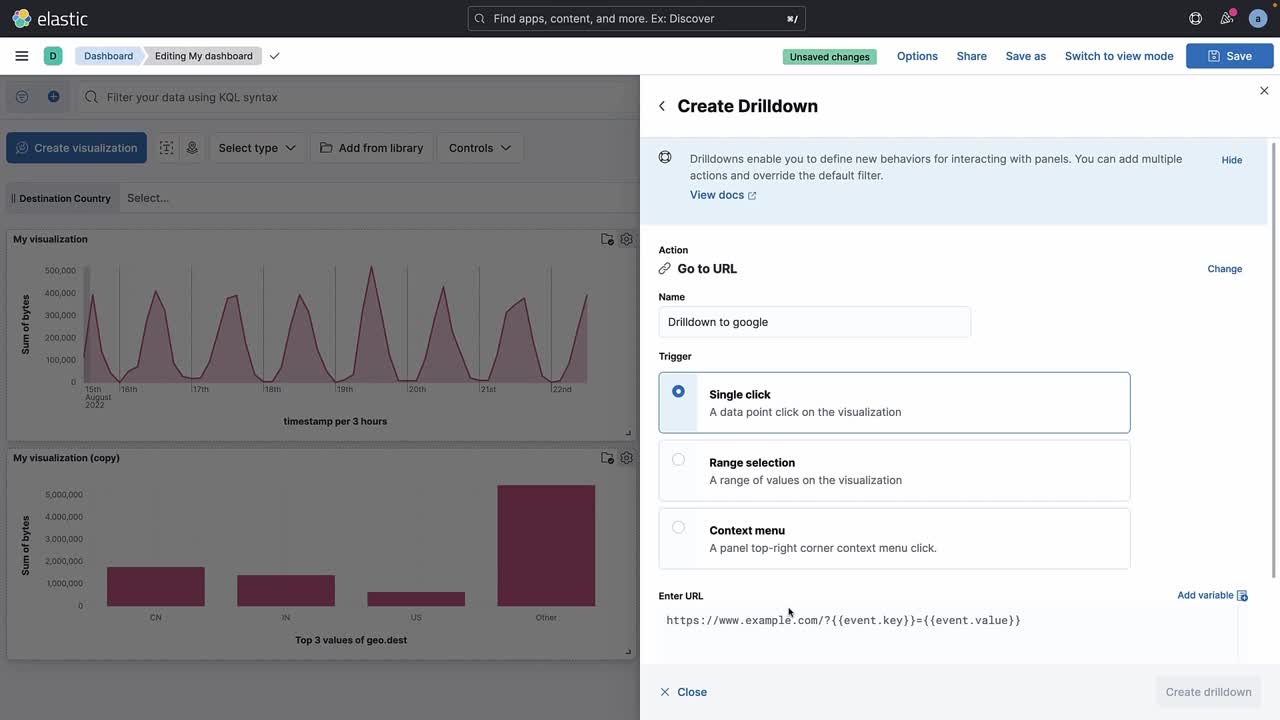
Create URL drilldowns
editURL drilldowns enable you to navigate from a dashboard to external websites. Destination URLs can be dynamic, depending on the dashboard context or user interaction with a panel. To create URL drilldowns, you add variables to a URL template, which configures the behavior of the drilldown.
Some panels support multiple interactions, also known as triggers. The variables you use to create a URL template depends on the trigger you choose. URL drilldowns support these types of triggers:
- Single click — A single data point in the panel.
- Range selection — A range of values in a panel.
For example, Single click has {{event.value}} and Range selection has {{event.from}} and {{event.to}}.
The panels you create using the following editors support dashboard drilldowns:
- Lens
- Maps
- TSVB
- Aggregation-based area chart, data table, heat map, horitizontal bar chart, line chart, pie chart, tag cloud, and vertical bar chart
Create a URL drilldown
editFor example, if you have a dashboard that shows data from a Github repository, you can create a URL drilldown that opens Github from the dashboard panel.
- Add the Sample web logs data.
- Open the [Logs] Web Traffic dashboard.
- In the toolbar, click Edit.
-
Create a donut chart
- In the toolbar, click Edit.
- Click Create visualization.
- From the Chart type dropdown, select Donut.
- From the Available fields list, drag and drop the machine.os.keyword field onto the visualization builder.
- Click Save and return.
- Open the donut chart panel menu, then select Create drilldown.
-
Click Go to URL.
-
Give the drilldown a name. For example,
Show on Github. - For the Trigger, select Single click.
-
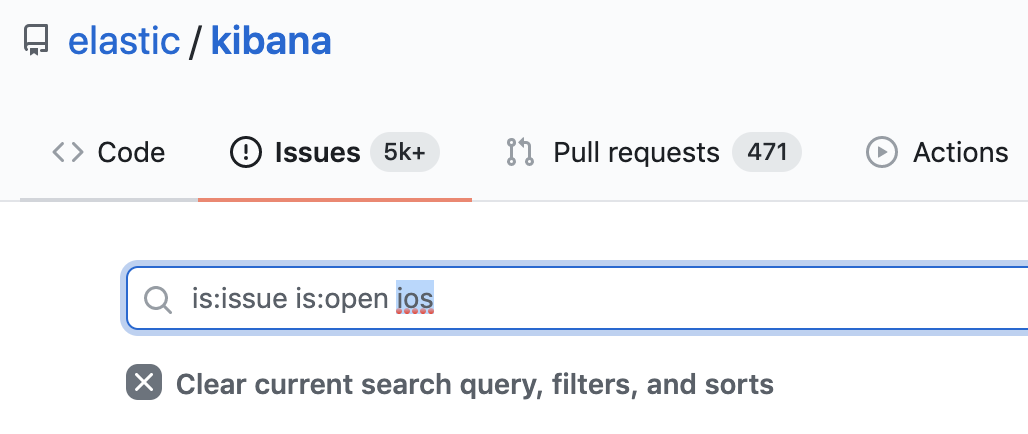
To navigate to the Kibana repository Github issues, enter the following in the Enter URL field:
https://github.com/elastic/kibana/issues?q=is:issue+is:open+{{event.value}}Kibana substitutes
{{event.value}}with a value associated with the selected pie slice. - Click Create drilldown.
-
Give the drilldown a name. For example,
- Save the dashboard.
-
On the donut chart panel, click any chart slice, then select Show on Github.
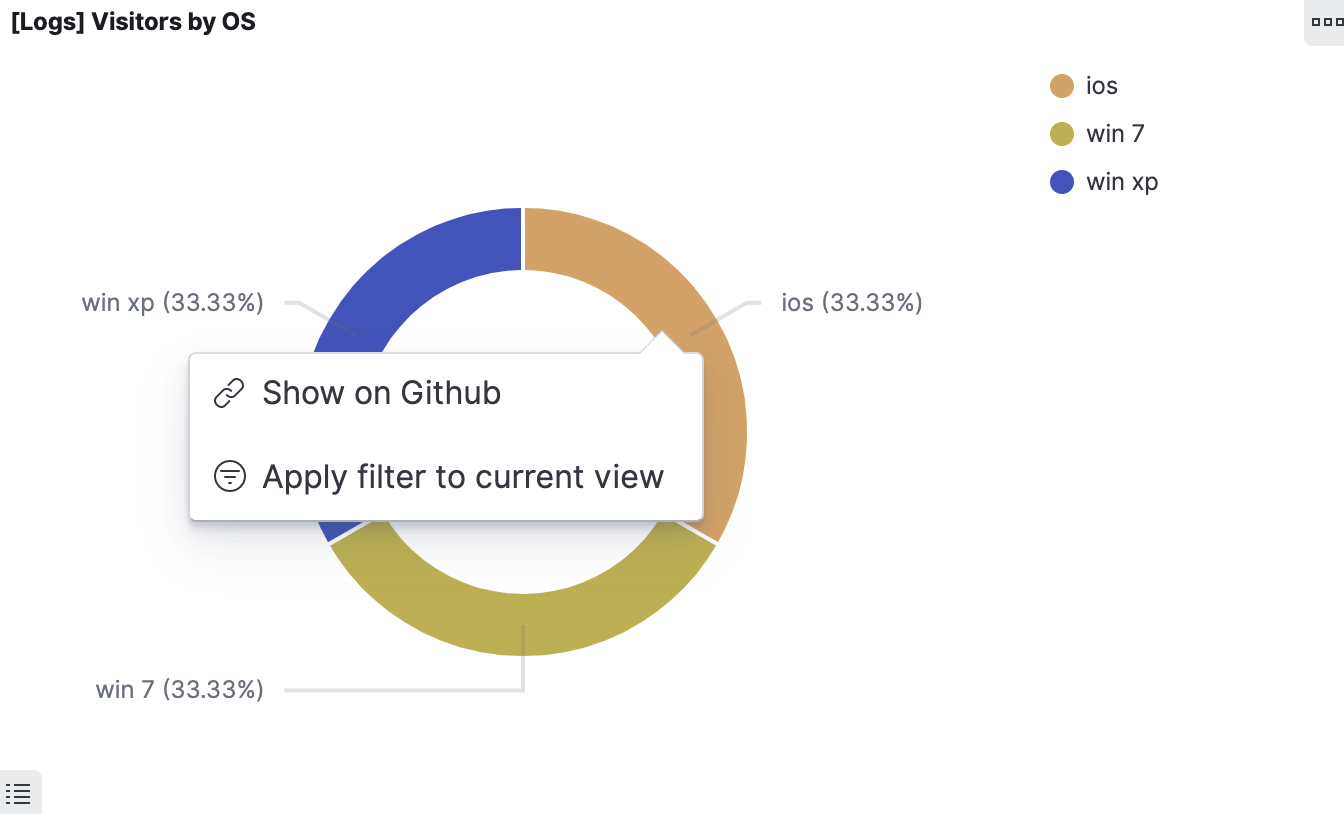
-
In the list of Kibana repository issues, verify that the slice value appears.
Manage drilldowns
editMake changes to your drilldowns, make a copy of your drilldowns for another panel, and delete drilldowns.
- Open the panel menu that includes the drilldown, then click Manage drilldowns.
-
On the Manage tab, use the following options:
- To change drilldowns, click Edit next to the drilldown you want to change, make your changes, then click Save.
- To make a copy, click Copy next to the drilldown you want to change, enter the drilldown name, then click Create drilldown.
- To delete a drilldown, select the drilldown you want to delete, then click Delete.