Access Kibana
editAccess Kibana
editThe fastest way to access Kibana is to use our hosted Elasticsearch Service. If you installed Kibana on your own, access Kibana through the web application.
Set up on cloud
editThere’s no faster way to get started than with Elastic Cloud:
- Sign up for a free trial.
- Follow the on-screen steps to create your first project.
That’s it! You’re ready to get some data into your project.
Log on to the web application
editIf you are using a self-managed deployment, access Kibana through the web application on port 5601.
-
Point your web browser to the machine where you are running Kibana and specify the port number. For example,
localhost:5601orhttp://YOURDOMAIN.com:5601.To remotely connect to Kibana, set server.host to a non-loopback address.
- Log on to your account.
- Go to the home page, then click Kibana.
- To make the Kibana page your landing page, click Make this my landing page.
Check the Kibana status
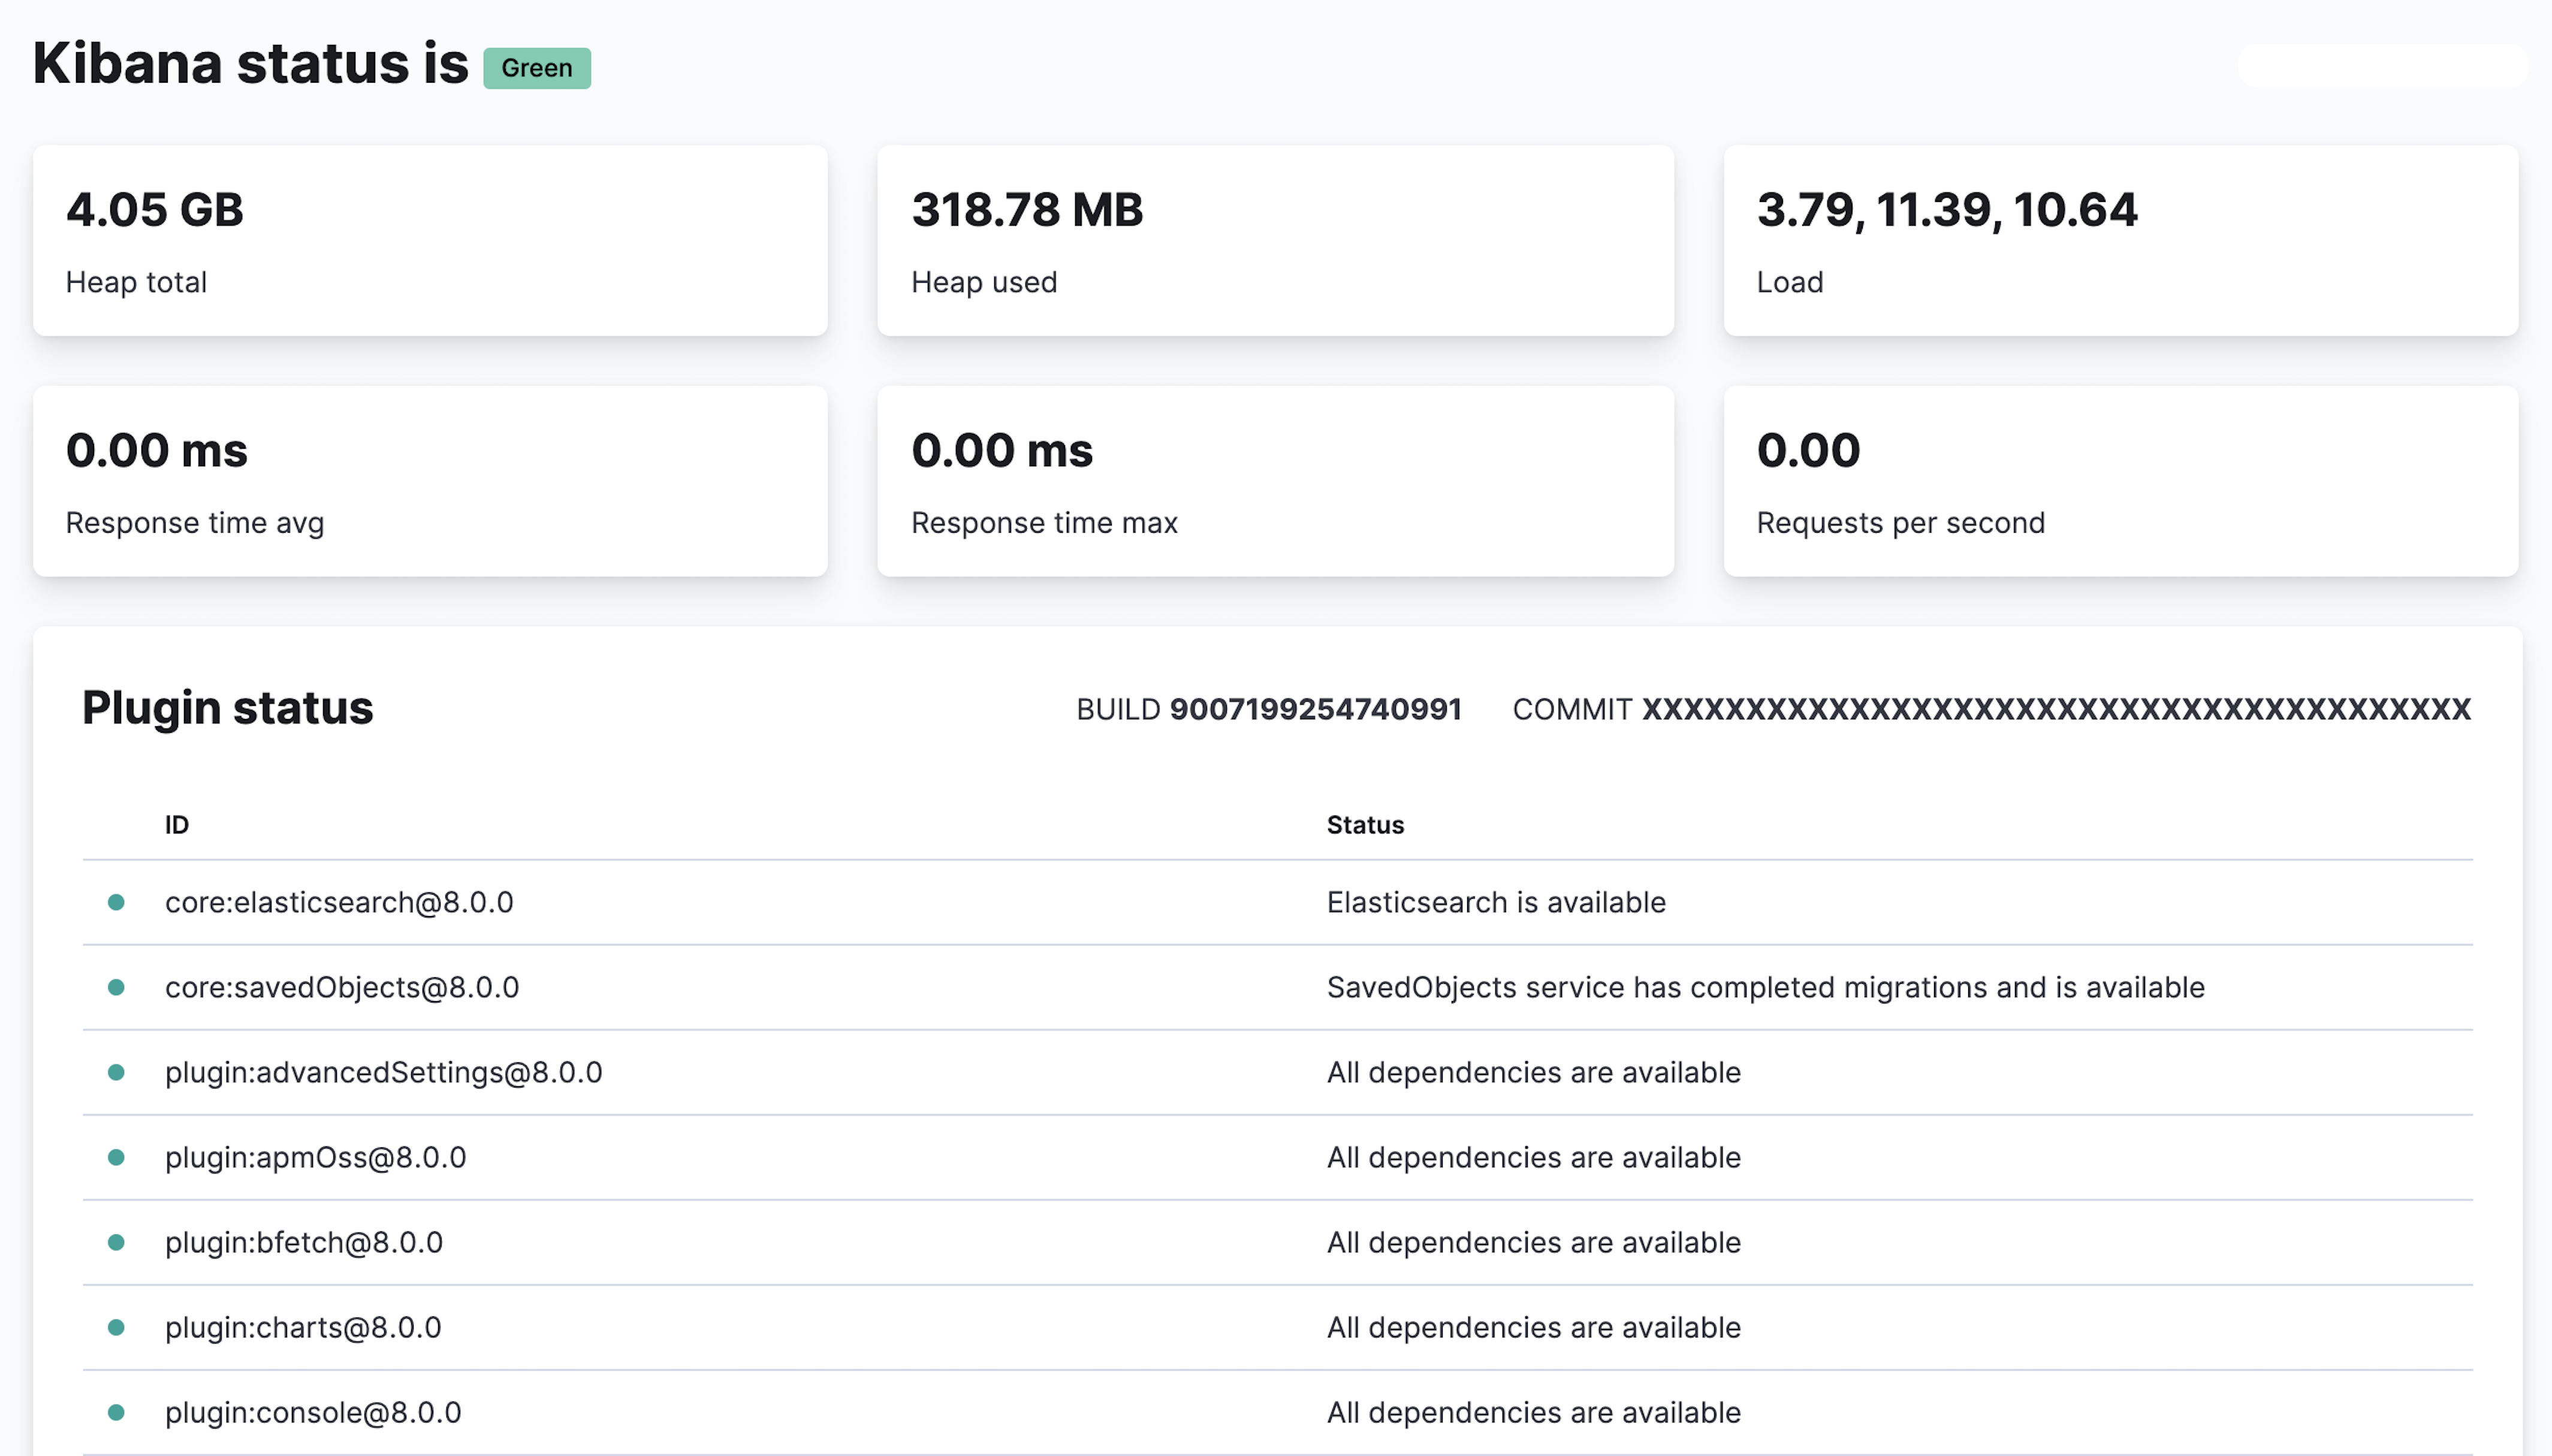
editThe status page displays information about the server resource usage and installed plugins.
To view the Kibana status page, use the status endpoint. For example, localhost:5601/status.

For JSON-formatted server status details, use the localhost:5601/api/status API endpoint.
Kibana not ready
editIf you receive an error that the Kibana server is not ready, check the following:
-
The Elasticsearch connectivity:
`curl -XGET elasticsearch_ip_or_hostname:9200/`
-
The Kibana logs:
-
Linux, DEB or RPM package:
/var/log/kibana/kibana.log -
Linux, tar.gz package:
$KIBANA_HOME/log/kibana.log -
Windows:
$KIBANA_HOME\log\kibana.log
-
Linux, DEB or RPM package:
-
The health status of
.kibana*indices