Add the visualizations to a dashboard
editAdd the visualizations to a dashboard
editBuild a dashboard that contains the visualizations and map that you saved during this tutorial.
- Open the menu, go to Dashboard, then click Create dashboard.
- Set the time filter to May 18, 2015 to May 20, 2015.
-
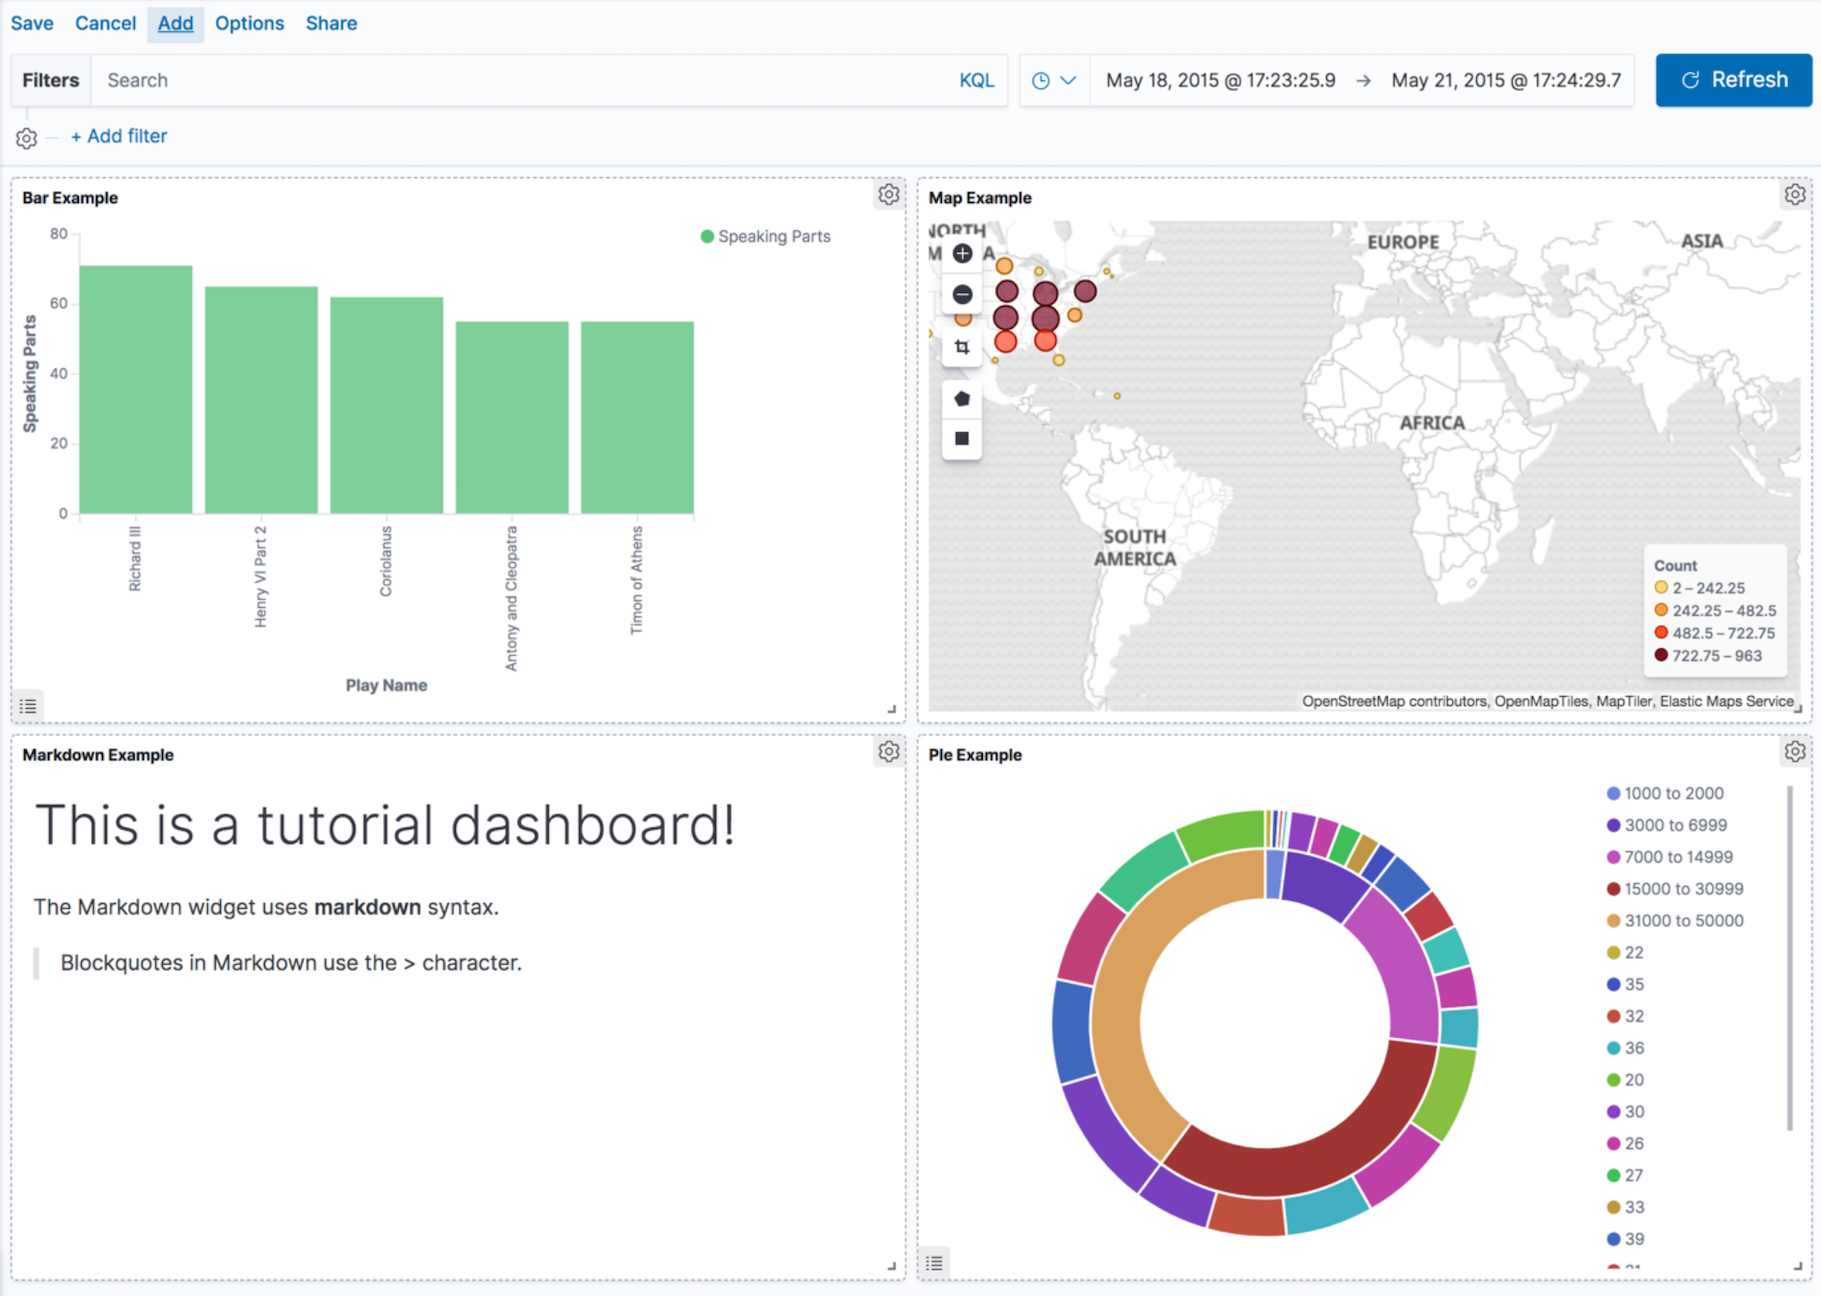
Click Add, then select the following:
- Bar Example
- Map Example
- Markdown Example
-
Pie Example
Your sample dashboard looks like this:
-
Try out the editing controls.
You can rearrange the visualizations by clicking a the header of a visualization and dragging. The gear icon in the top right of a visualization displays controls for editing and deleting the visualization. A resize control is on the lower right.
- Save your dashboard.
Inspect the data
editSeeing visualizations of your data is great, but sometimes you need to look at the actual data to understand what’s really going on. You can inspect the data behind any visualization and view the Elasticsearch query used to retrieve it.
-
Click the pie chart Options menu, then select Inspect.
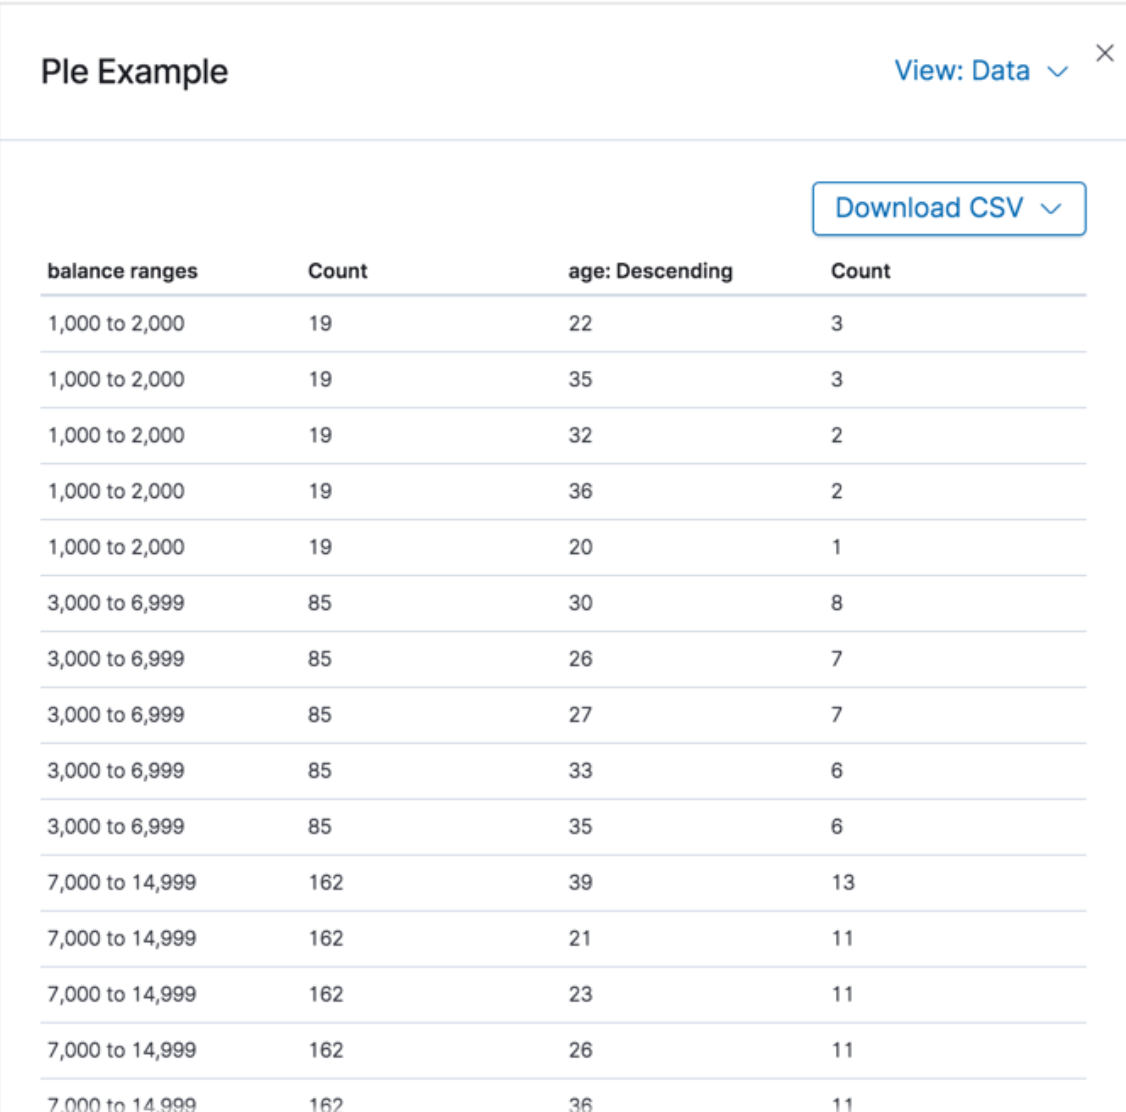
- To look at the query used to fetch the data for the visualization, select View > Requests.
Next steps
editNow that you have the basics, you’re ready to start exploring your own data with Kibana.
- To learn about searching and filtering your data, refer to Discover.
- To learn about the visualization types Kibana has to offer, refer to Visualize.
- To learn about configuring Kibana and managing your saved objects, refer to Management.
- To learn about the interactive console you can use to submit REST requests to Elasticsearch, refer to Console.