Kibana — your window into the Elastic Stack
editKibana — your window into the Elastic Stack
editVisualize and analyze your data and manage all things Elastic Stack.
Whether you’re an analyst or an admin, Kibana makes your data actionable by providing three key functions. Kibana is:
- An open-source analytics and visualization platform. Use Kibana to explore your Elasticsearch data, and then build beautiful visualizations and dashboards.
- A UI for managing the Elastic Stack. Manage your security settings, assign user roles, take snapshots, roll up your data, and more — all from the convenience of a Kibana UI.
- A centralized hub for Elastic’s solutions. From log analytics to document discovery to SIEM, Kibana is the portal for accessing these and other capabilities.
Add data
editKibana is designed to use Elasticsearch as a data source. Think of Elasticsearch as the engine that stores and processes the data, with Kibana sitting on top.
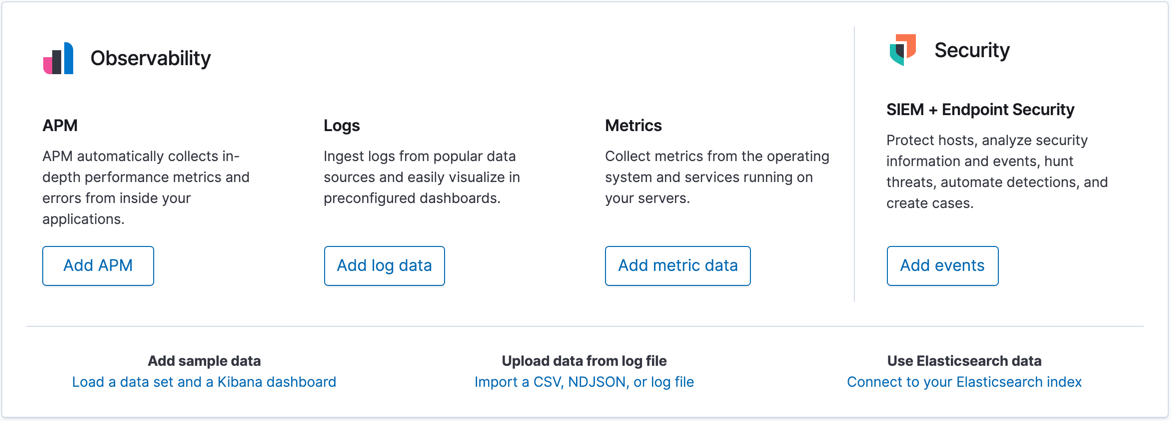
From the home page, Kibana provides these options for adding data:
- Import data using the File Data visualizer.
- Set up a data flow to Elasticsearch using our built-in tutorials. If a tutorial doesn’t exist for your data, go to the Beats overview to learn about other data shippers in the Beats family.
- Add a sample data set and take Kibana for a test drive without loading data yourself.
-
Index your data into Elasticsearch with REST APIs or client libraries.
Kibana uses an index pattern to tell it which Elasticsearch indices to explore. If you add upload a file, run a built-in tutorial, or add sample data, you get an index pattern for free, and are good to start exploring. If you load your own data, you can create an index pattern in Stack Management.
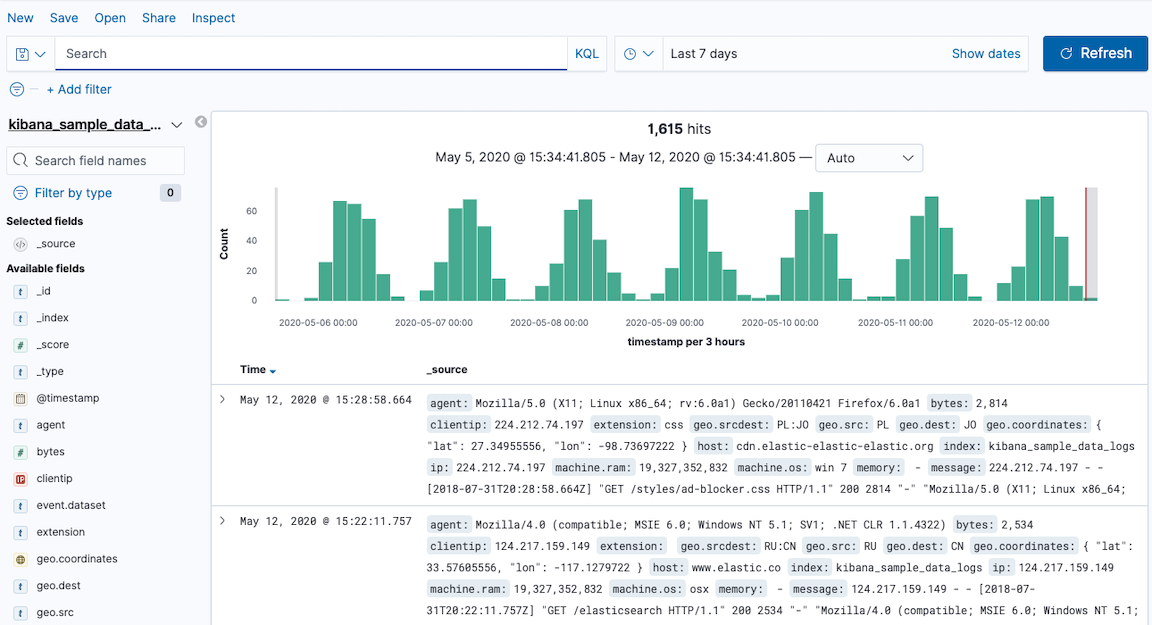
Explore & query
editReady to dive into your data? With Discover, you can explore your data and search for hidden insights and relationships. Ask your questions, and then narrow the results to just the data you want.
Visualize & analyze
editA visualization is worth a thousand log lines, and Kibana provides many options for showcasing your data. Use Lens, our drag-and-drop interface, to rapidly build charts, tables, metrics, and more. If there is a better visualization for your data, Lens suggests it, allowing for quick switching between visualization types.
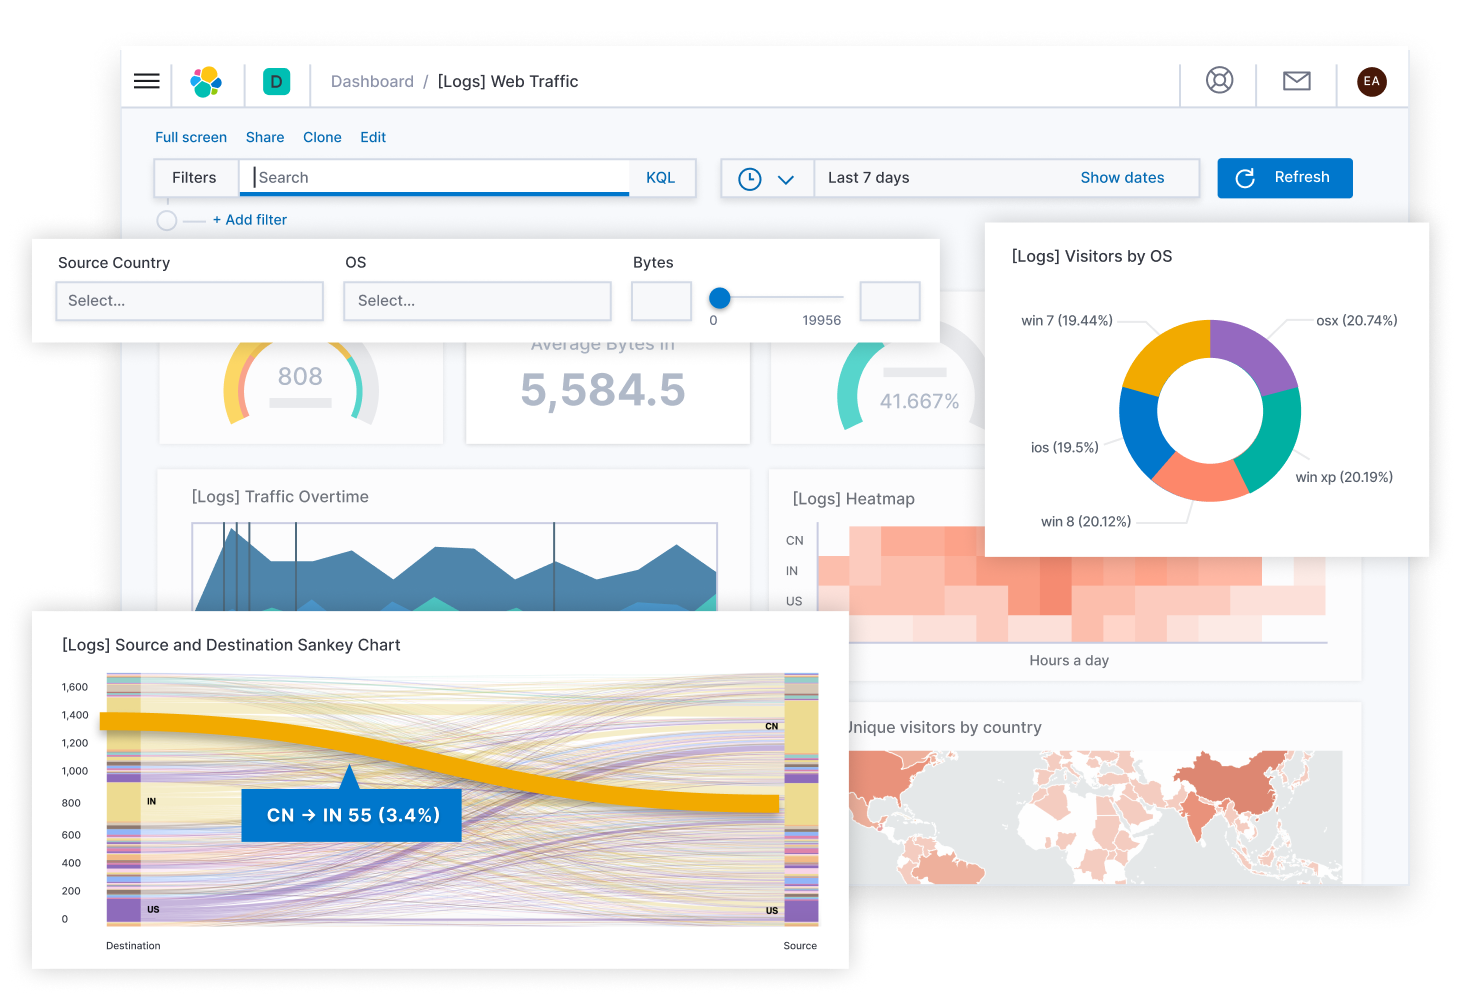
Once your visualizations are just the way you want, use Dashboard to collect them in one place. A dashboard provides insights into your data from multiple perspectives.
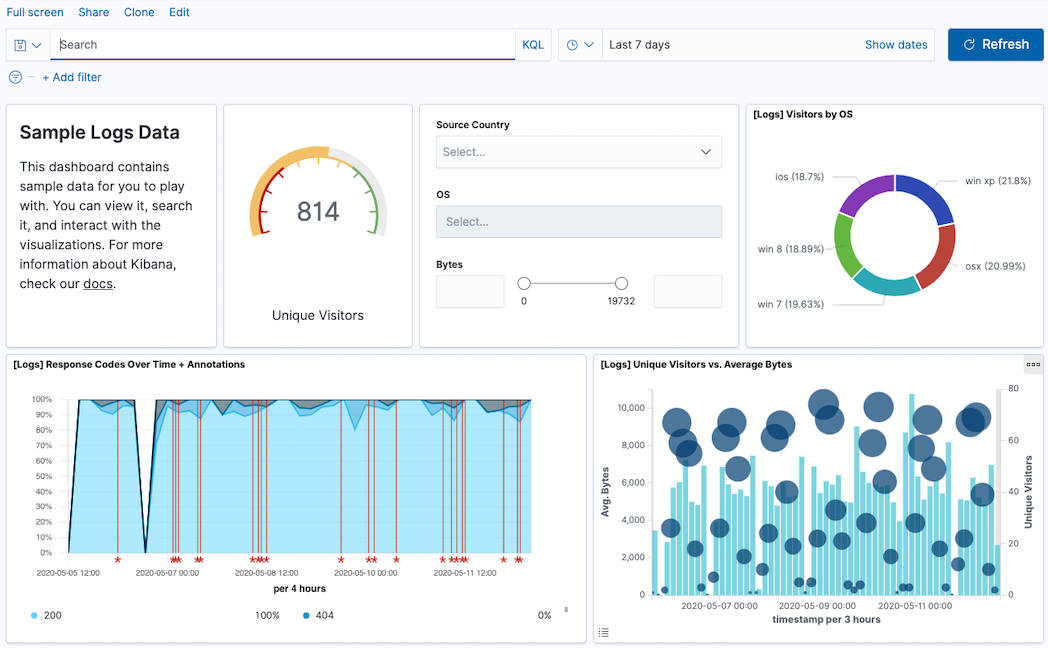
Kibana also offers these visualization features:
- Visualize allows you to display your data in charts, graphs, and tables (just to name a few). It’s also home to Lens. Visualize supports the ability to add interactive controls to your dashboard, filter dashboard content in real time, and add your own images and logos for your brand.
- Canvas gives you the ability to present your data in a visually compelling, pixel-perfect report. Give your data the “wow” factor needed to impress your CEO or to captivate coworkers with a big-screen display.
- Maps enables you to ask (and answer) meaningful questions of your location-based data. Maps supports multiple layers and data sources, mapping of individual geo points and shapes, and dynamic client-side styling.
- TSVB allows you to combine an infinite number of aggregations to display complex data. With TSVB, you can analyze multiple index patterns and customize every aspect of your visualization. Choose your own date format and color gradients, and easily switch your data view between time series, metric, top N, gauge, and markdown.
Organize & secure
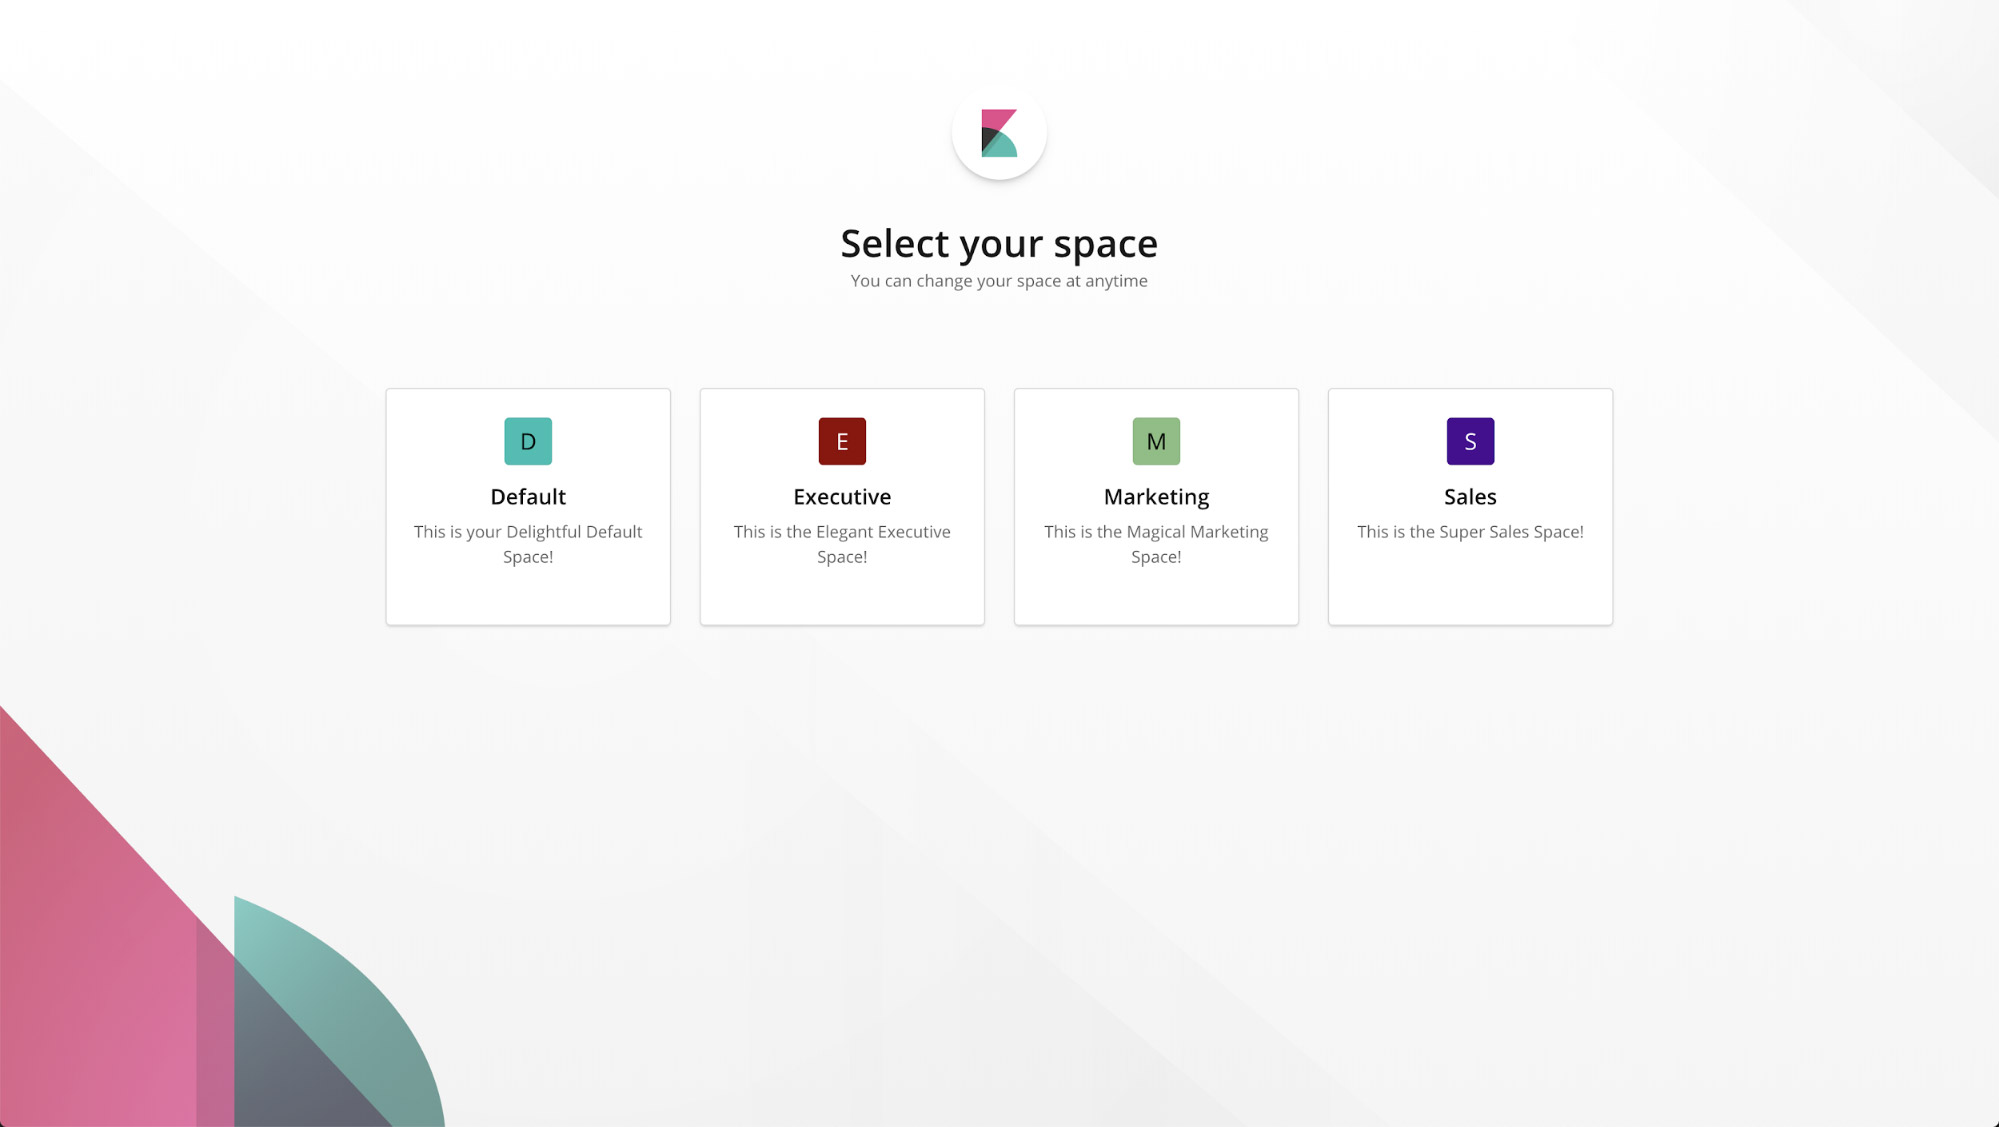
editWant to share Kibana’s goodness with other people or teams? You can do so with Spaces, built for organizing your visualizations, dashboards, and indices. Think of a space as its own mini Kibana installation — it’s isolated from all other spaces, so you can tailor it to your specific needs without impacting others.
You can even choose which features to enable within each space. Don’t need Machine learning in your “Executive” space? Simply turn it off.
You can take this all one step further with Kibana’s security features, and control which users have access to each space. Kibana allows for fine-grained controls, so you can give a user read-only access to dashboards in one space, but full access to all of Kibana’s features in another.
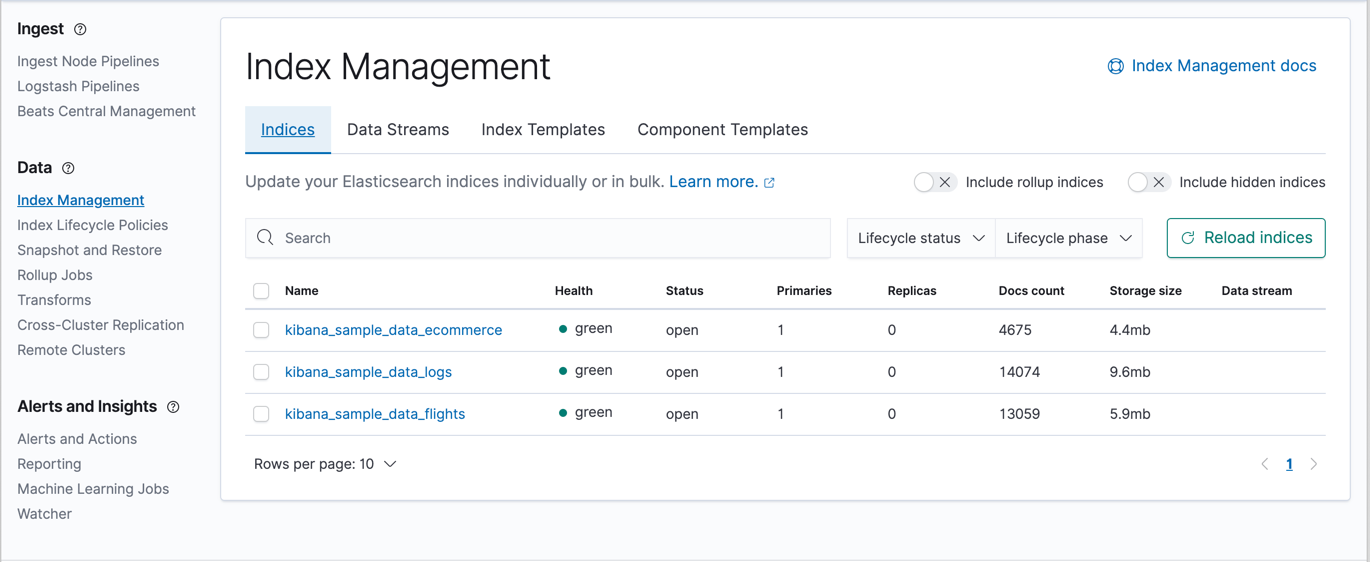
Manage all things Elastic Stack
editStack Management provides guided processes for managing all things Elastic Stack — indices, clusters, licenses, UI settings, index patterns, and more. Want to update your Elasticsearch indices? Set user roles and privileges? Turn on dark mode? Kibana has UIs for all that.
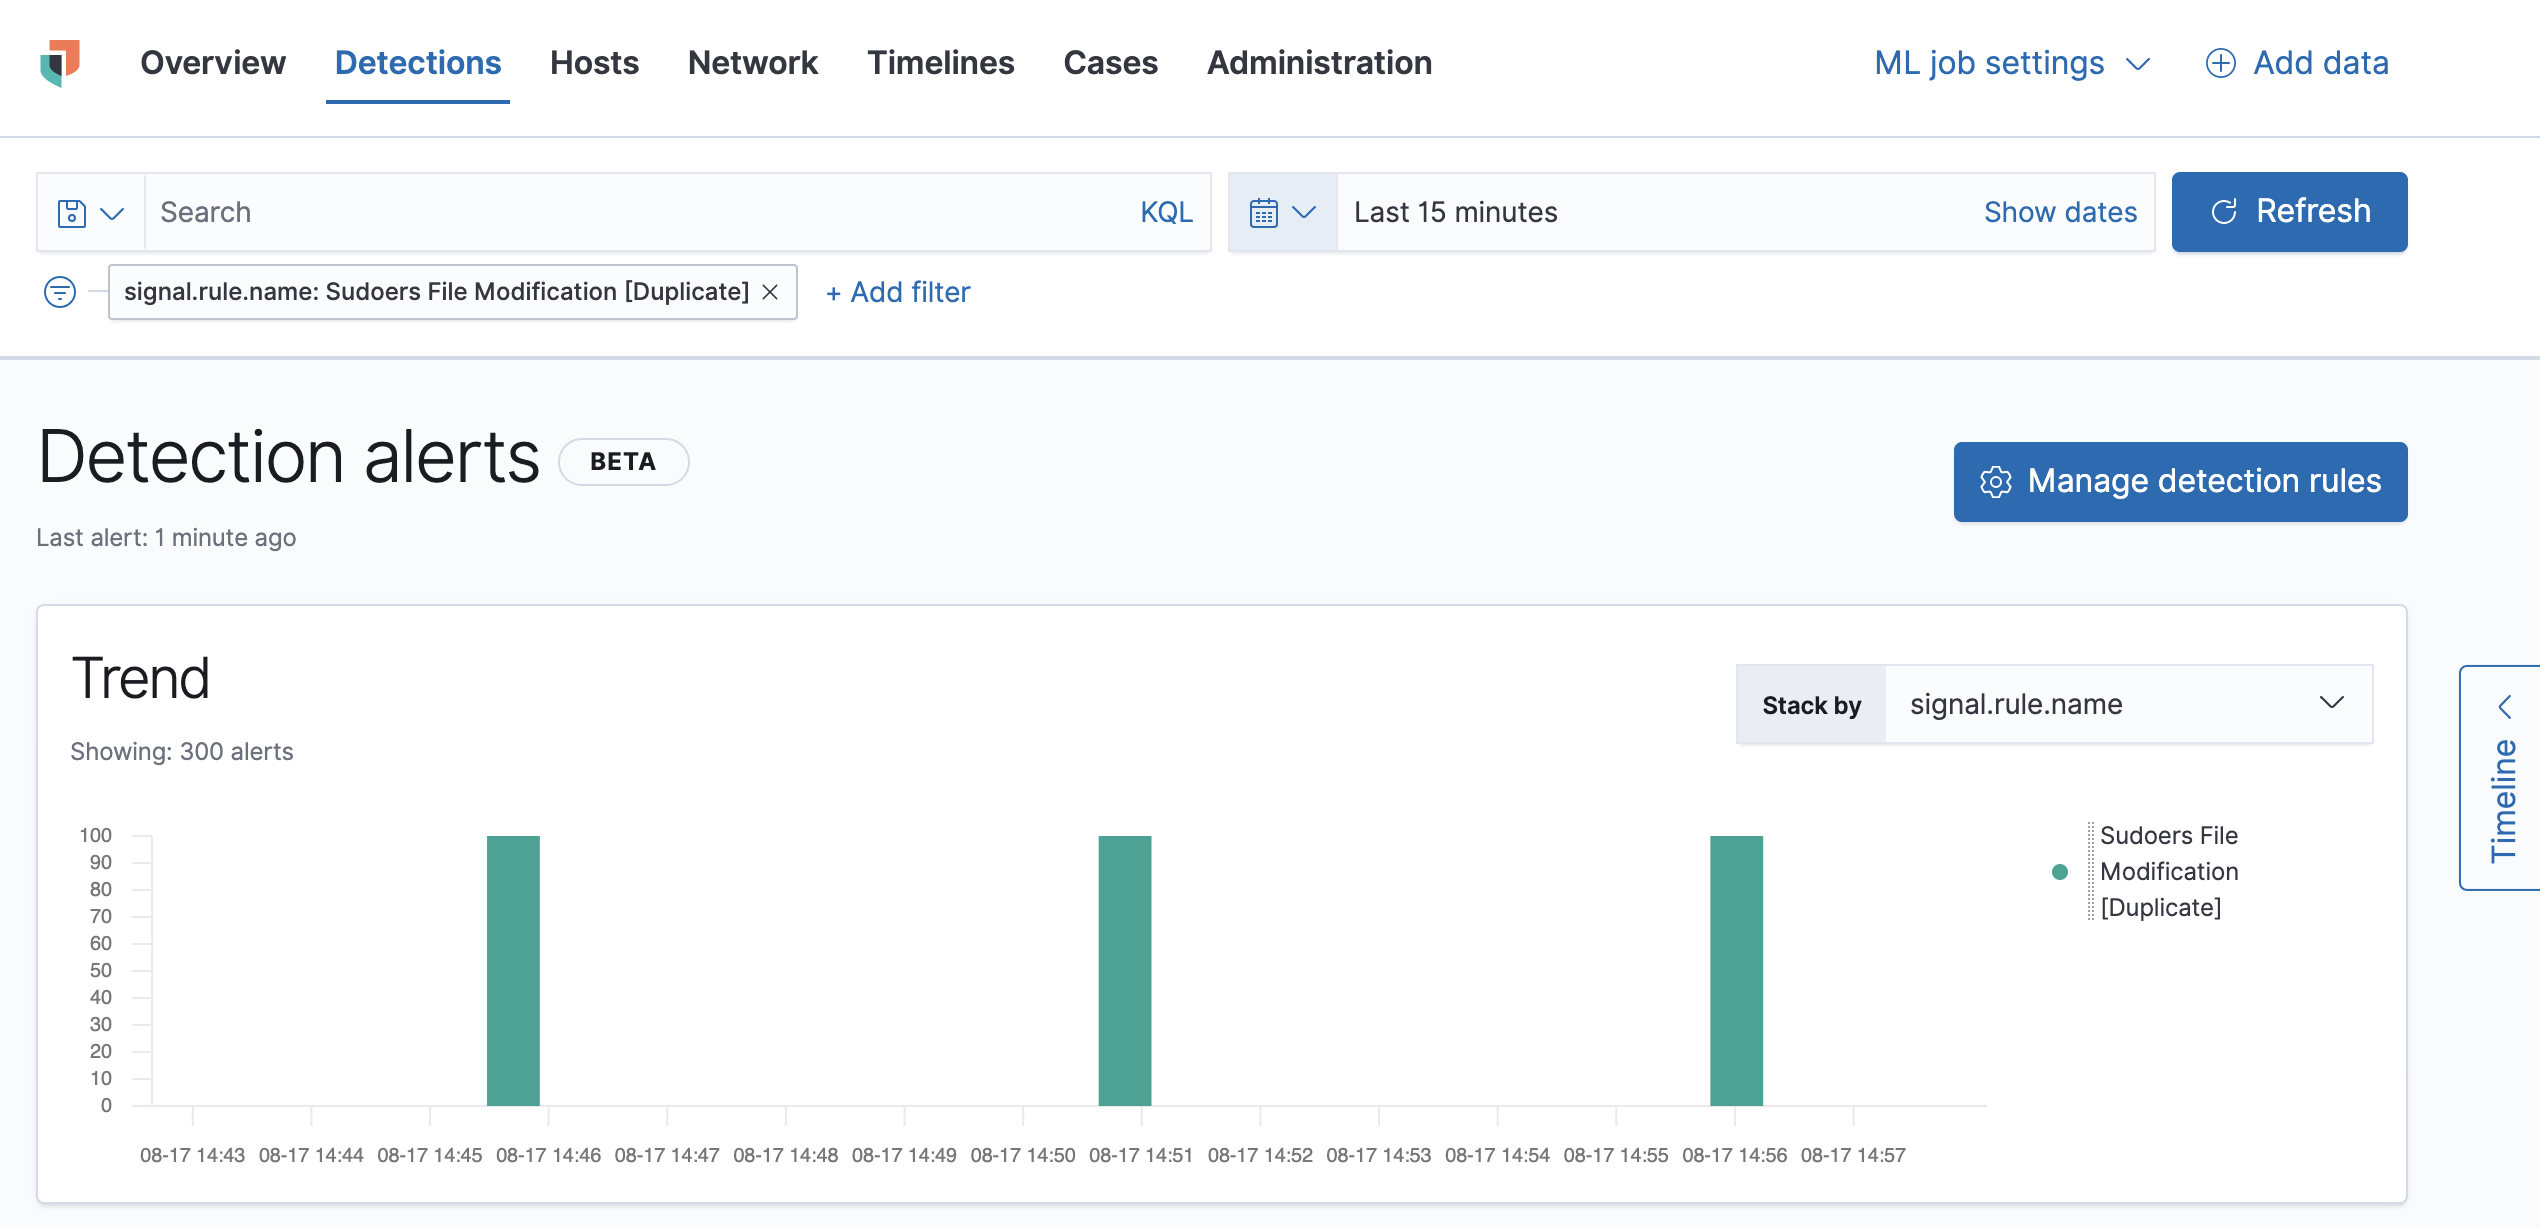
Extend your use case — or add a new one
editAs a hub for Elastic’s solutions, Kibana can help you find security vulnerabilities, monitor performance, and address your business needs. Get alerted if a key metric spikes. Detect anomalous behavior or forecast future spikes. Root out bottlenecks in your application code. Kibana doesn’t limit or dictate how you explore your data.
Give Kibana a try
editThere is no faster way to try out Kibana than with our hosted Elasticsearch Service. Sign up for a free trial and start exploring data in minutes.
You can also install Kibana on your own — no code, no additional infrastructure required.
Our Getting Started and in-product guidance can
help you get up and running, faster. Click the help icon ![]() in the top navigation bar for help with questions or to provide feedback.
in the top navigation bar for help with questions or to provide feedback.