Vega
editVega
editThis functionality is in technical preview and may be changed or removed in a future release. Elastic will work to fix any issues, but features in technical preview are not subject to the support SLA of official GA features.
Build custom visualizations from multiple data sources using Vega and Vega-Lite.
- Vega — A declarative format to create visualizations using JSON. Generate interactive displays using D3.
- Vega-Lite — An easier format to use than Vega that enables more rapid data analysis. Compiles into Vega.
For more information about Vega and Vega-Lite, refer to Resources and examples.
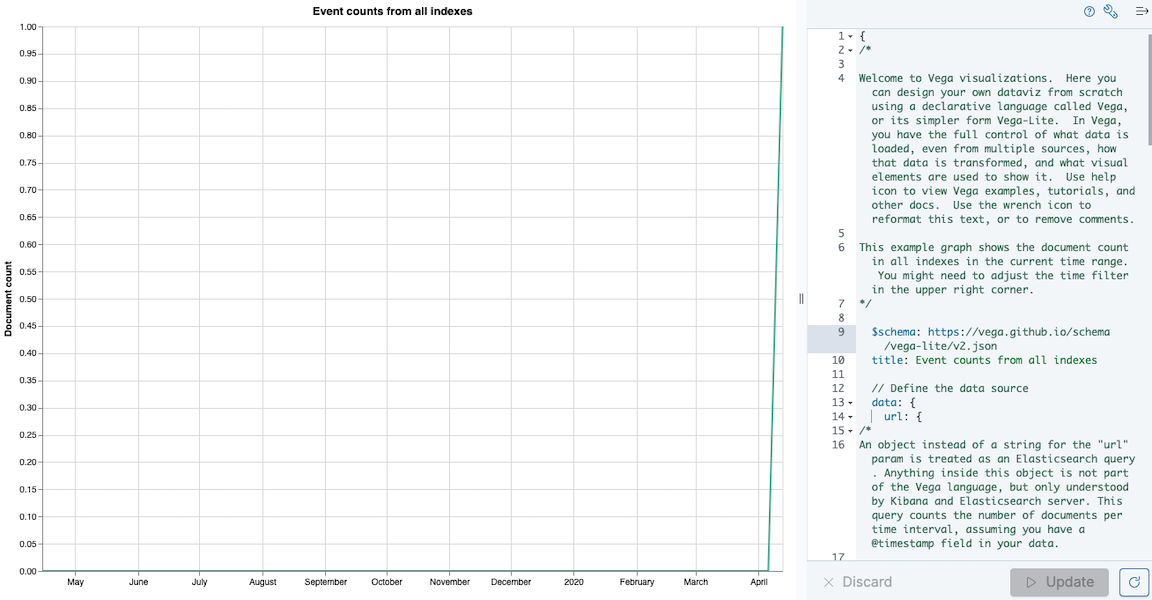
Create Vega visualizations
editYou create Vega visualizations by using the text editor, which is preconfigured with the options you need.
Change the Vega version
editThe default visualization uses Vega-Lite version 2. To use Vega version 4, edit
the schema.
Go to $schema, enter https://vega.github.io/schema/vega/v4.json, then click
Update.
Change the visualization type
editThe default visualization is a line chart. To change the visualization type,
change the mark value. The supported visualization types are listed in the
text editor.
Go to mark, change the value to a different visualization type, then click
Update.
Change the layout
editBy default, Vega visualizations use the autosize = { type: 'fit', contains: 'padding' } layout.
fit uses all available space, ignores width and height values,
and respects the padding values. To override this behavior, change the
autosize value.