Adding data
editAdding data
editTo start working with your data in Kibana, you can:
- Upload a CSV, JSON, or log file with the File Data Visualizer.
- Upload geospatial data with the GeoJSON Upload feature.
- Index logs, metrics, events, or application data by setting up a Beats module.
- Connect Kibana with existing Elasticsearch indices.
If you’re not ready to use your own data, you can add a sample data set to see all that you can do in Kibana.
Upload a CSV, JSON, or log file
editTo visualize data in a CSV, JSON, or log file, you can upload it using the File Data Visualizer. On the home page, click Import a CSV, NDSON, or log file, and then drag your file into the File Data Visualizer. You can upload a file up to 100 MB.
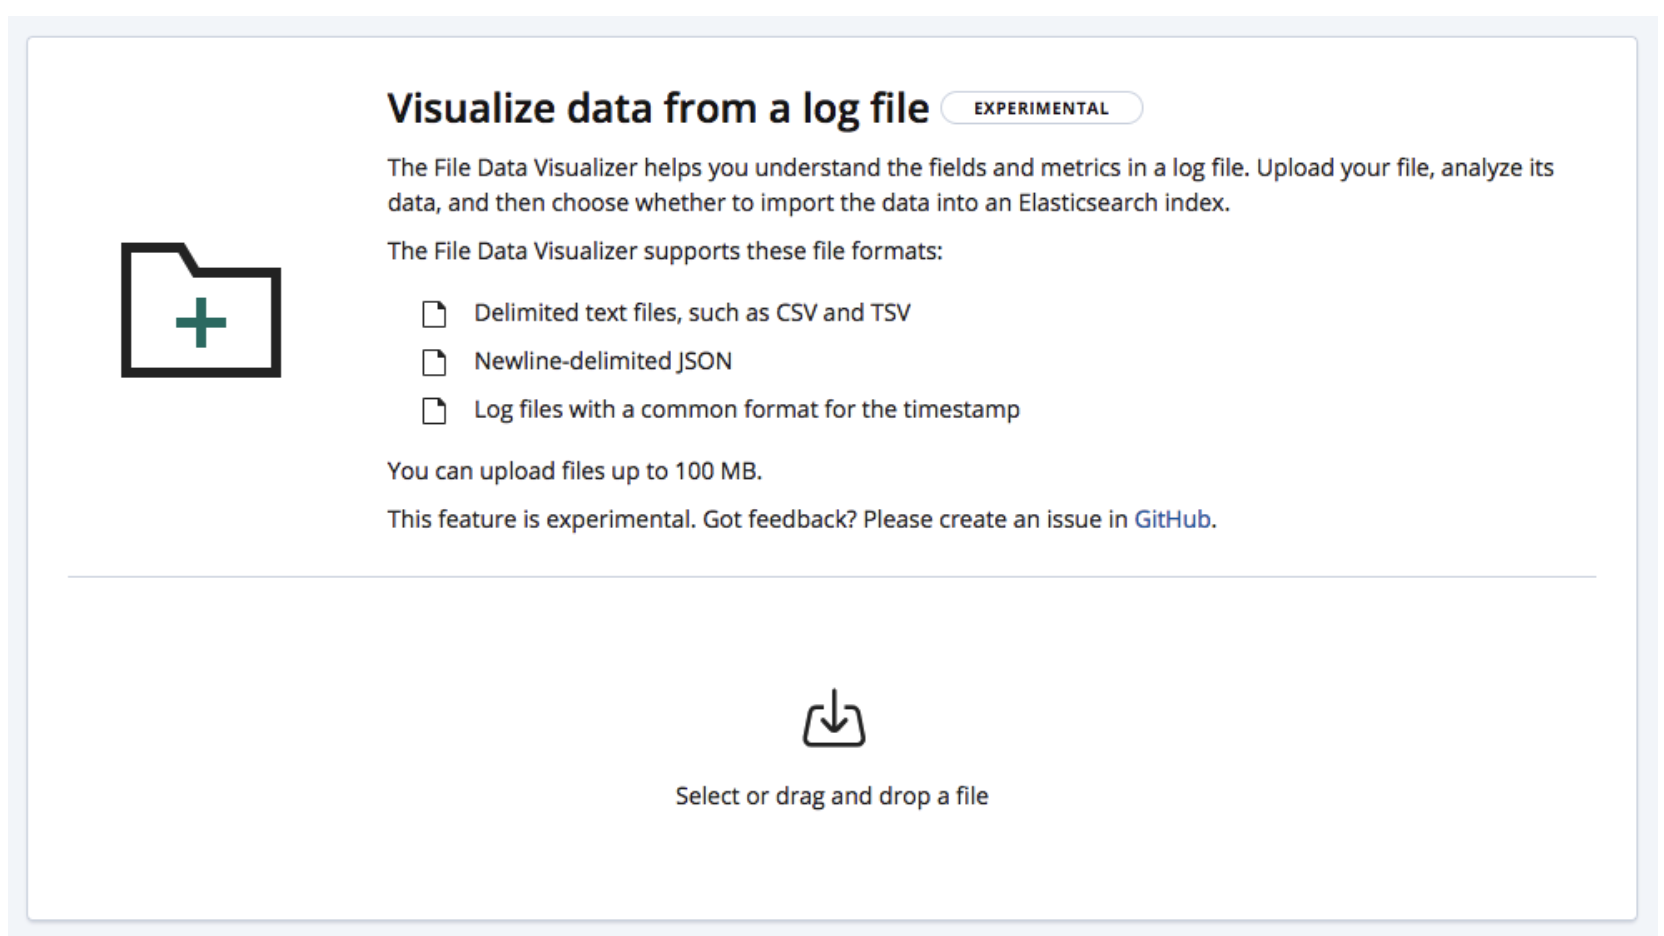
The File Data Visualizer uses the find_file_structure API to analyze the uploaded file and to suggest ingest pipelines and mappings for your data.
This feature is not intended for use as part of a repeated production process, but rather for the initial exploration of your data.
Upload geospatial data
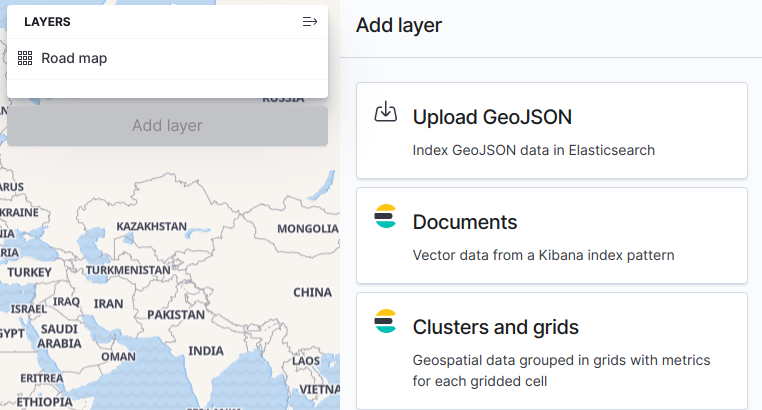
editTo visualize geospatial data in a point or shape file, you can upload it using the GeoJSON Upload feature in Elastic Maps, and then use that data as a layer in a map. The data is also available for use in the broader Kibana ecosystem, for example, in visualizations and Canvas workpads. With GeoJSON Upload, you can upload a file up to 50 MB.
Index metrics, log, security, and application data
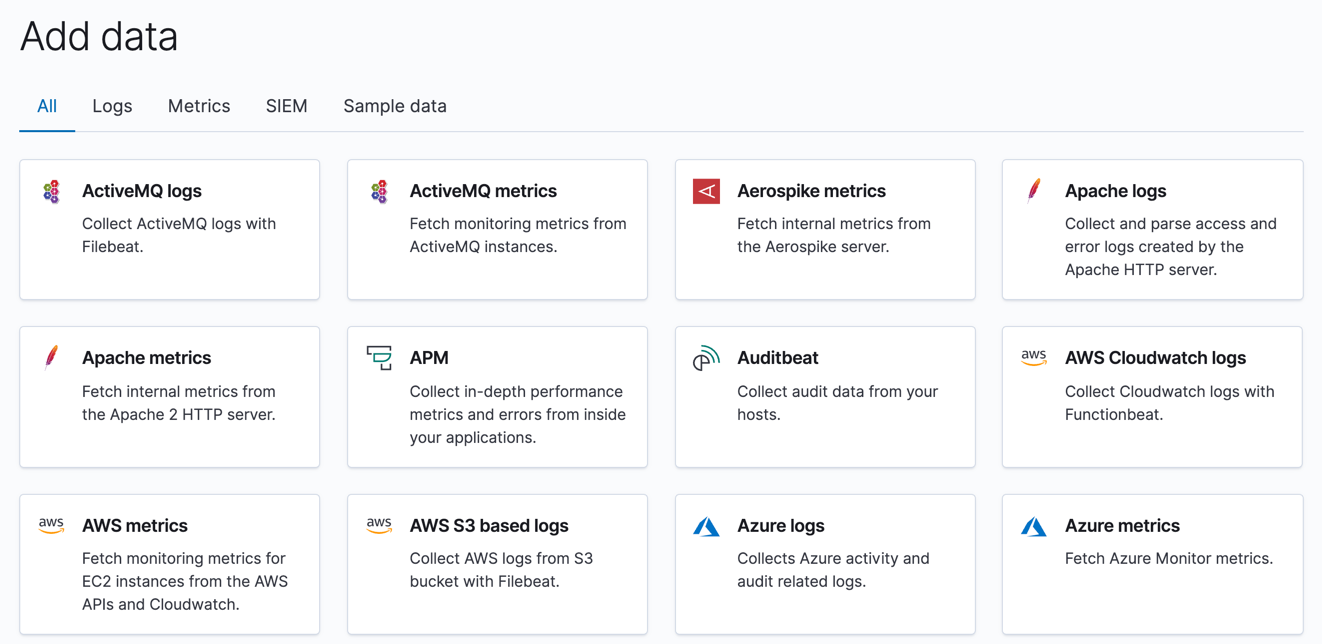
editThe built-in data tutorials can help you quickly get up and running with metrics data, log analytics, security events, and application data. These tutorials walk you through installing and configuring a Beats data shipper to periodically collect and send data to Elasticsearch. You can then use the pre-built dashboards to explore and analyze the data.
You access the tutorials from the home page. If a tutorial doesn’t exist for your data, go to the Beats overview to learn about other data shippers in the Beats family.
Connect with Elasticsearch indices
editTo visualize data in existing Elasticsearch indices, you must create an index pattern that matches the names of the indices that you want to explore. When you add data with the File Data Visualizer, GeoJSON Upload feature, or built-in tutorial, an index pattern is created for you.
- Go to Stack Management, and then click Index Patterns.
- Click Create index pattern.
-
Specify an index pattern that matches the name of one or more of your Elasticsearch indices.
For example, an index pattern can point to your Apache data from yesterday,
filebeat-apache-4-3-2022, or any index that matches the pattern,filebeat-*. Using a wildcard is the more popular approach. -
Click Next Step, and then select the index field that contains the timestamp you want to use to perform time-based comparisons.
Kibana reads the index mapping and lists all fields that contain a timestamp. If your index doesn’t have time-based data, choose I don’t want to use the Time Filter.
You must select a time field to use global time filters on your dashboards.
-
Click Create index pattern.
Kibana is now configured to access your Elasticsearch indices. You’ll see a list of fields configured for the matching index. You can designate your index pattern as the default by clicking the star icon on this page.
When searching in Discover and creating visualizations, you choose a pattern from the index pattern menu to specify the Elasticsearch indices that contain the data you want to explore.