Span timeline
editSpan timeline
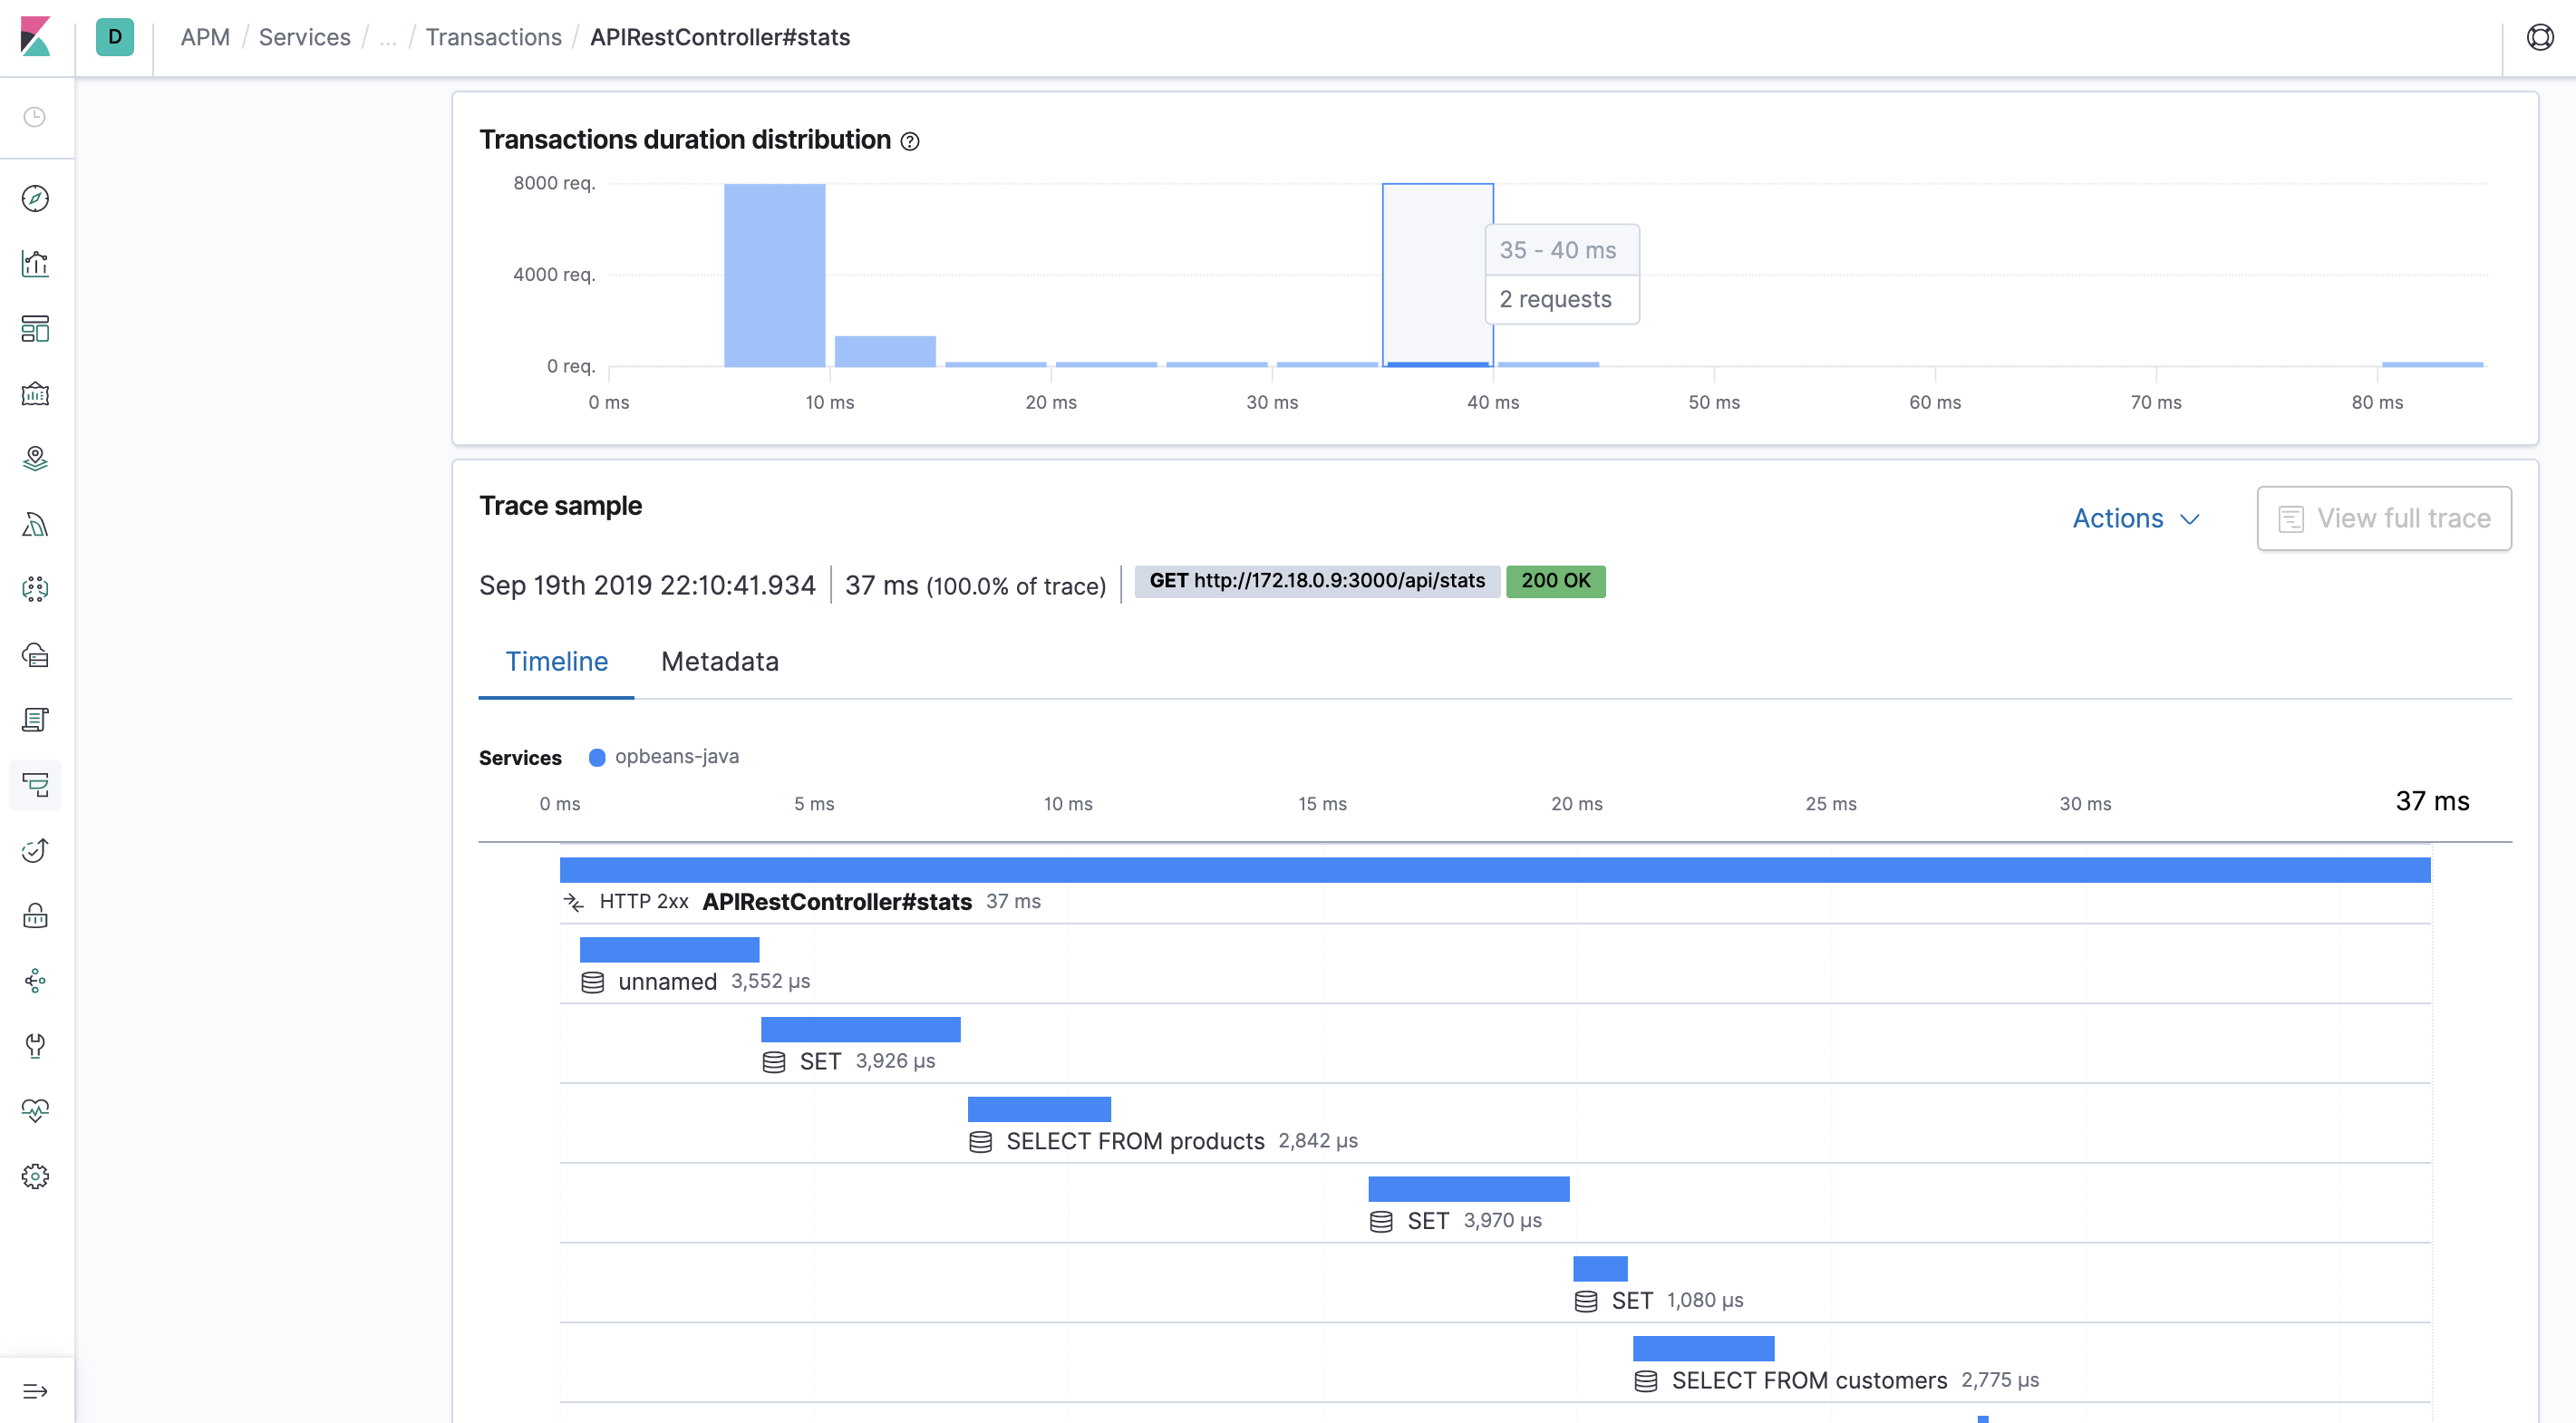
editA span is defined as the duration of a single event. Spans are automatically captured by APM agents, and you can also define custom spans. Each span has a type and is defined by a different color in the timeline/waterfall visualization.
The span timeline visualization is a bird’s-eye view of what your application was doing while it was trying to respond to the request that came in. This makes it useful for visualizing where the selected transaction spent most of its time.
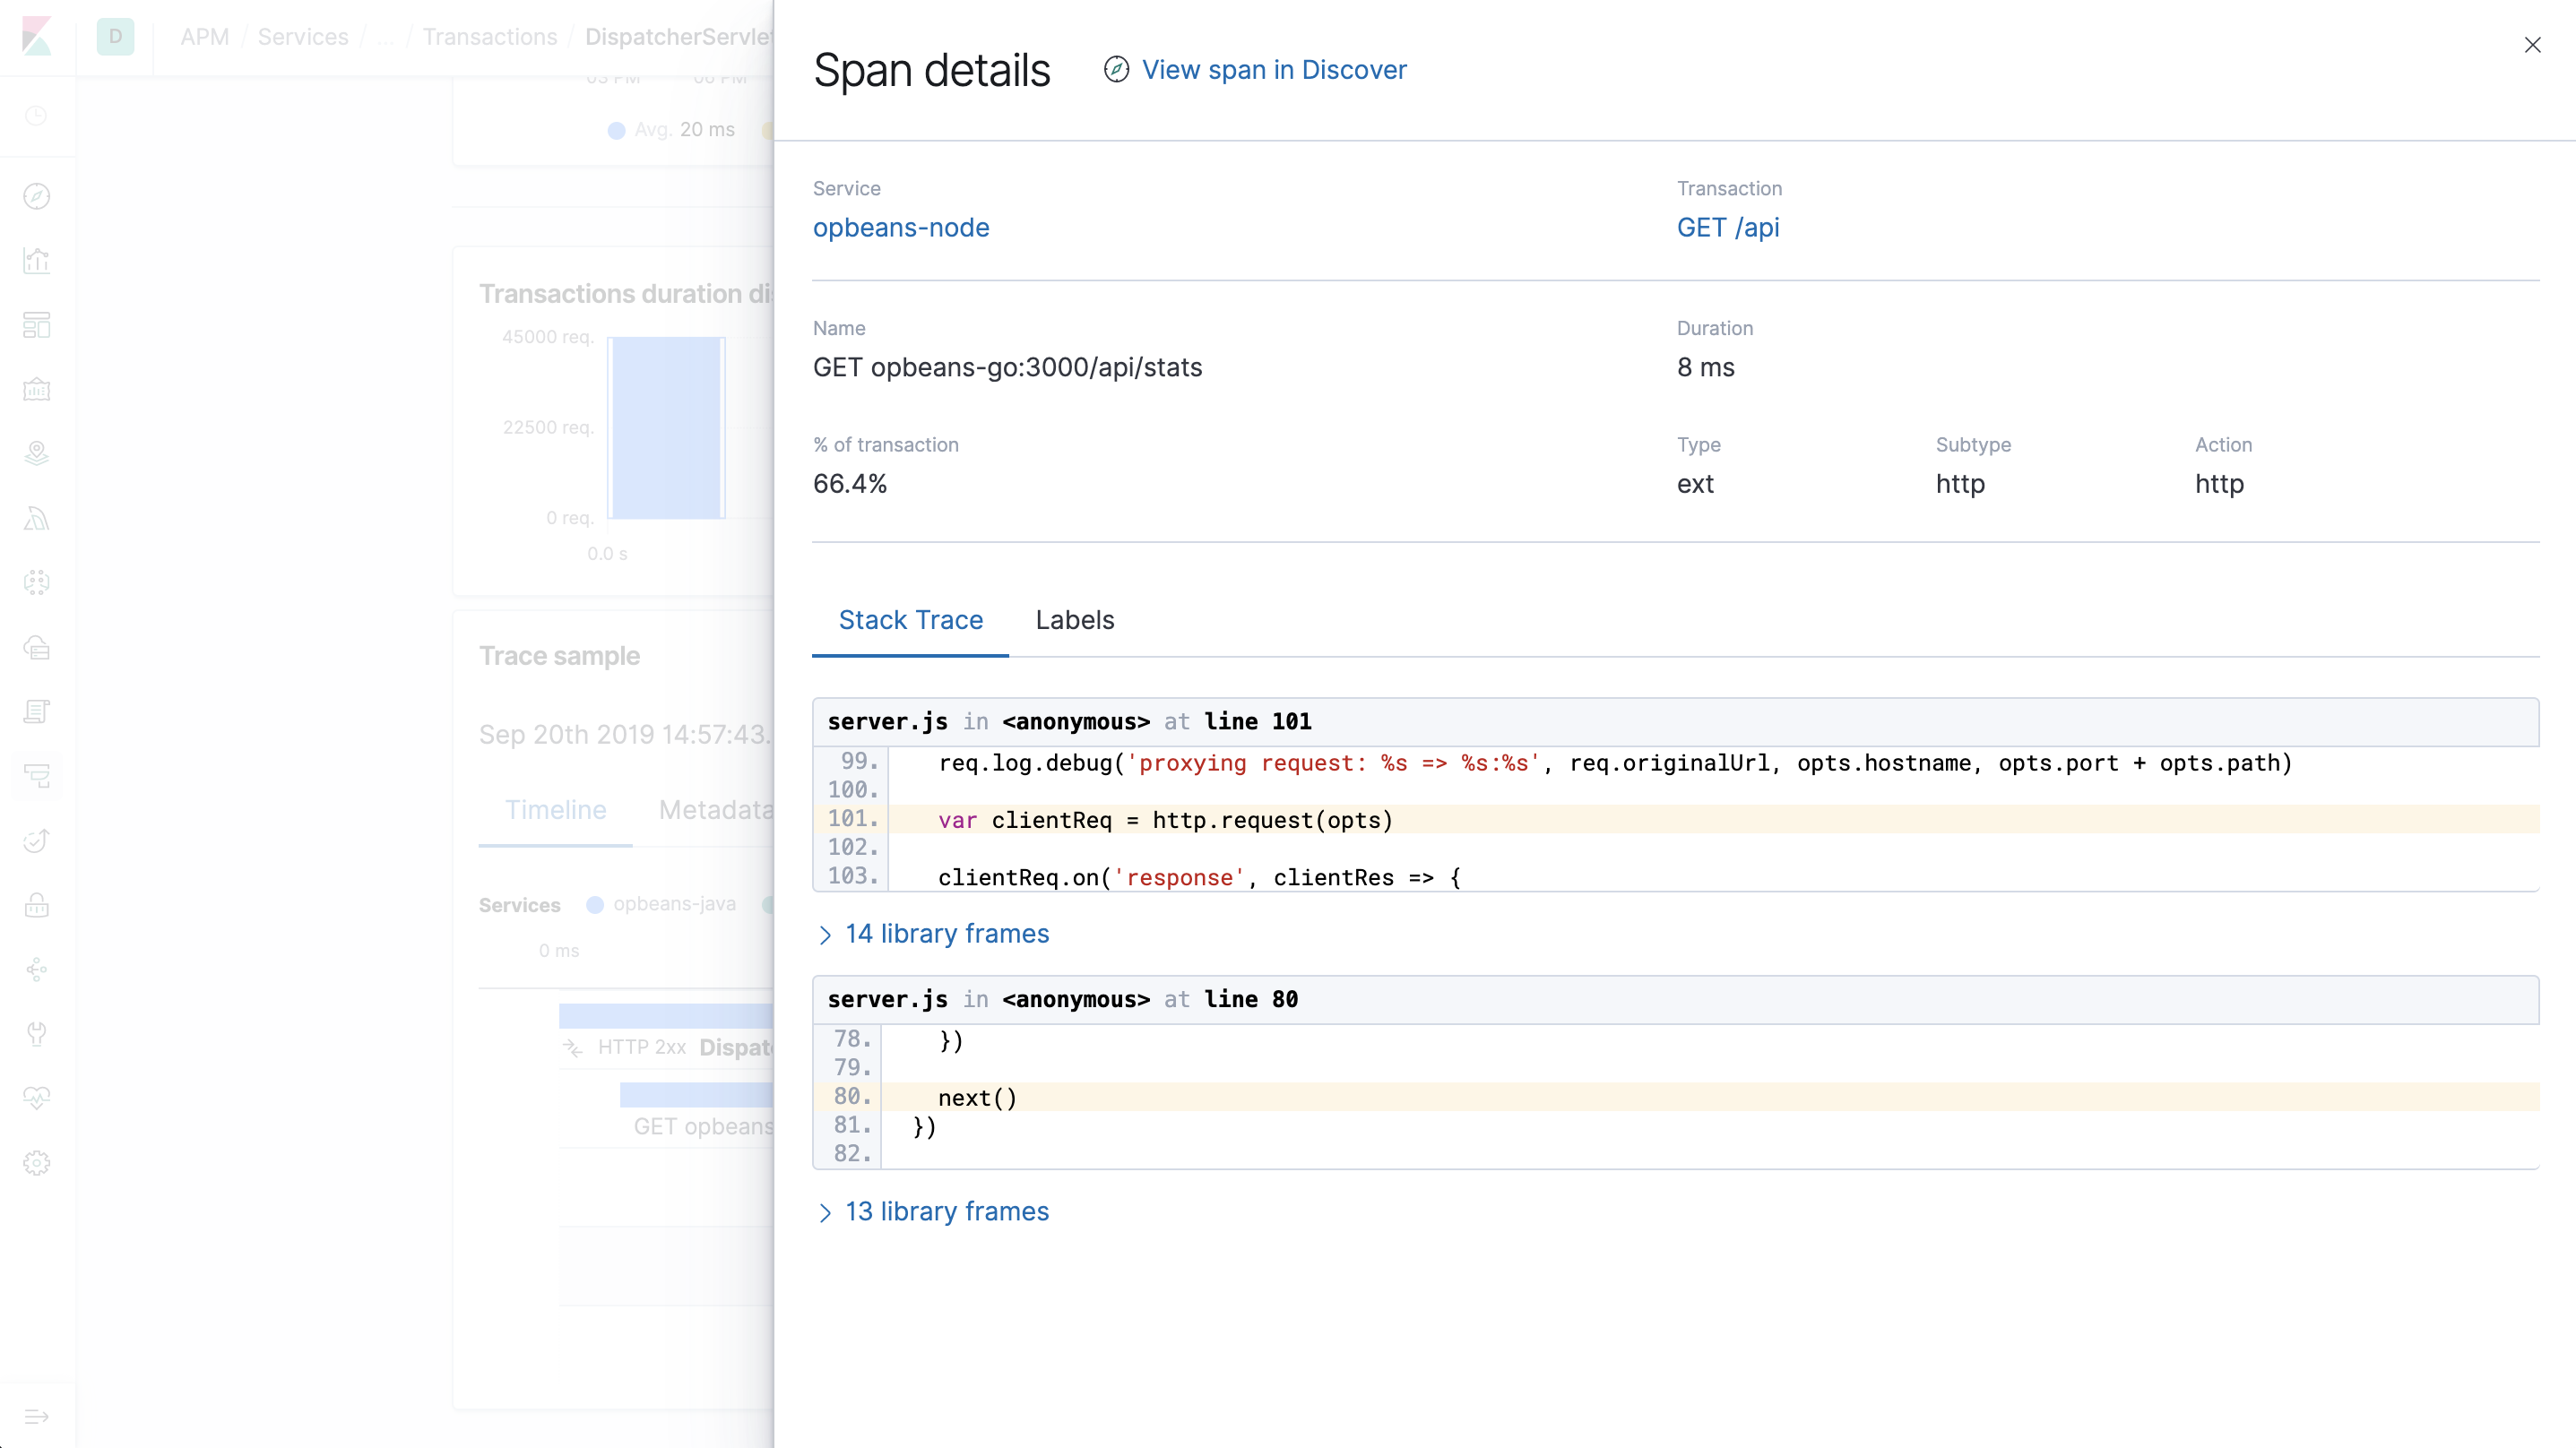
View a span in detail by clicking on it in the timeline waterfall. When you click on an SQL Select database query, the information displayed includes the actual SQL that was executed, how long it took, and the percentage of the trace’s total time. You also get a stack trace, which shows the SQL query in your code. Finally, APM knows which files are your code and which are just modules or libraries that you’ve installed. These library frames will be minimized by default in order to show you the most relevant stack trace.
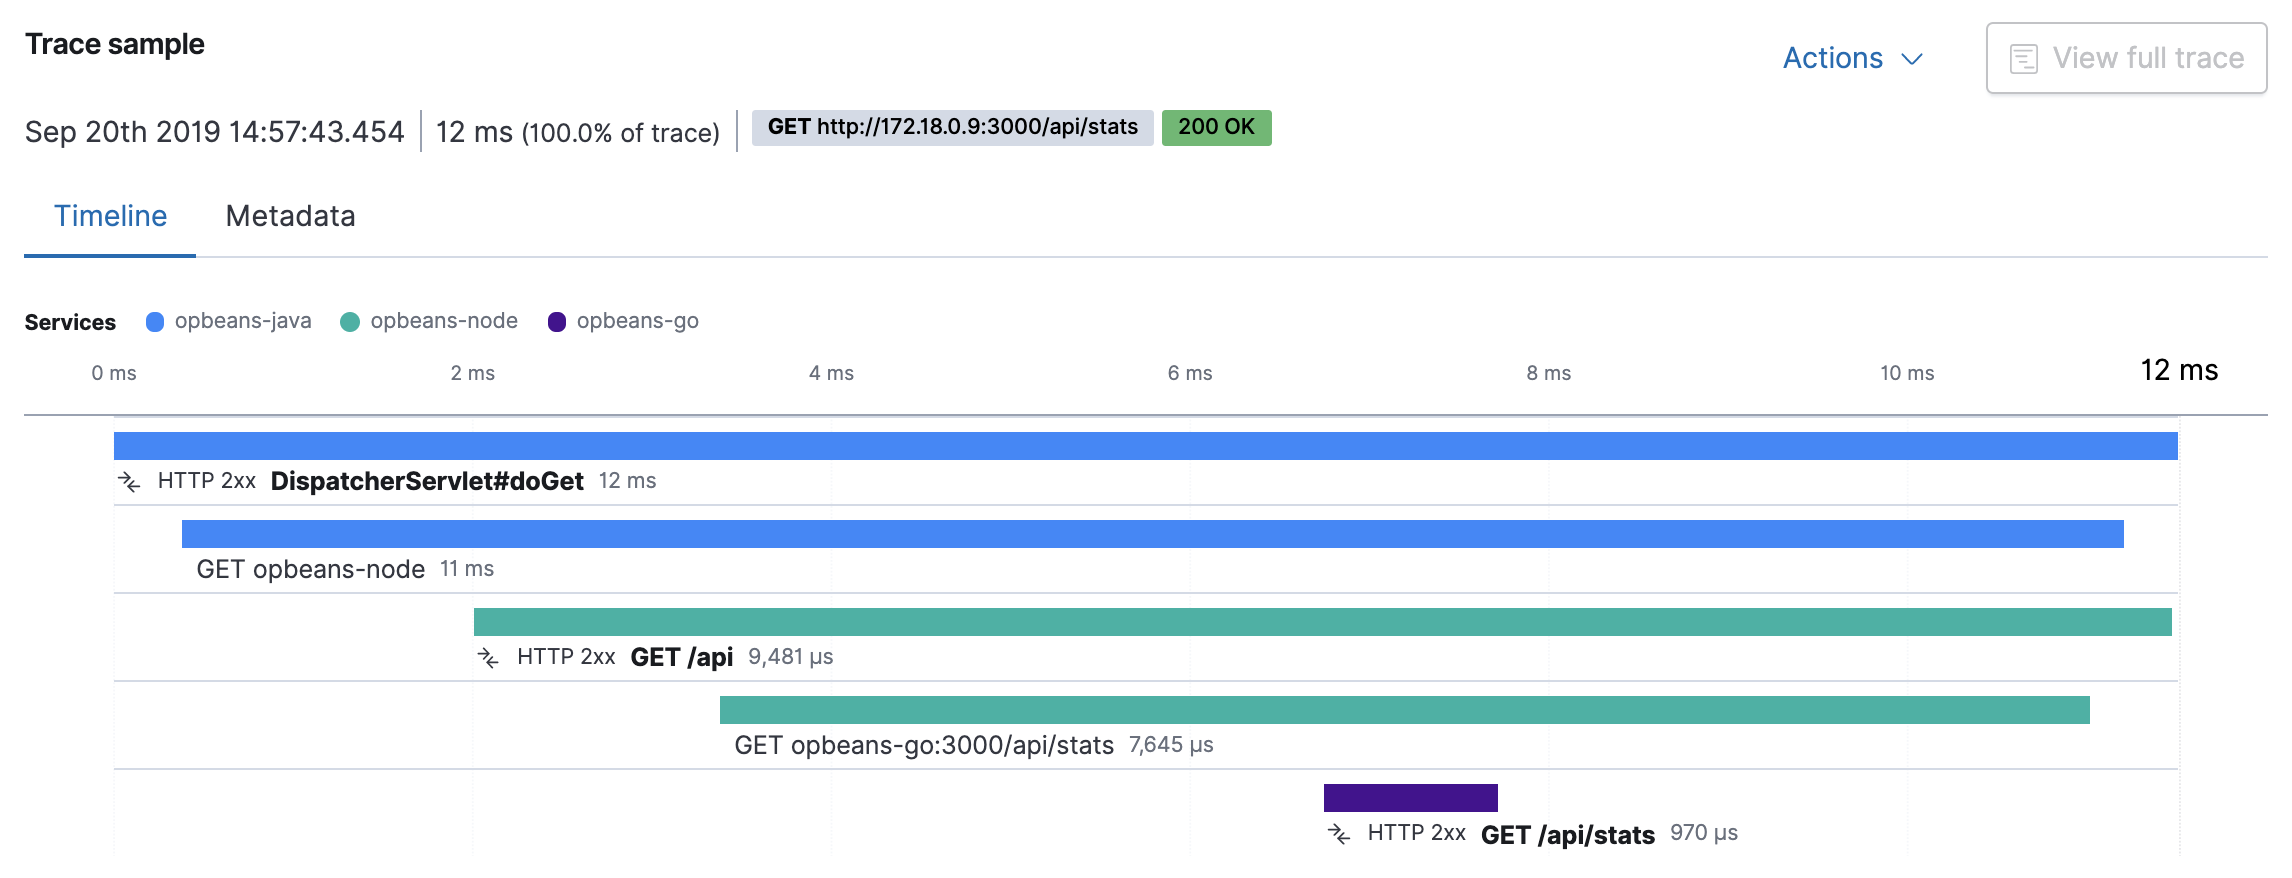
If your span timeline is colorful, it’s indicative of a distributed trace. Services in a distributed trace are separated by color and listed in the order they occur.

Don’t forget, a distributed trace includes more than one transaction.
When viewing these distributed traces in the timeline waterfall, you’ll see this ![]() icon,
which indicates the next transaction in the trace.
These transactions can be expanded and viewed in detail by clicking on them.
icon,
which indicates the next transaction in the trace.
These transactions can be expanded and viewed in detail by clicking on them.
After exploring these traces, you can return to the full trace by clicking View full trace in the upper right hand corner of the page.