NOTE: You are looking at documentation for an older release. For the latest information, see the current release documentation.
6.5.0 release highlights
edit6.5.0 release highlights
editEach release of Kibana brings new features and product improvements. Here are the highlights of the features that were added in 6.5.0 and how the user experience improved.
Refer to the Kibana 6.5.0 Release Notes for a list of bug fixes and other changes.
Organize your work in spaces
editSpaces is one of our most highly requested features. Spaces allow you to organize your saved objects into meaningful categories. For example, you might place all sales visuals in a sales space and all logging objects in a logging space.
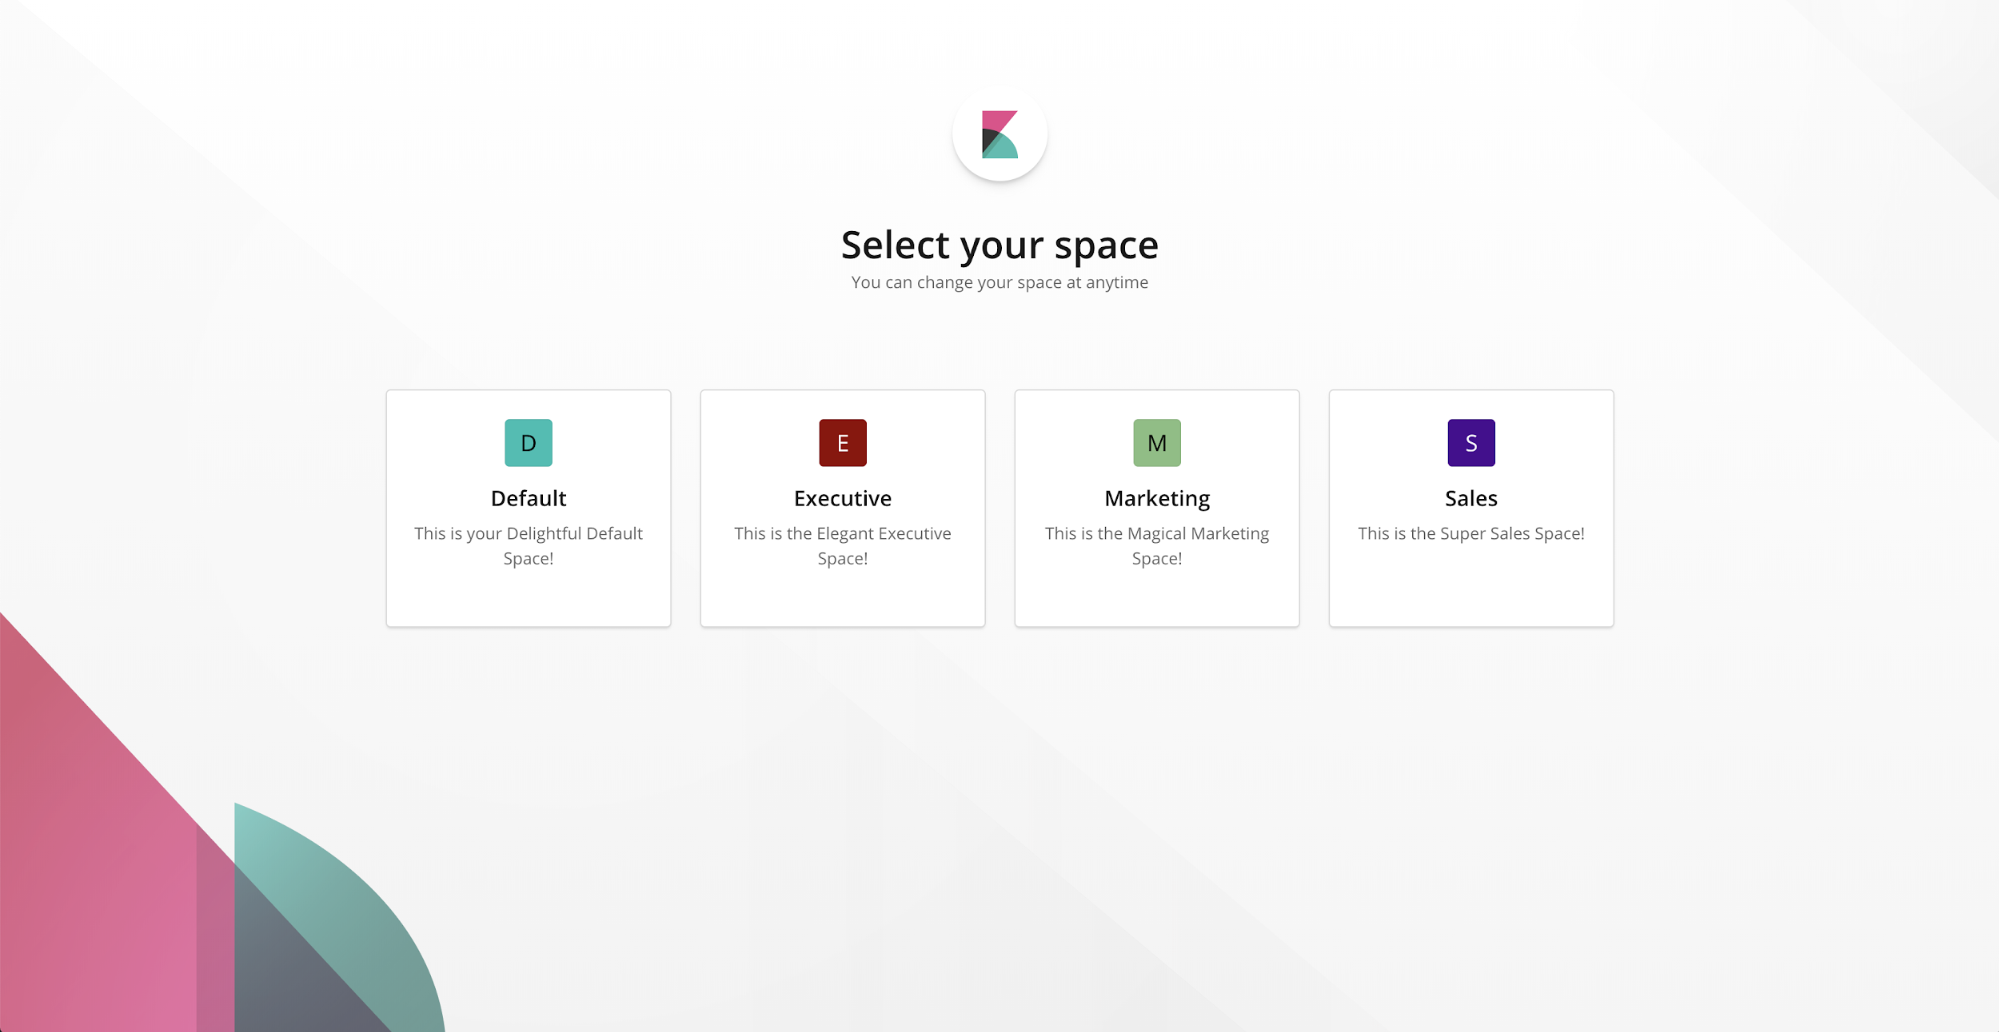
You can create as many spaces as you need, change spaces at any time, and move saved objects between spaces. With security enabled, you can control which roles and users have access to which spaces using role-based access control (RBAC).
To create, edit, and delete spaces, use Management > Spaces. Or, if you prefer to create your spaces programmatically, you can use the Kibana Spaces API.
Monitor cross-cluster replication (beta*)
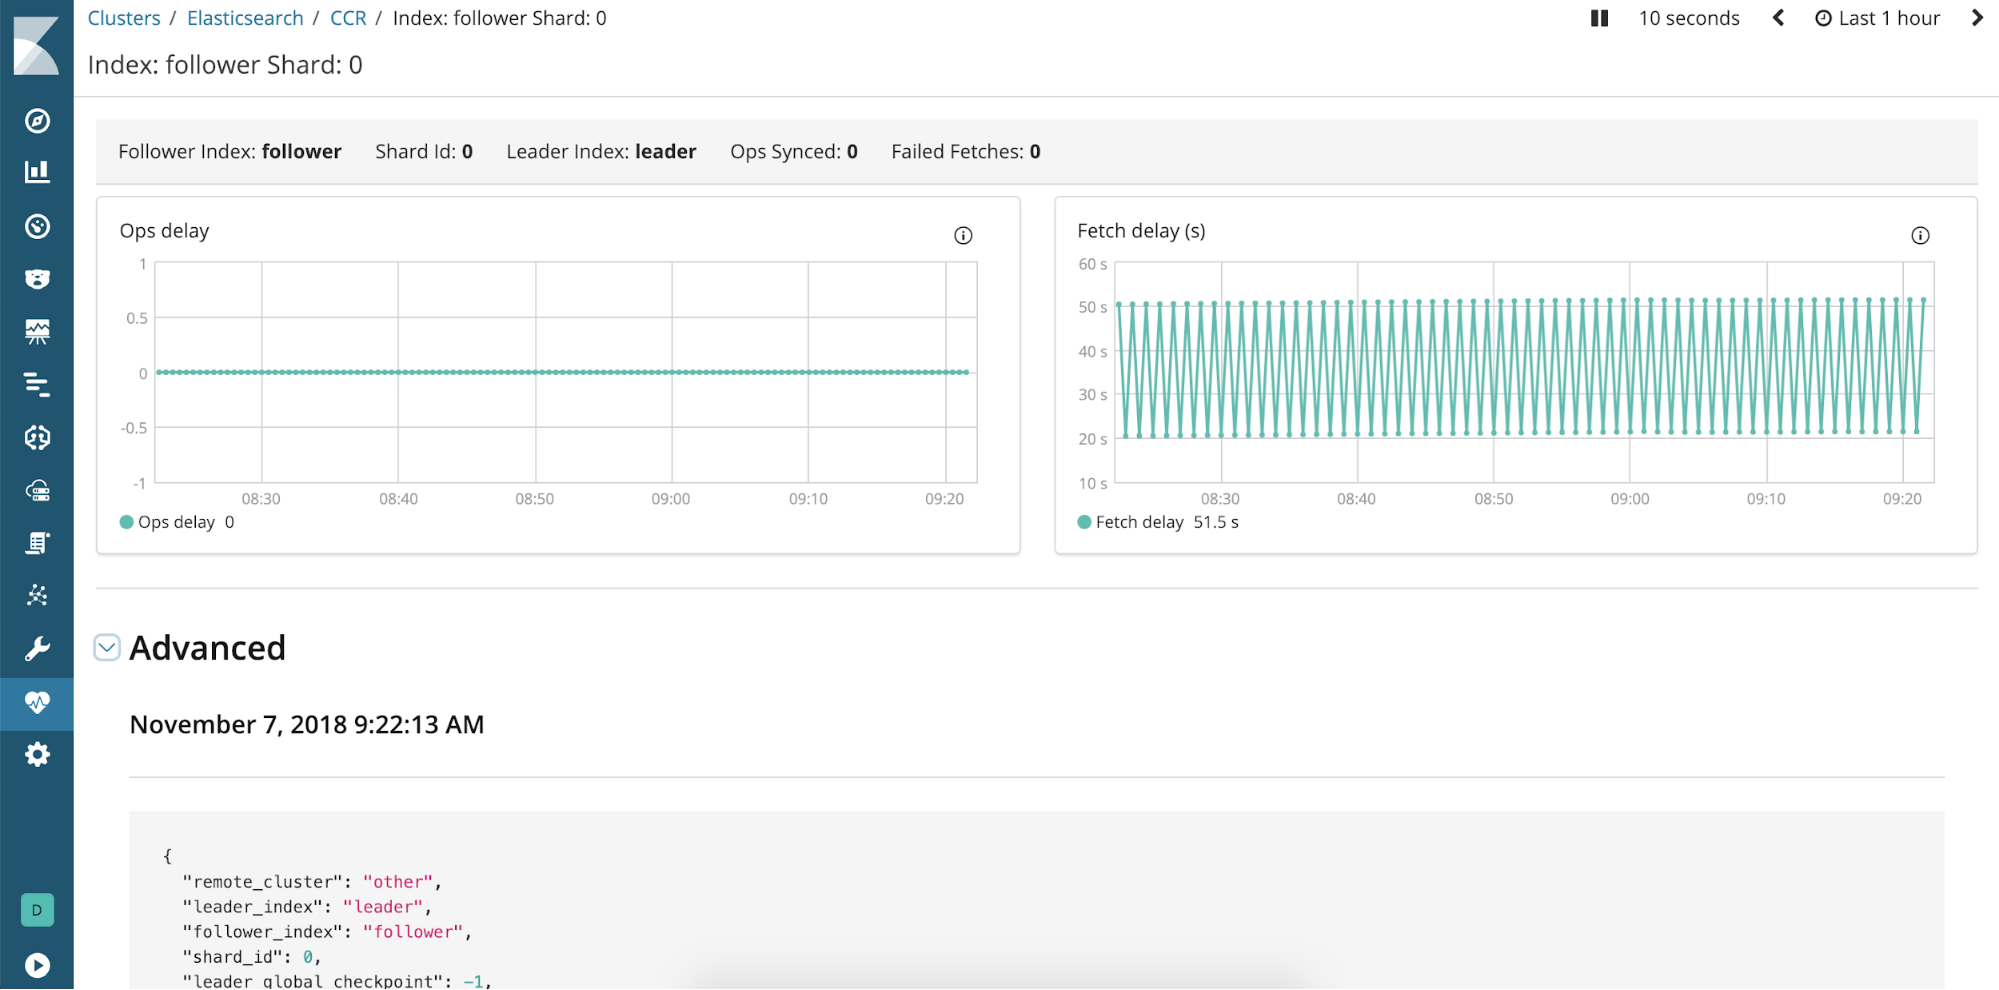
editMonitoring includes a new UI for monitoring cross-cluster replication as a beta feature in 6.5. Cross-cluster replication gives you resiliency in case the primary cluster fails—a secondary cluster serves as a hot backup. With the UI, you can monitor how indices are replicated from one cluster to another and view detailed information on the leader index, the following indices, and the shards. You’ll also get verification on whether the replication process is viable.
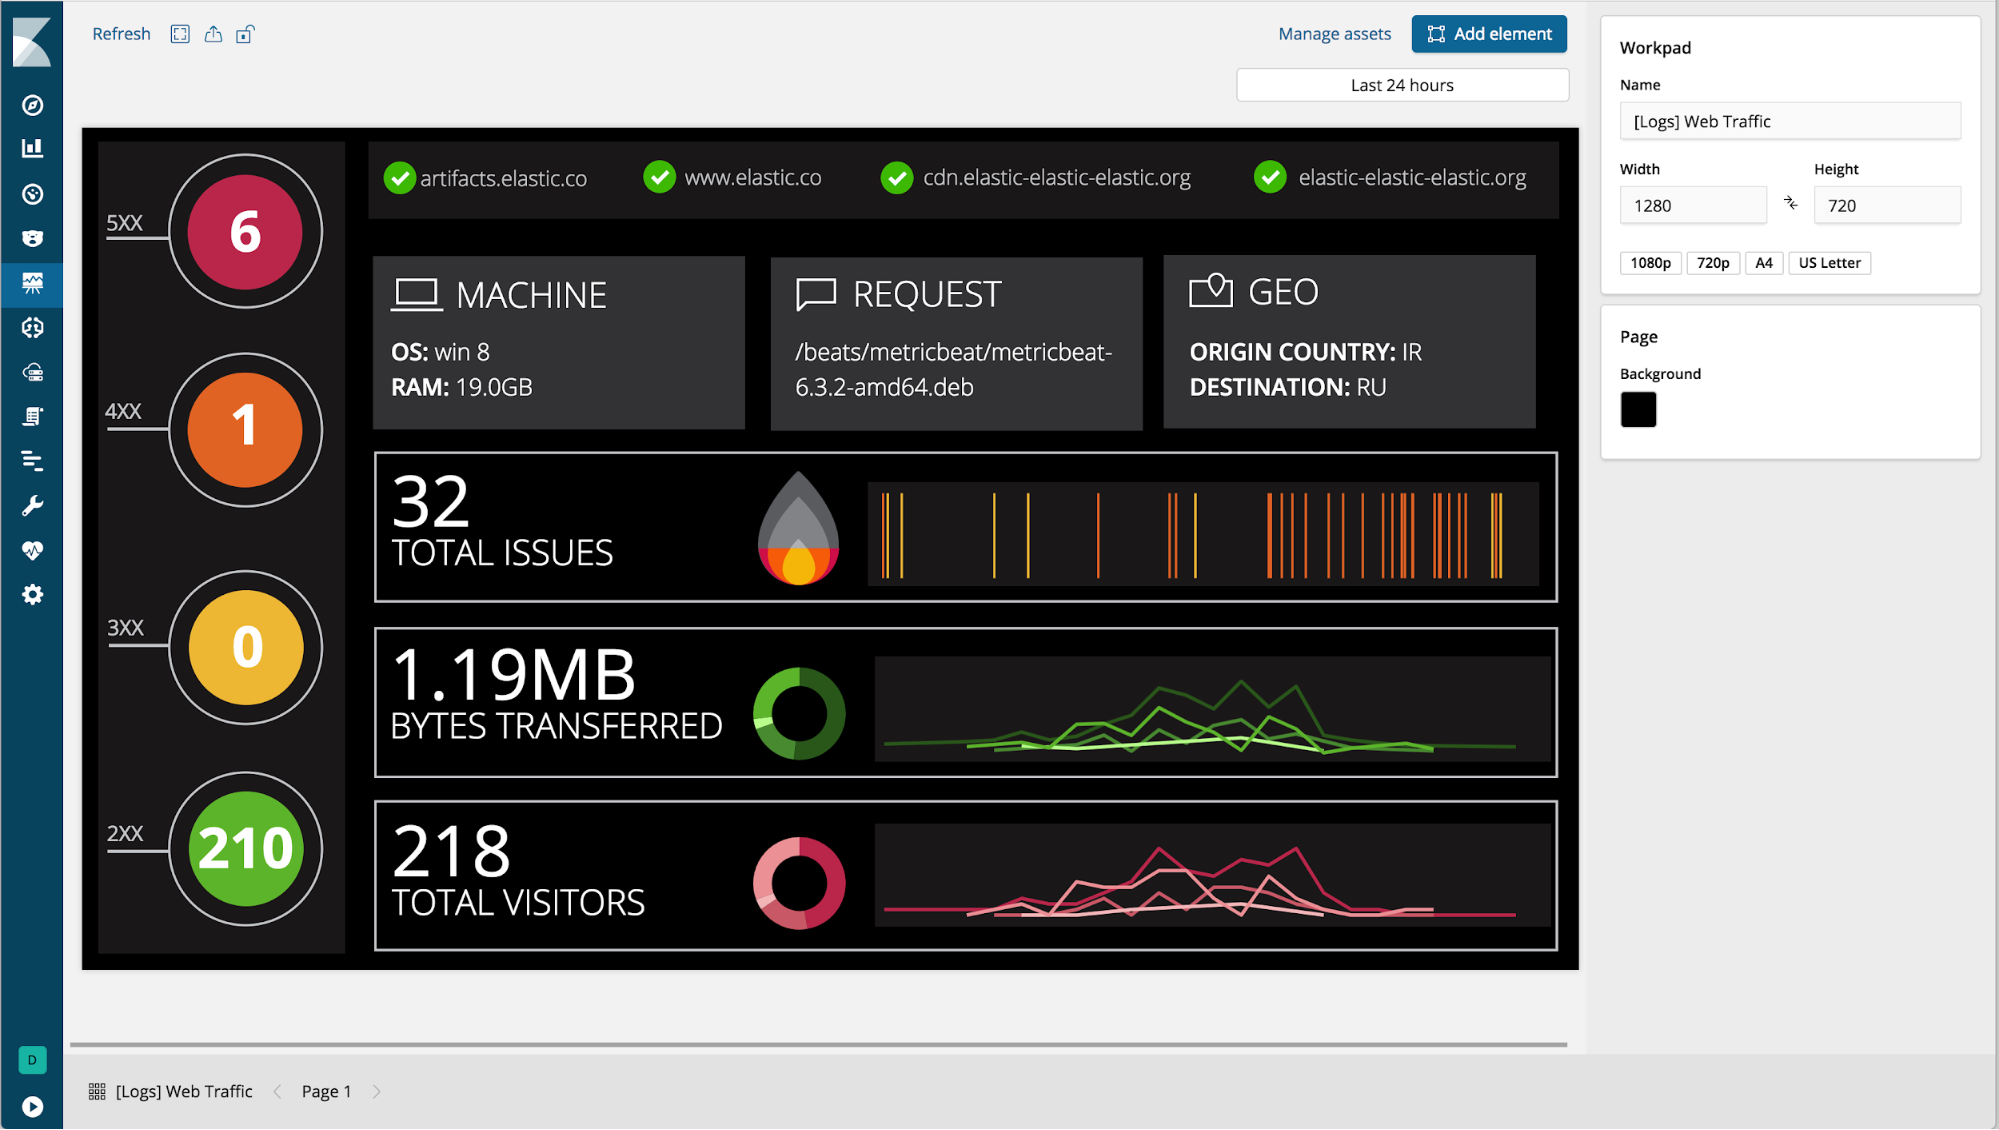
Showcase your data in Canvas (beta*)
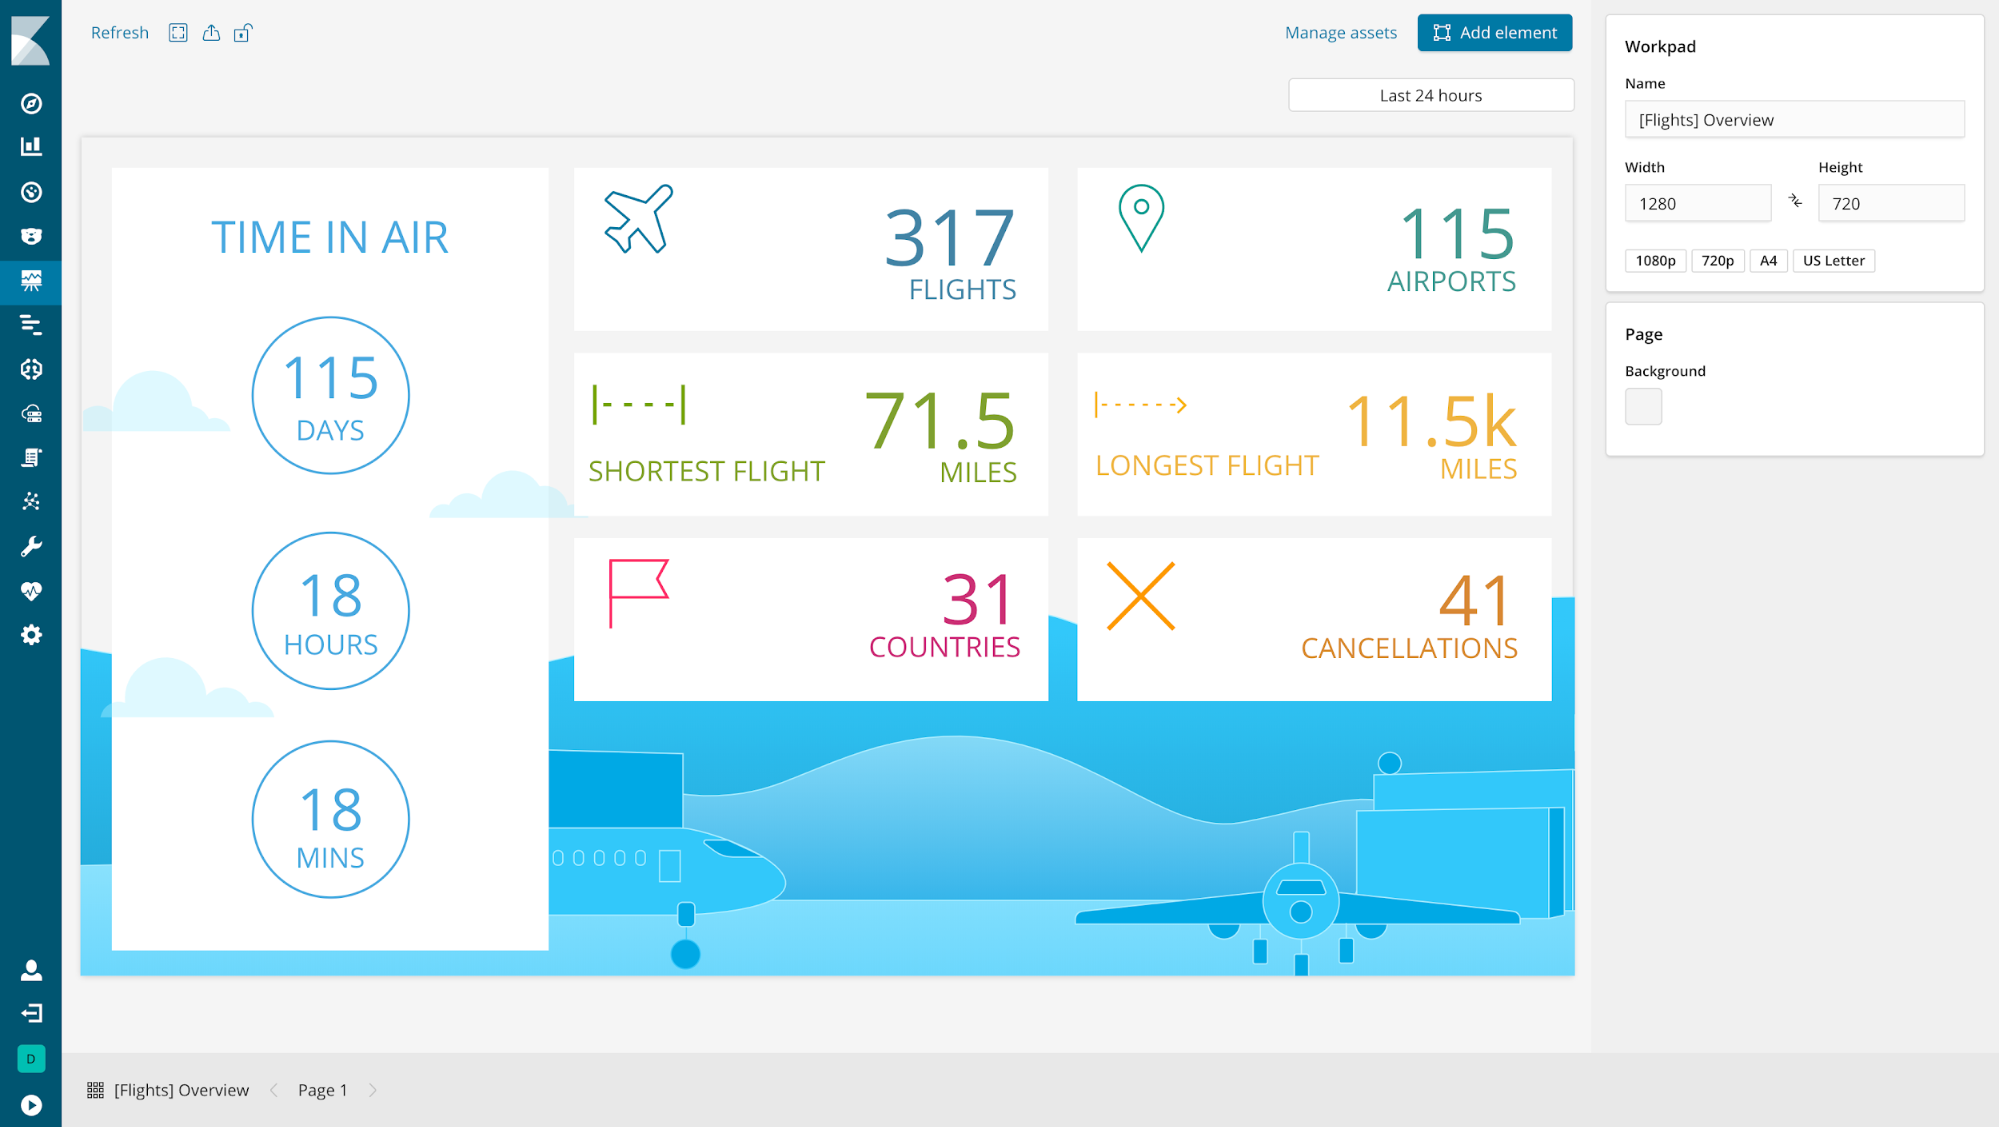
editCanvas is Kibana’s new place for showcasing your data live in a pixel-perfect design. Starting with a blank workpad, you can create a story about your data by combining static content (text, images, and shapes) with data-driven elements (charts, tables, images, and many others). Each dynamic element is connected to a sample data source by default, so you can experiment with it before connecting to your own data. Canvas supports multiple languages for querying Elasticsearch: es docs, SQL, and Timelion syntax.
Canvas tools have rich styling capabilities, allowing users to change colors and styles of both static and dynamic elements. Canvas is designed so you can tweak an element’s content and style using the UI, or go deeper and edit the expressions that create the element or the css styling. In short, Canvas gives you everything you need to showcase your live data, your way.
Create and manage rollup jobs
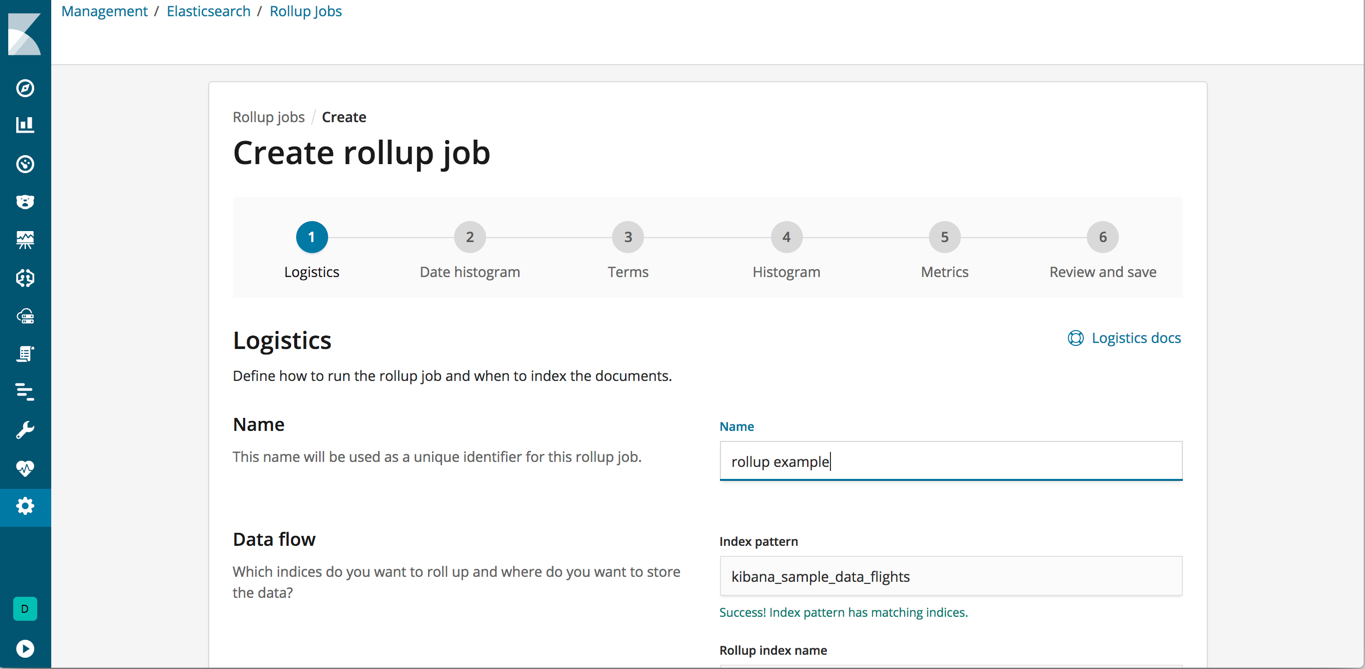
editKibana has a new Rollup UI for creating, starting, stopping, and deleting rollup jobs. Rollups is a recent addition to Elasticsearch and APIs for creating and managing rollups have been available since 6.4. A rollup index summarizes historical data and stores it compactly for future analysis, so you can query, aggregate, and visualize this data using a fraction of the storage. A rollup job is a periodic task that aggregates the data for the rollup index. To navigate to the UI, go to Management, and under Elasticsearch, click Rollup Jobs.
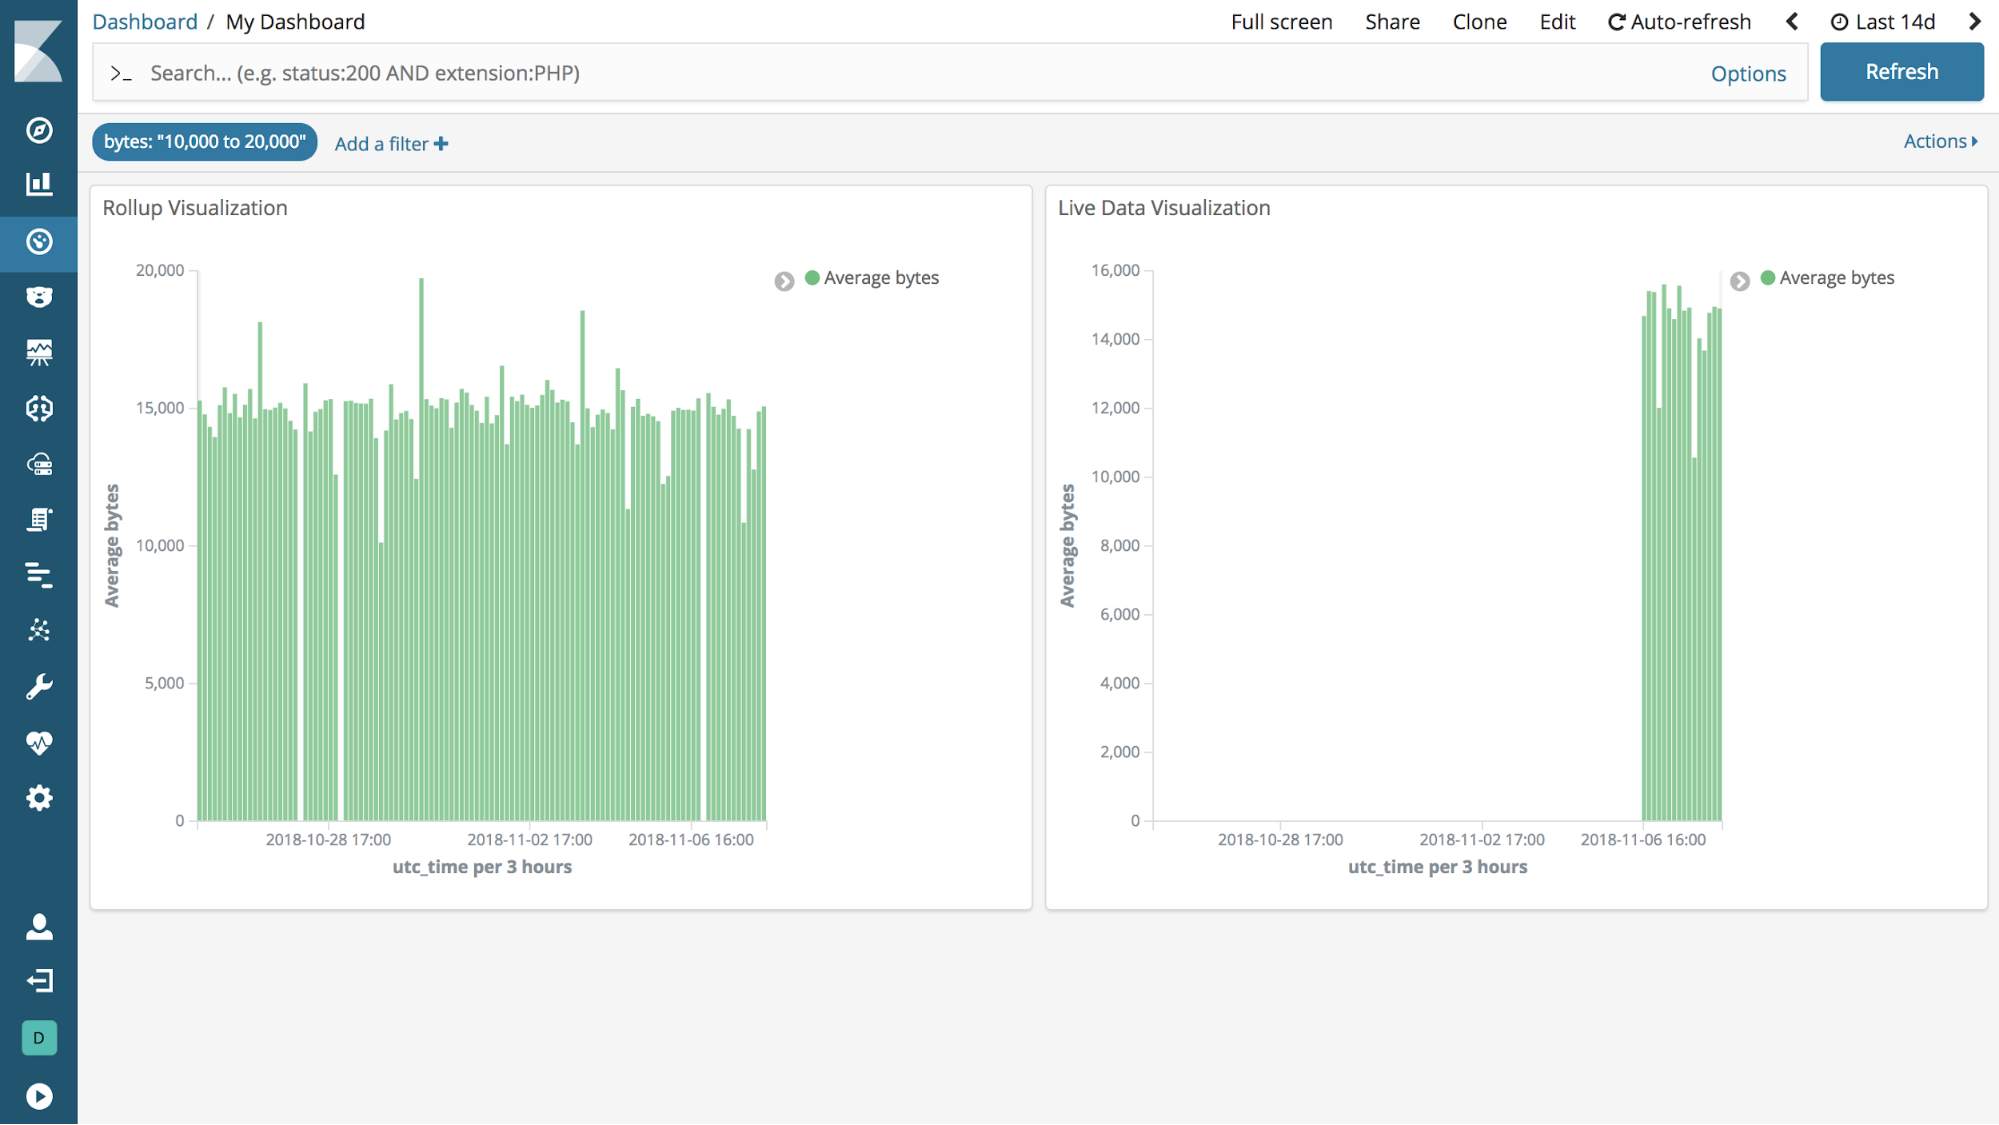
View rolled up data in visualizations (beta*)
editKibana now has beta features for visualizing rolled up data. You can create index patterns that use rollup indices or mix rollup and raw indices to visualize all data together. Most visualizations support rolled up data, with the exception of Timelion, Visual Builder, and Vega visualizations. You can also create dashboards that use visualizations based on rolled up and raw data. Finally, both rolled up and raw data are available in Discover.
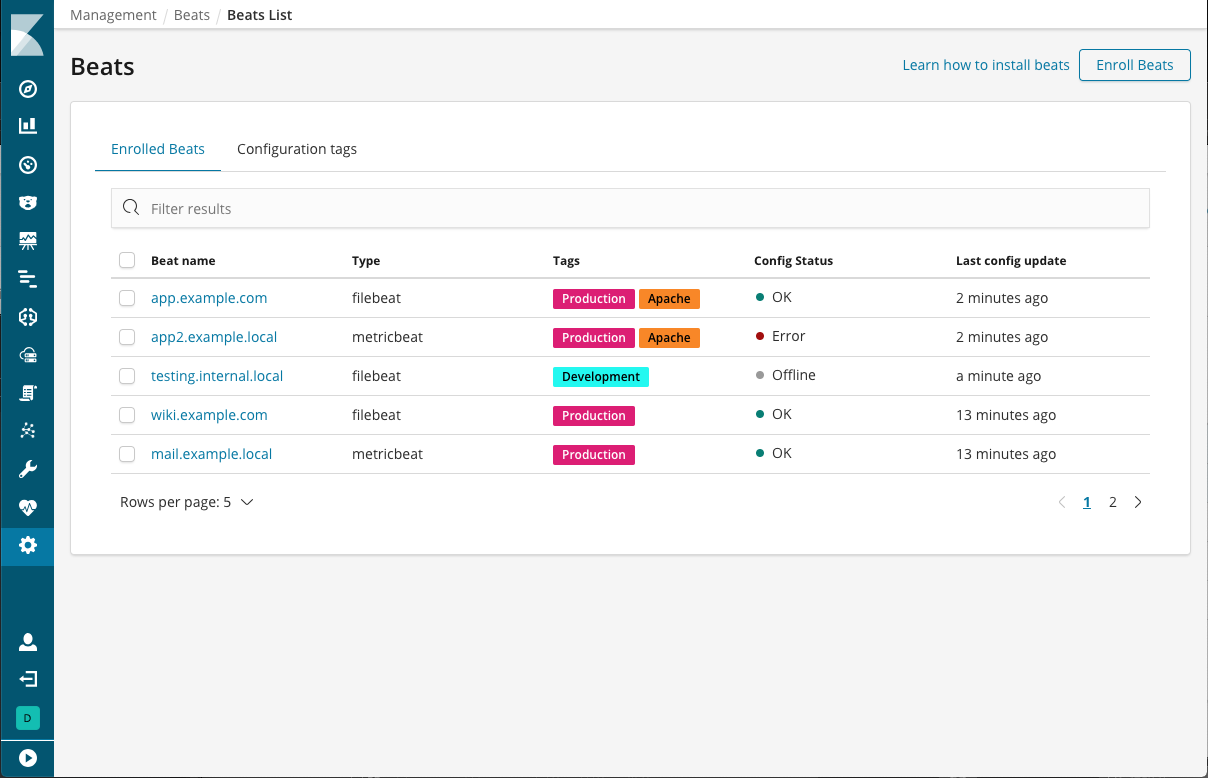
Manage your Beats in a central location (beta*)
editThe Beats management UI is your one-stop shop for centrally managing your Beats deployments. This new UI saves you time because you no longer have to log onto the machine where the Beat is deployed to conduct configuration updates. From the UI, you can manage the enrollment of multiple Beats and update their configurations as a fleet. You must have security enabled to access the Beats UI. This feature is initially only available for Filebeat and Metricbeat.
Monitor and manage your infrastructure (beta*)
editKibana has two new beta features for logging and metrics use cases, Infrastructure and Logs, both available from the side navigation. With Infrastructure, you can explore infrastructure metrics and logs for common servers, containers, and services.
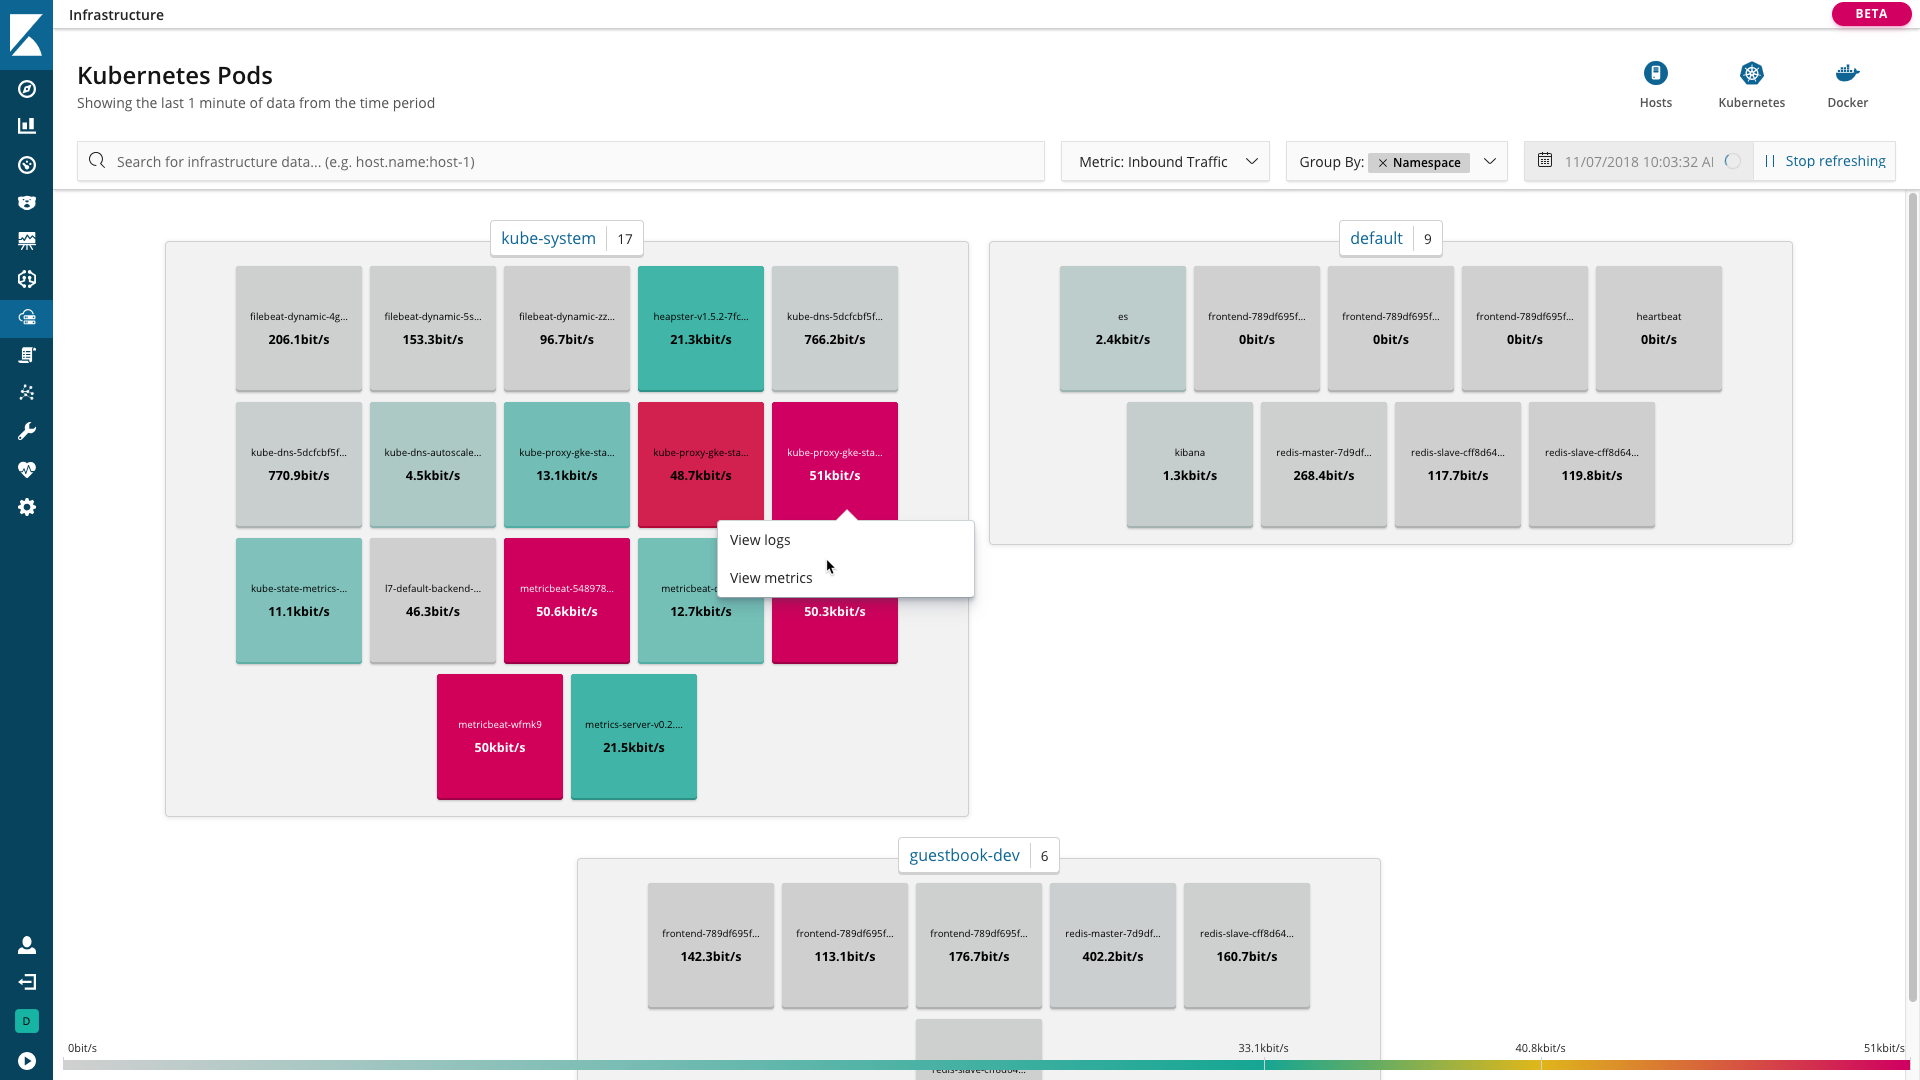
Using Logs, you can stream logs in real time or scroll through historical views in a console-like experience
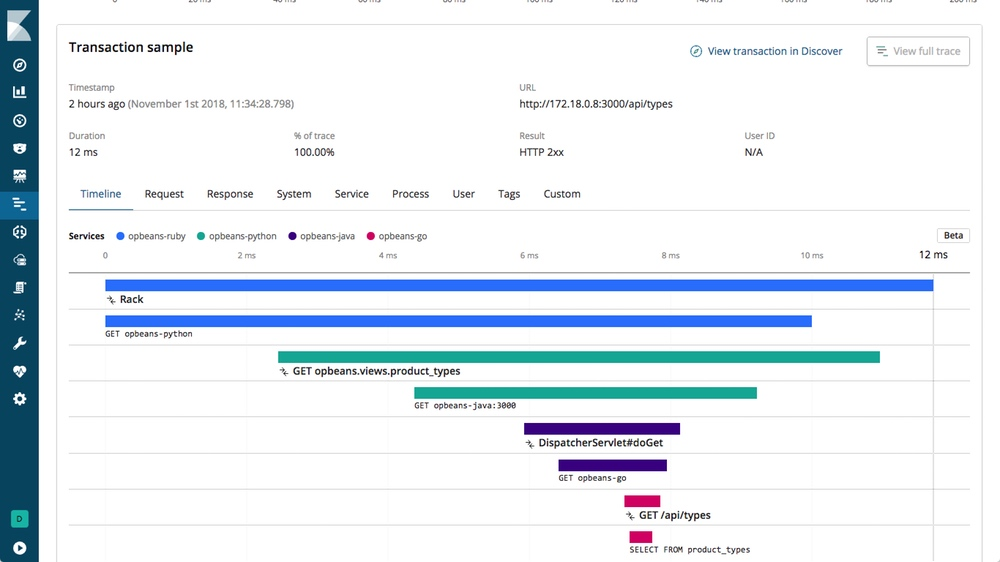
Distributed tracing in APM (beta*)
editThe APM UI now supports distributed tracing as a beta feature in 6.5. Distributed tracing enables you to analyze and view performance throughout your microservices architecture by tracing all requests. These requests range from the initial web request to your frontend service to queries made to your backend services. This gives you a trace of how your services interact with one another and enables you to pinpoint bottlenecks faster.
Get started with two new sample data sets
editKibana has two new, one-click sample data sets tailored to the new user experience. If you’re interested in business analytics, install the eCommerce data set, which has visualizations for product-related information, such as cost, revenue, and price. If you’re looking to analyze website traffic, check out the web logs sample data set. To access the sample data, go to the Kibana home page and click Load a data set and a Kibana dashboard.
Each sample is prepackaged with a dashboard and a Canvas workpad. The workpad for the eCommerce sample includes two different styles for the same data. The workpads are a hands-on way for new users to learn Canvas.
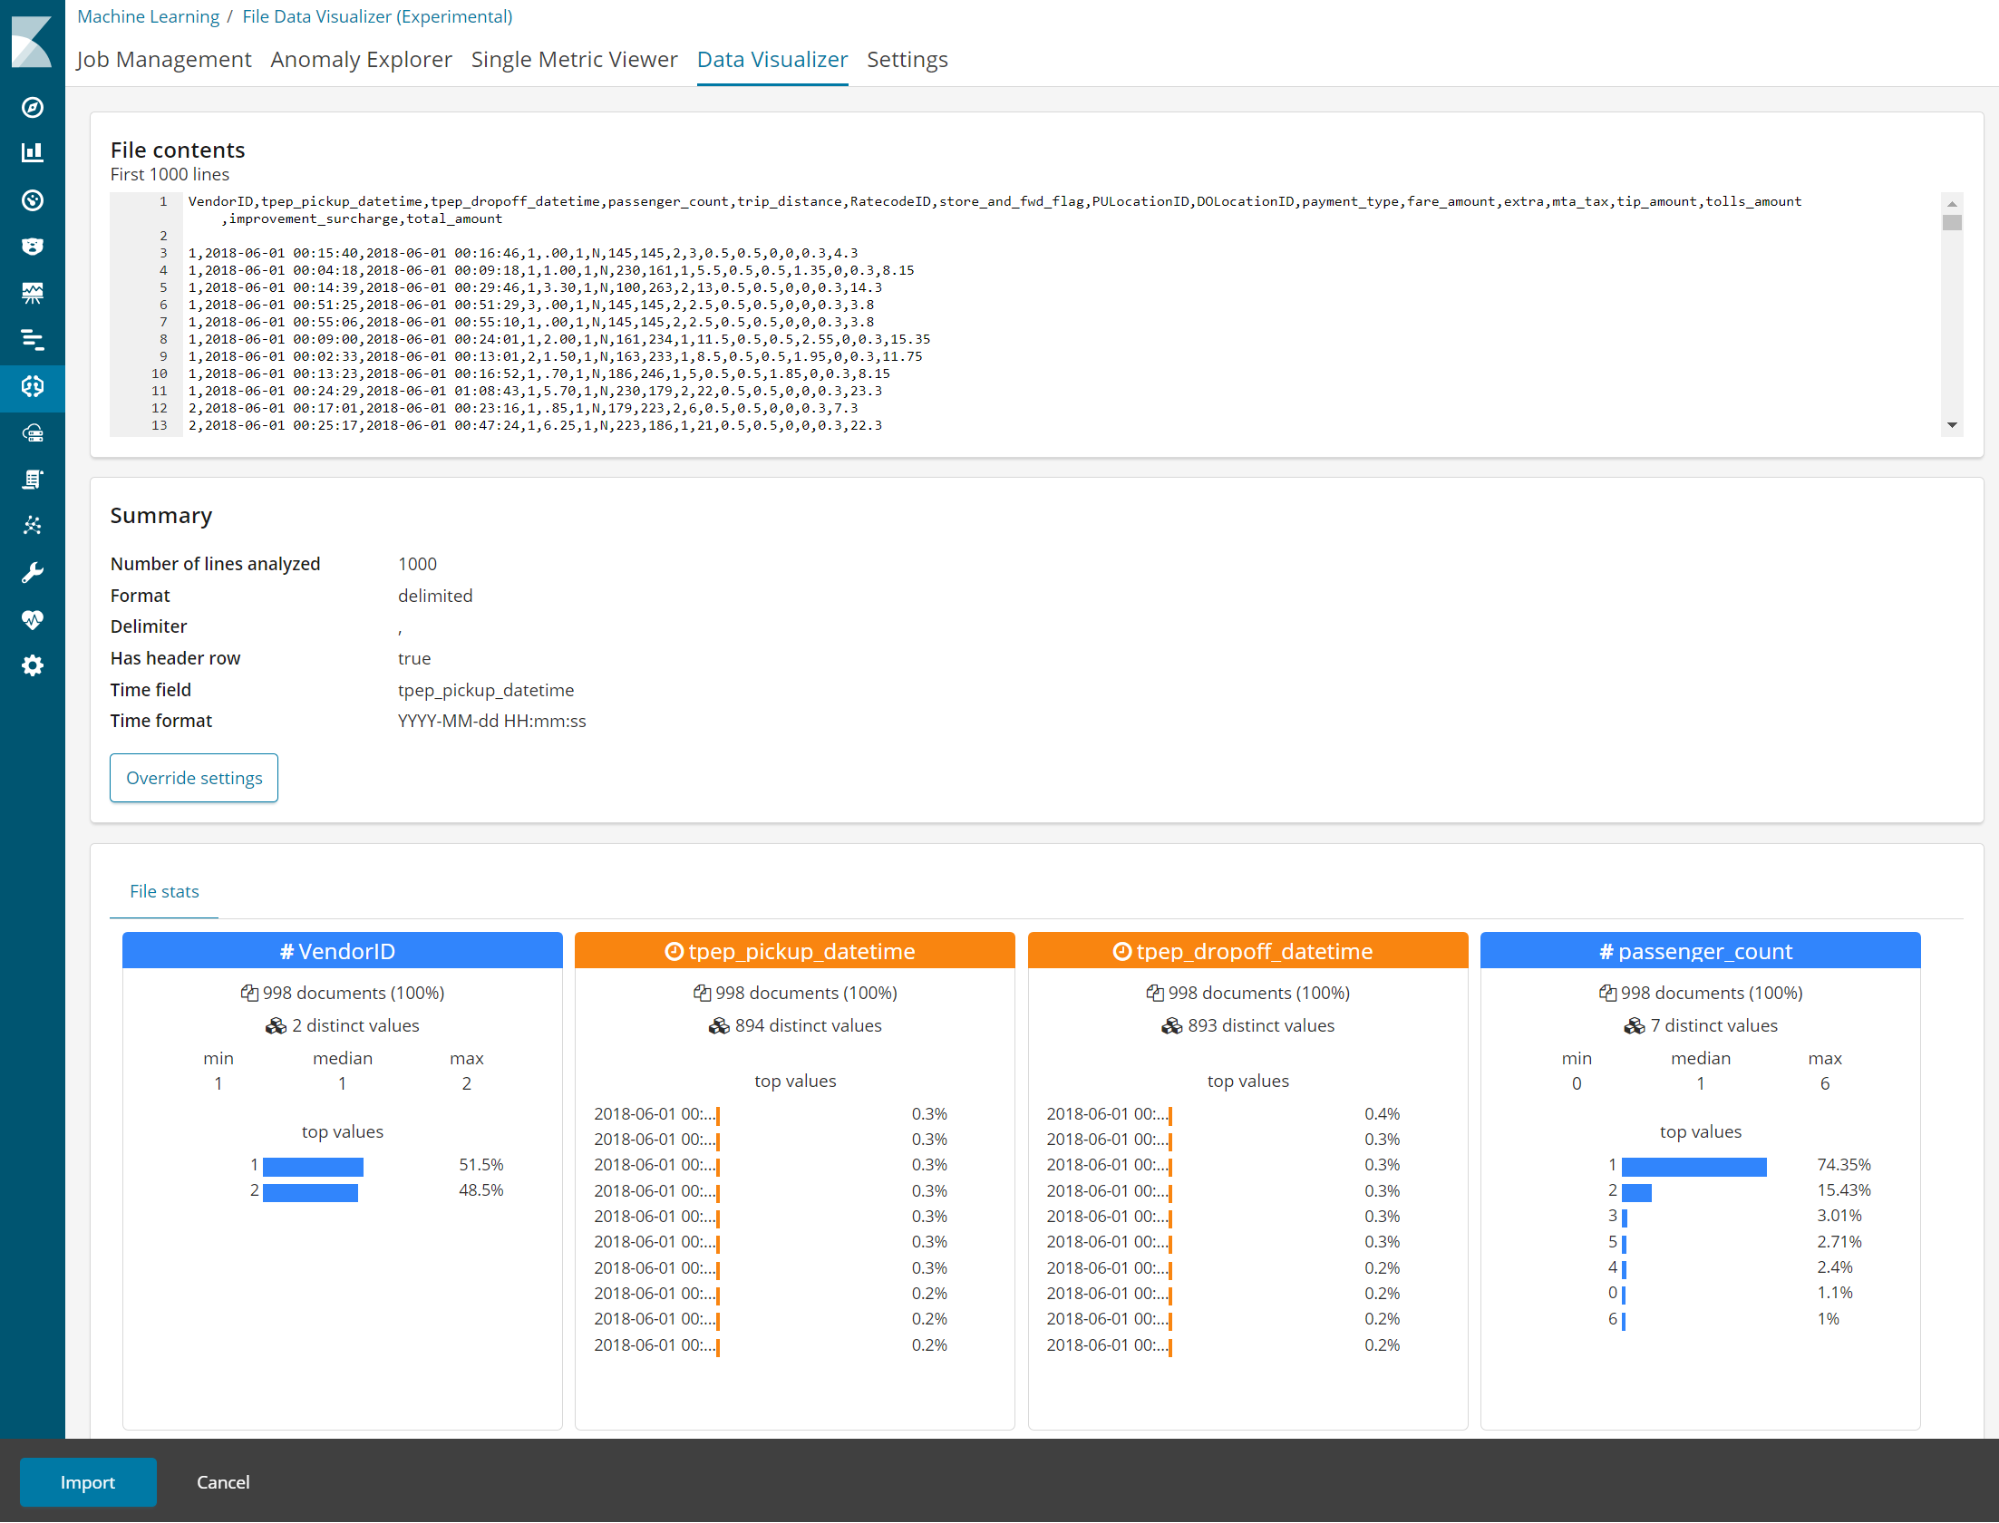
Visualize data from a log file
editMachine learning features are now available for users on a Basic license. The Data Visualizer helps you understand the metrics and fields in your data in preparation for further analysis. With the new File Data Visualizer, you can upload a CSV, NDJSON, or log file. The File Data Visualizer uses the new File Structure API to identify the file format and field mappings. You can then choose to import the data into an Elasticsearch index. The log file import feature is experimental in 6.5, and is limited to files up to 100 MB in size.
* This functionality is in beta and is subject to change. The design and code is less mature than official GA features and is being provided as-is with no warranties. Please try this functionality in your test and development environments and provide feedback in the Elastic community forums.