IMPORTANT: No additional bug fixes or documentation updates
will be released for this version. For the latest information, see the
current release documentation.
Inspecting the data
edit
IMPORTANT: This documentation is no longer updated. Refer to Elastic's version policy and the latest documentation.
Inspecting the data
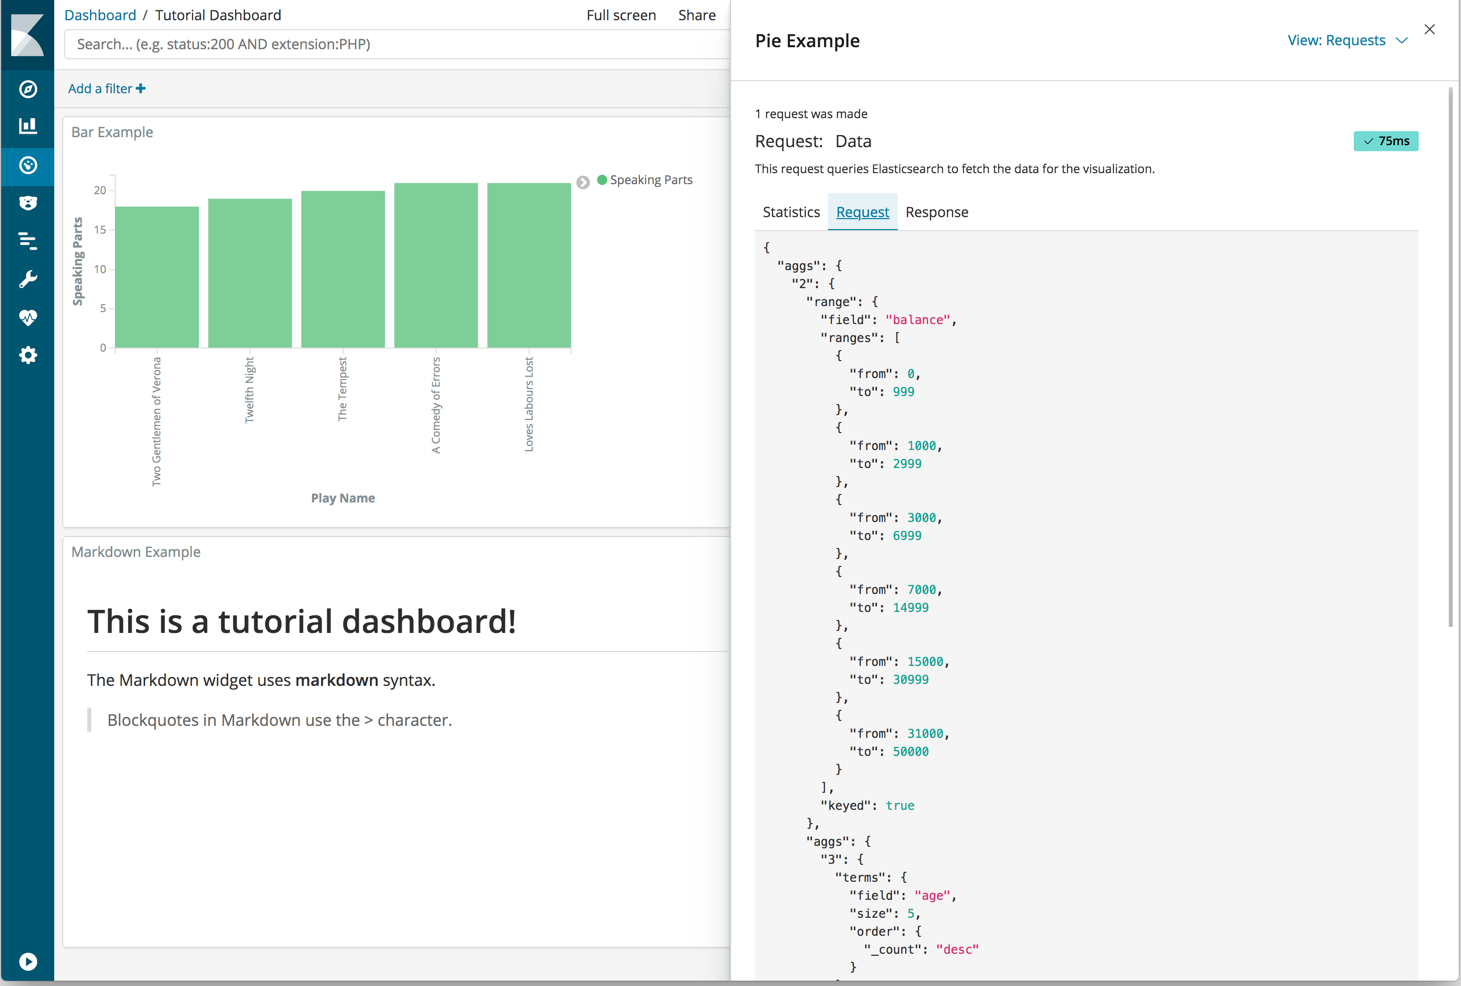
editSeeing visualizations of your data is great, but sometimes you need to look at the actual data to understand what’s really going on. You can inspect the data behind any visualization and view the Elasticsearch query used to retrieve it.
- In the dashboard, hover the pointer over the pie chart.
- Click the icon in the upper right.
-
From the Options menu, select Inspect.
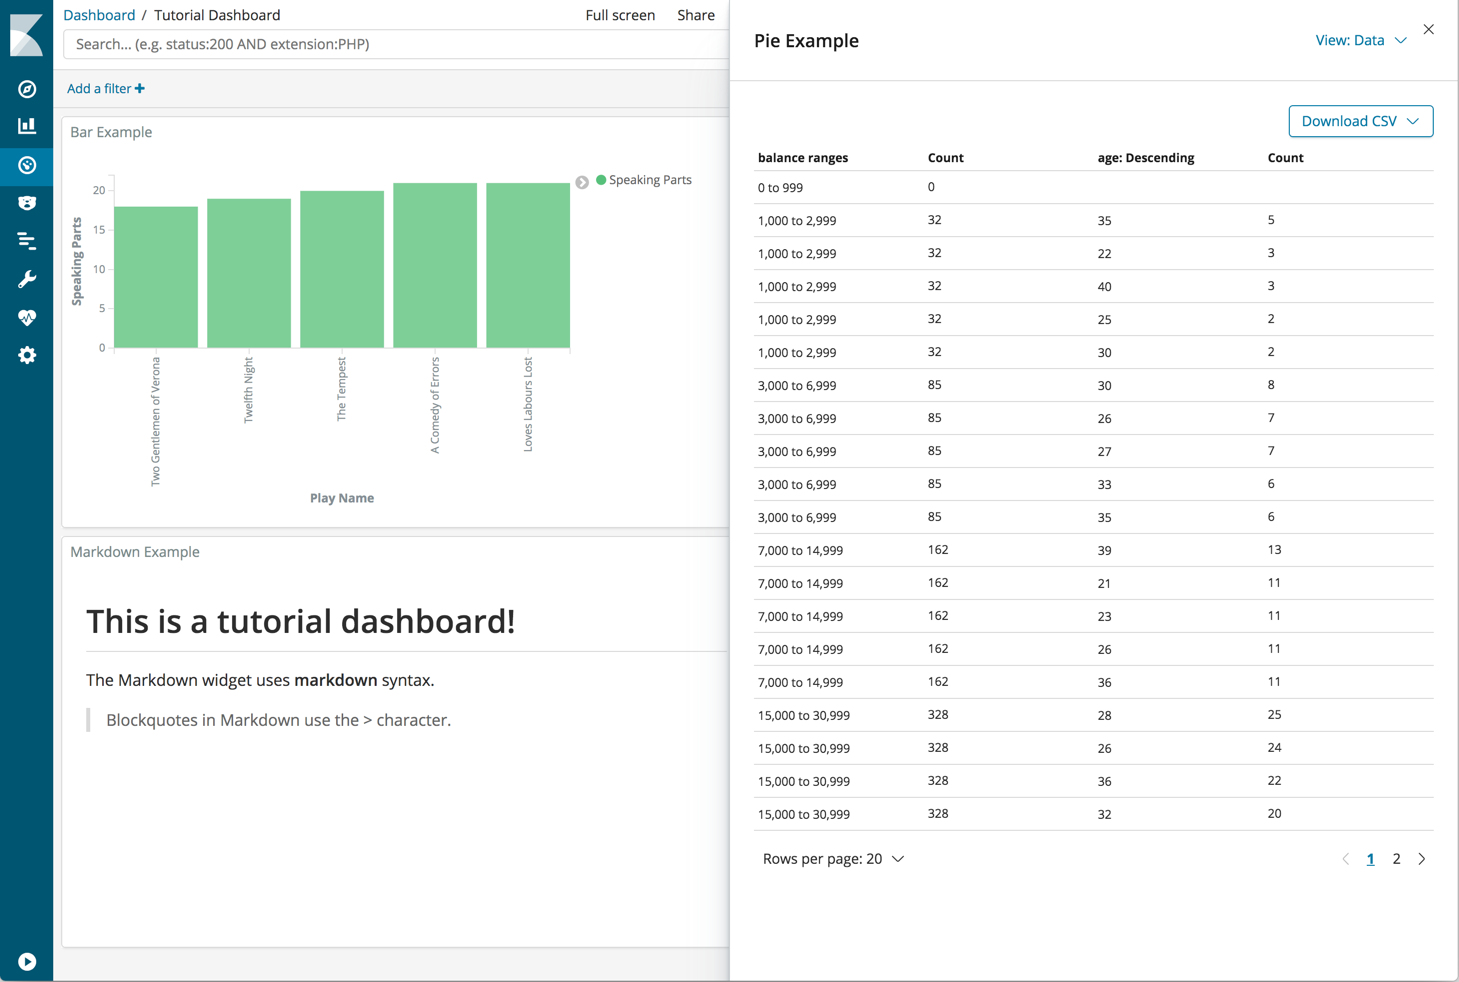
You can also look at the query used to fetch the data for the visualization.
- Open the View:Data menu and select Requests.
- Click the tabs to look at the request statistics, the Elasticsearch request, and the response in JSON.
-
To close the Inspector, click X in the upper right.