Using conditional logic and tracking trends
editUsing conditional logic and tracking trends
editIn this section you will learn how to modify time series data with conditional logic and create a trend with a moving average. This is helpful to easily detect outliers and patterns over time.
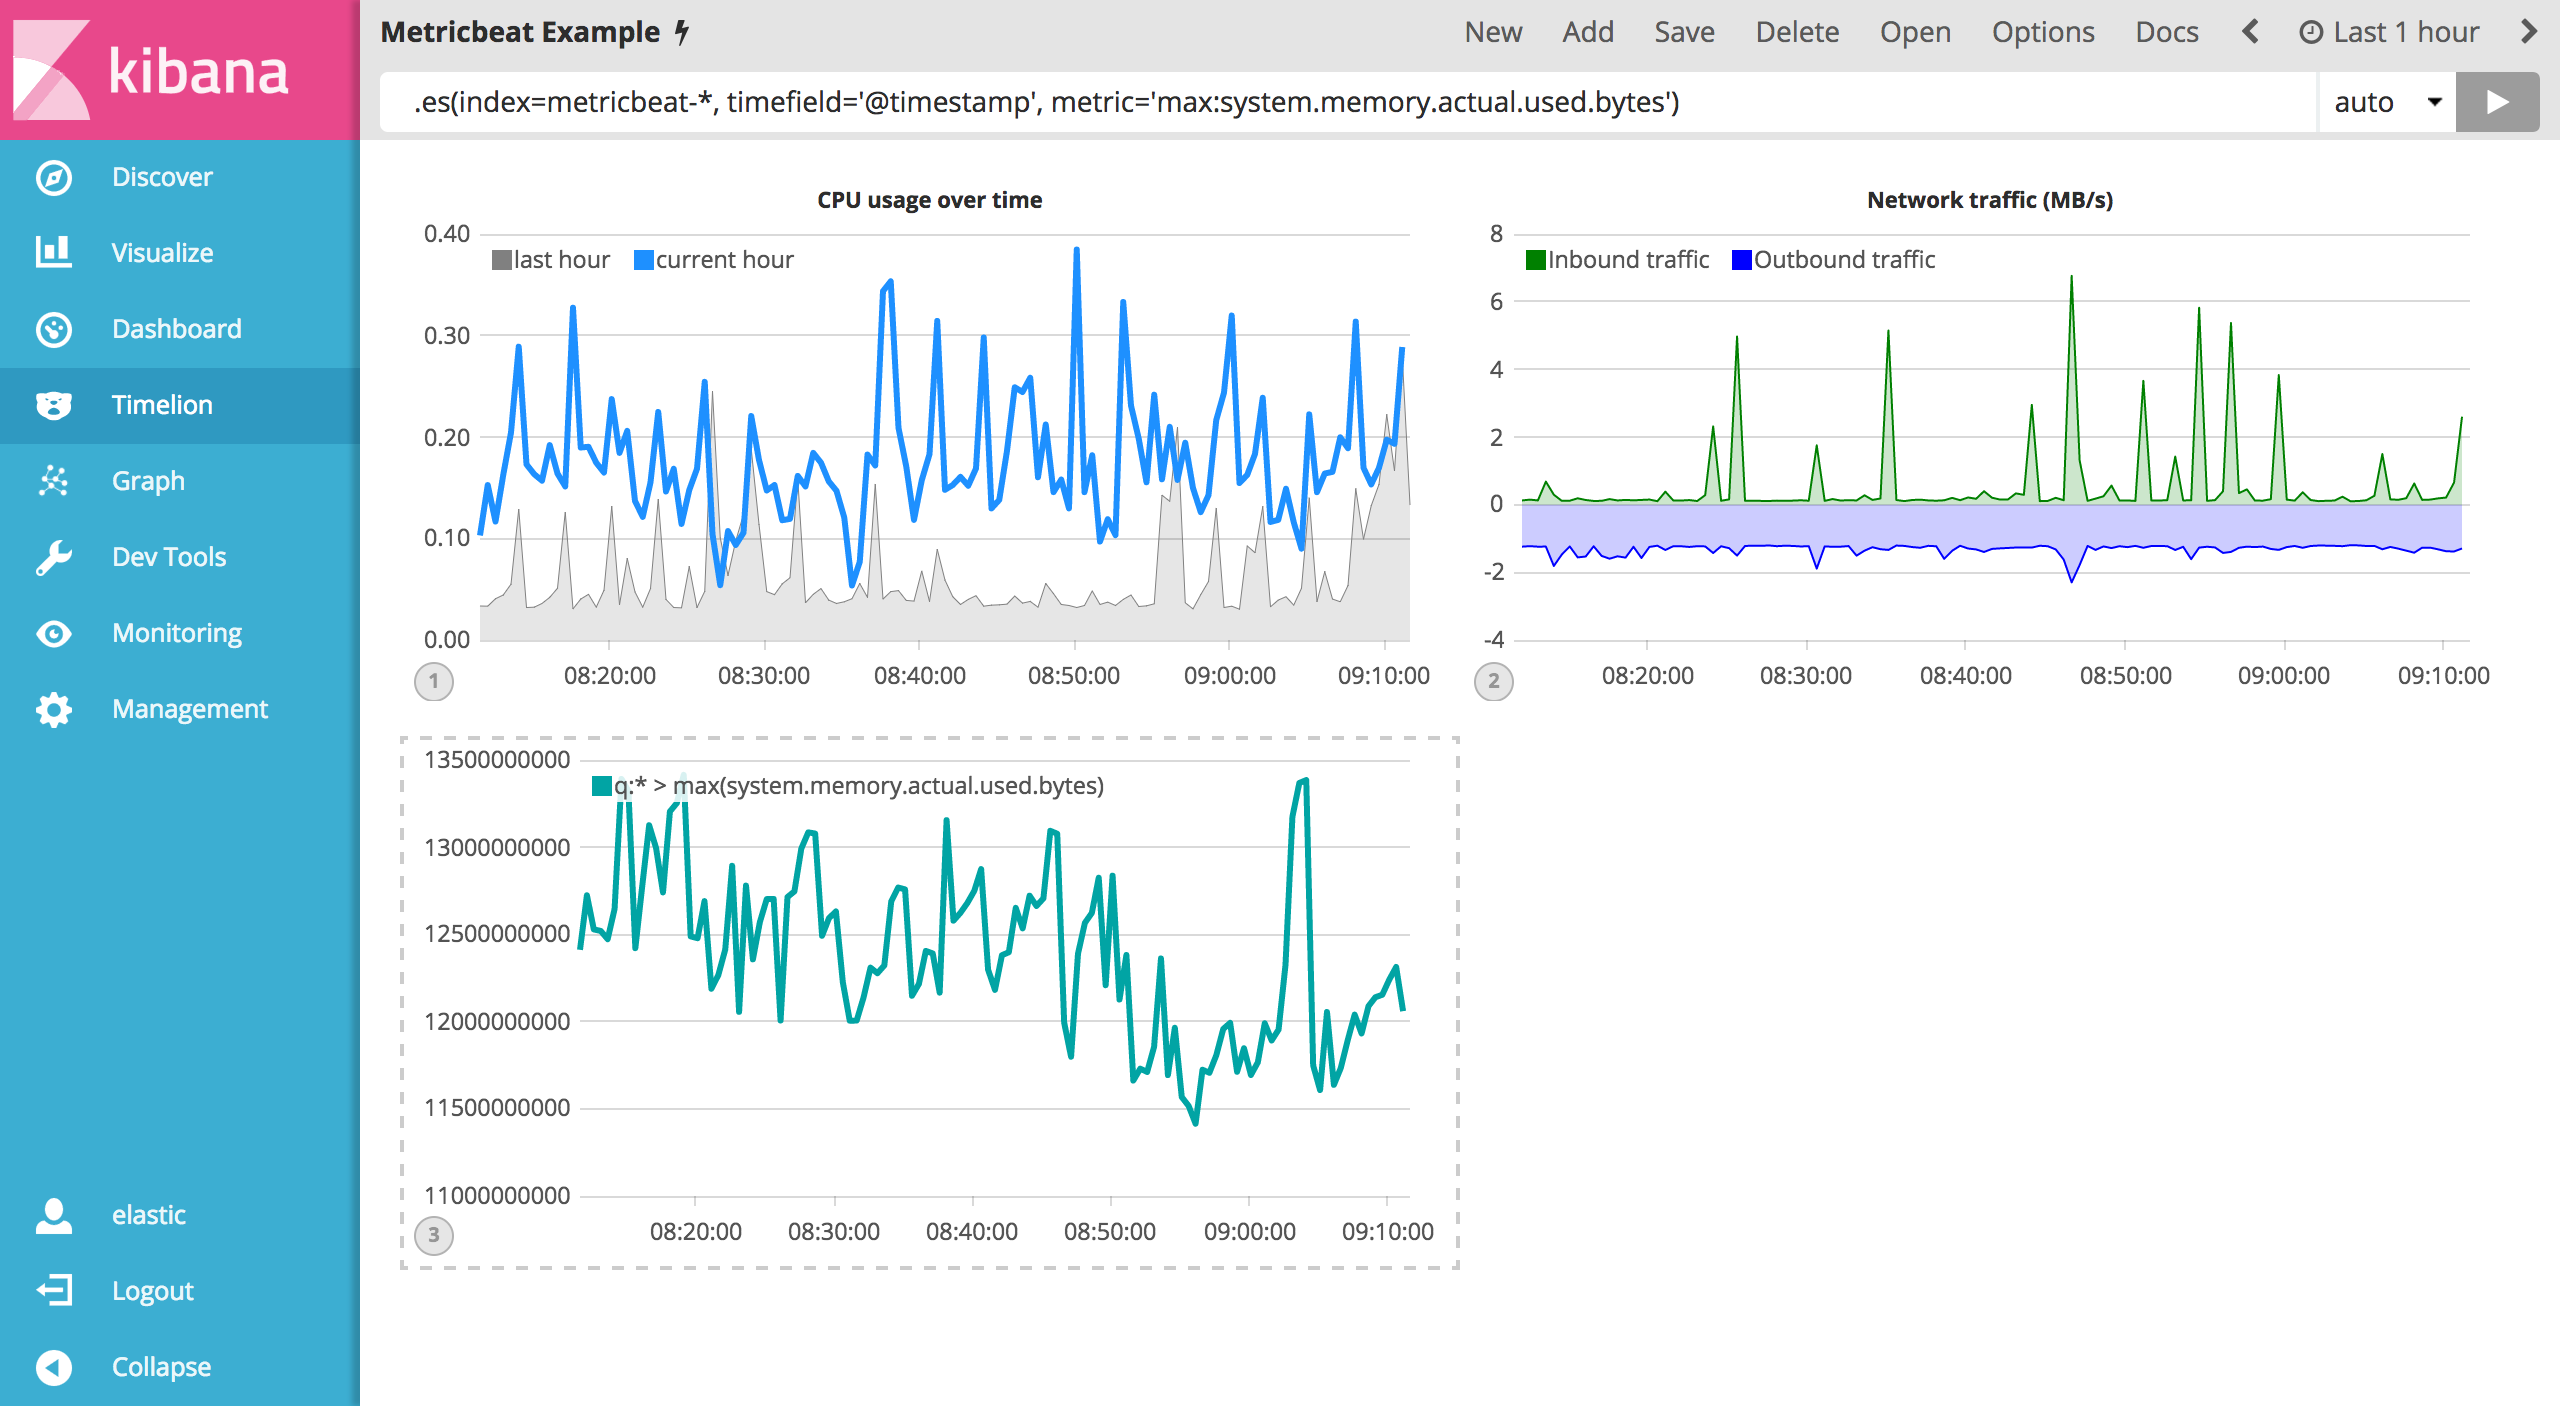
For the purposes of this tutorial, you will continue to use Metricbeat data to add another visualization that monitors memory consumption. To start, use the following expression to chart the maximum value of system.memory.actual.used.bytes.
.es(index=metricbeat-*, timefield='@timestamp', metric='max:system.memory.actual.used.bytes')
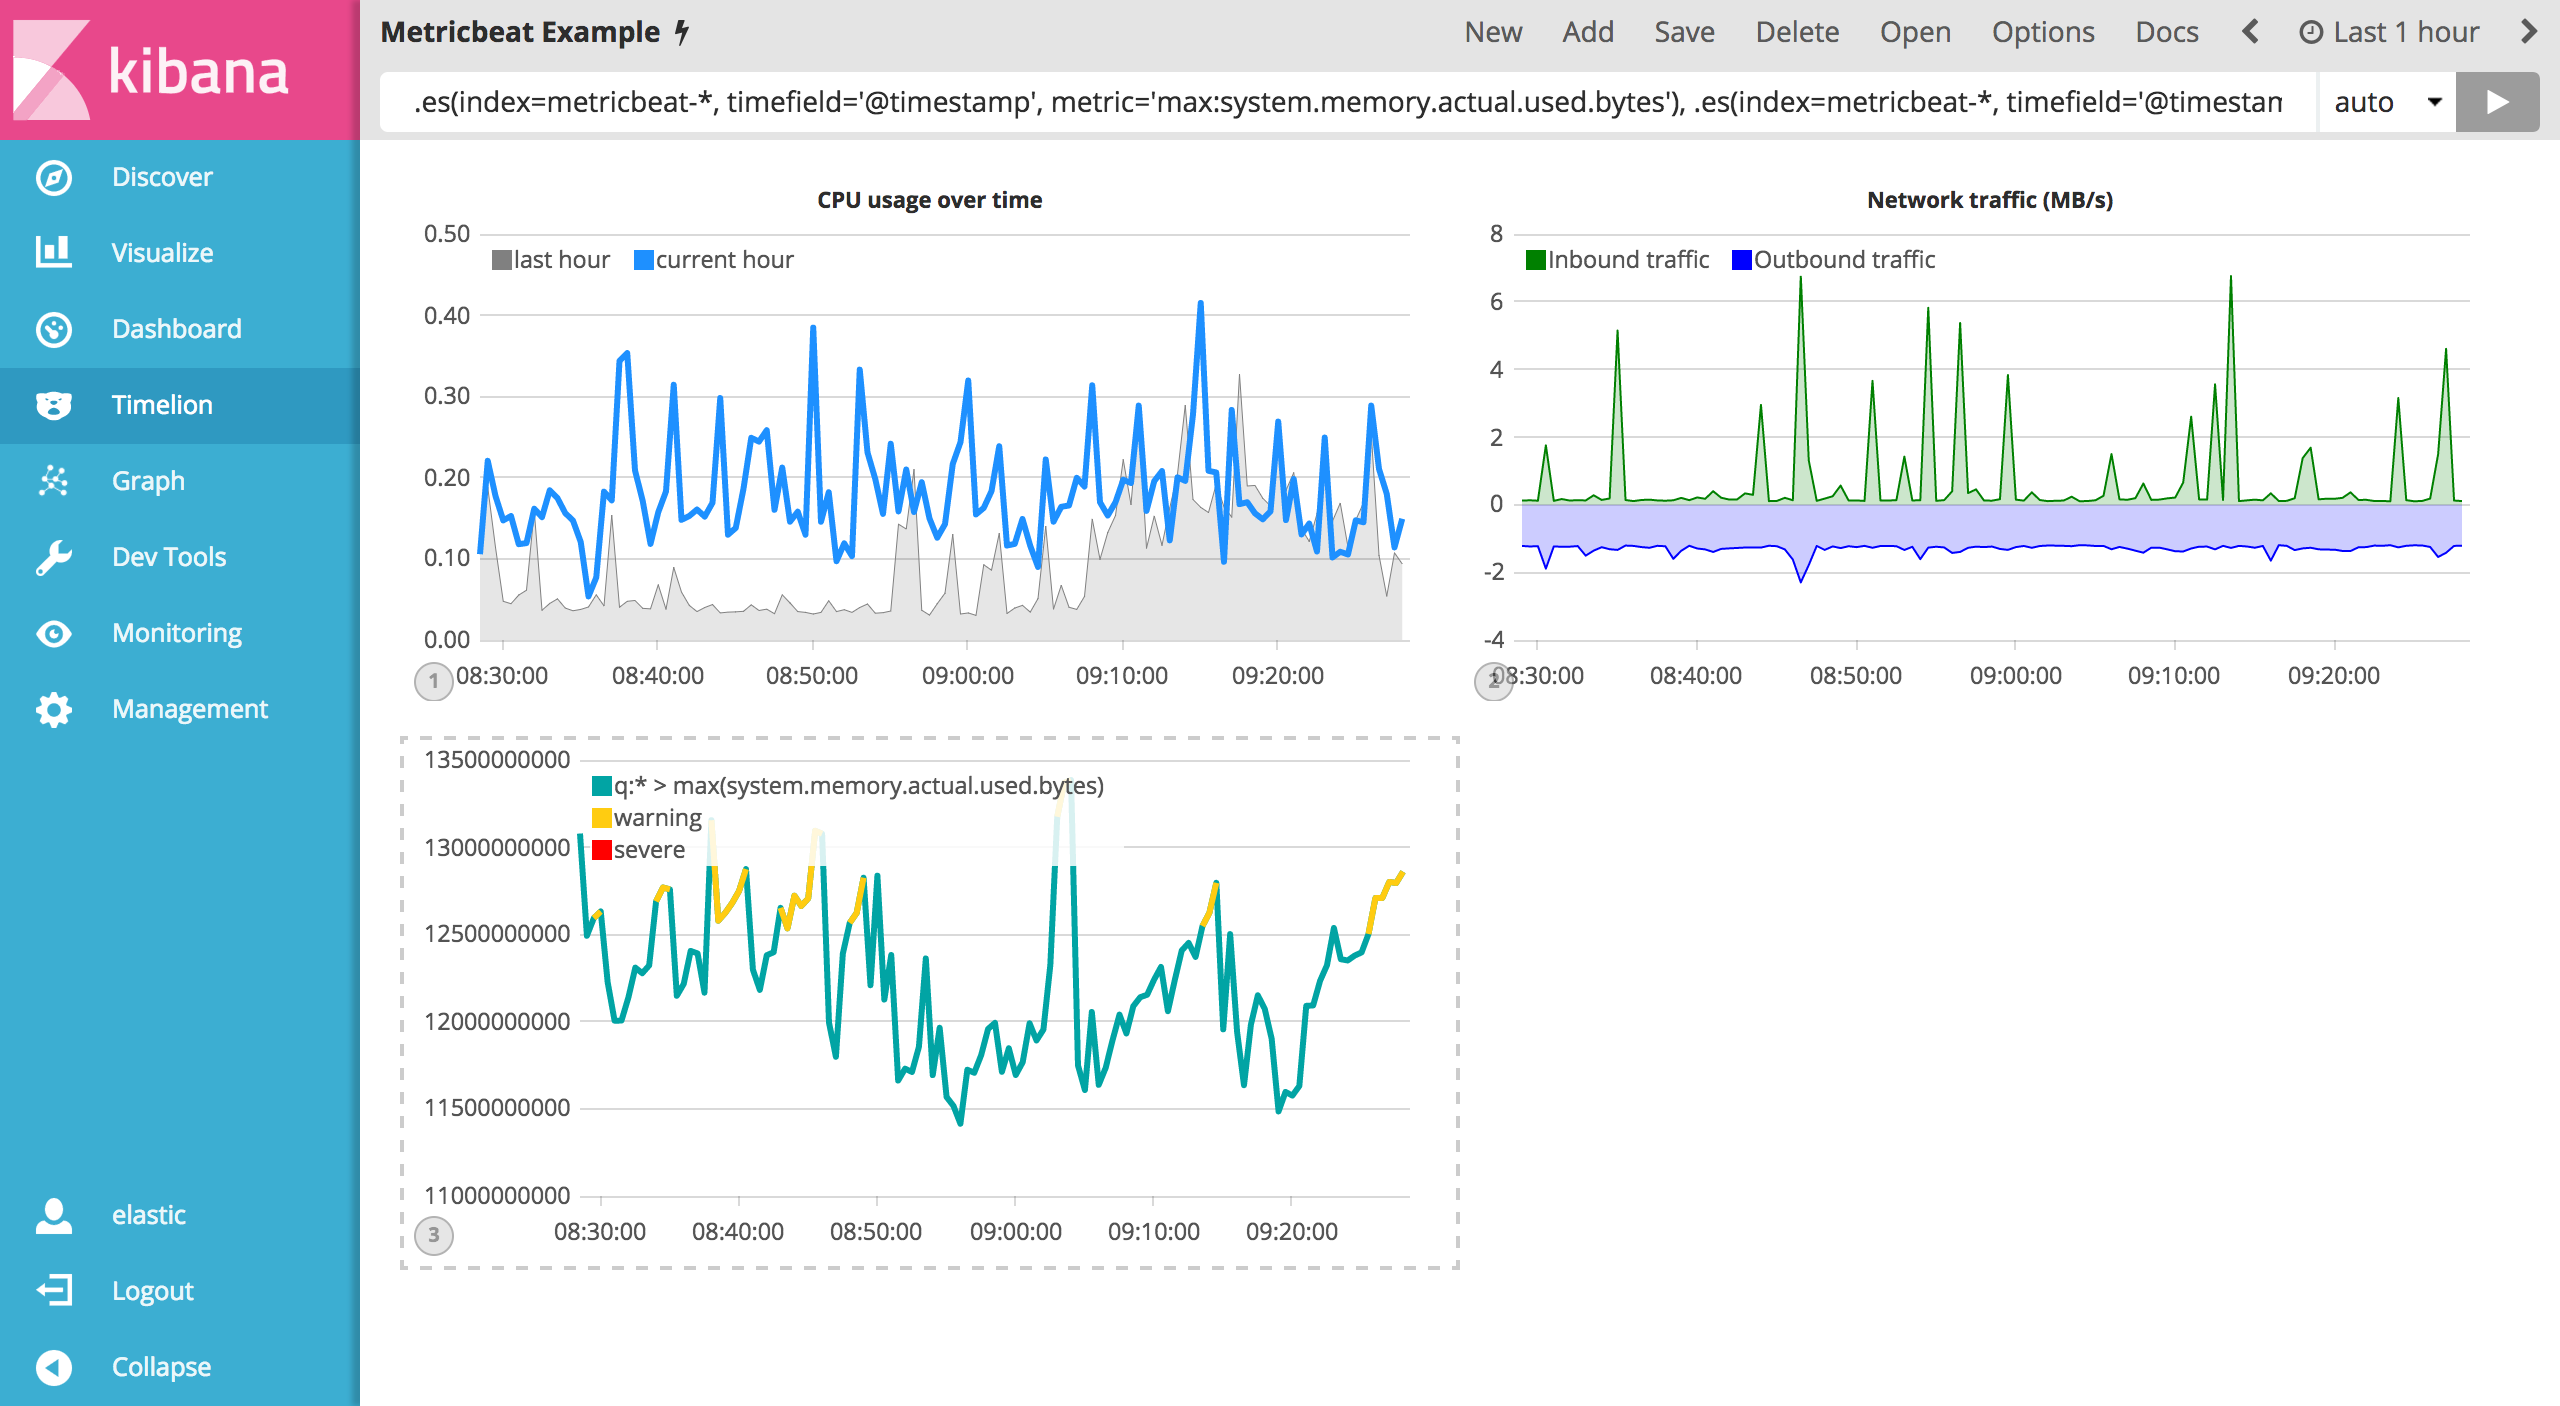
Let’s create two thresholds to keep an eye on the amount of used memory. For the purposes of this tutorial, your warning threshold will be 12.5GB and your severe threshold will be 15GB. When the maximum amount of used memory exceeds either of these thresholds, the series will be colored accordingly.
If the threshold values are too high or low for your machine, please adjust accordingly.
To configure these two threshold values, you can utilize Timelion’s conditional logic. In this tutorial you will use if() to compare each point to a number, adjust the styling if the condition evaluates to true and use the default styling if the condition evaluates to false. Timelion offers the following six operator values for comparison.
|
|
equal |
|
|
not equal |
|
|
less than |
|
|
less than or equal to |
|
|
greater than |
|
|
greater than or equal to |
Since there are two thresholds, it makes sense to style them differently. Use the gt operator to color the warning threshold yellow with .color('#FFCC11') and the severe threshold red with .color('red'). Enter the following expression into the Timelion query bar to apply the conditional logic and threshold styling:
.es(index=metricbeat-*, timefield='@timestamp', metric='max:system.memory.actual.used.bytes'), .es(index=metricbeat-*, timefield='@timestamp', metric='max:system.memory.actual.used.bytes').if(gt,12500000000,.es(index=metricbeat-*, timefield='@timestamp', metric='max:system.memory.actual.used.bytes'),null).label('warning').color('#FFCC11'), .es(index=metricbeat-*, timefield='@timestamp', metric='max:system.memory.actual.used.bytes').if(gt,15000000000,.es(index=metricbeat-*, timefield='@timestamp', metric='max:system.memory.actual.used.bytes'),null).label('severe').color('red')
For additional information on Timelions conditional capabilities, check out the blog post I have but one .condition().
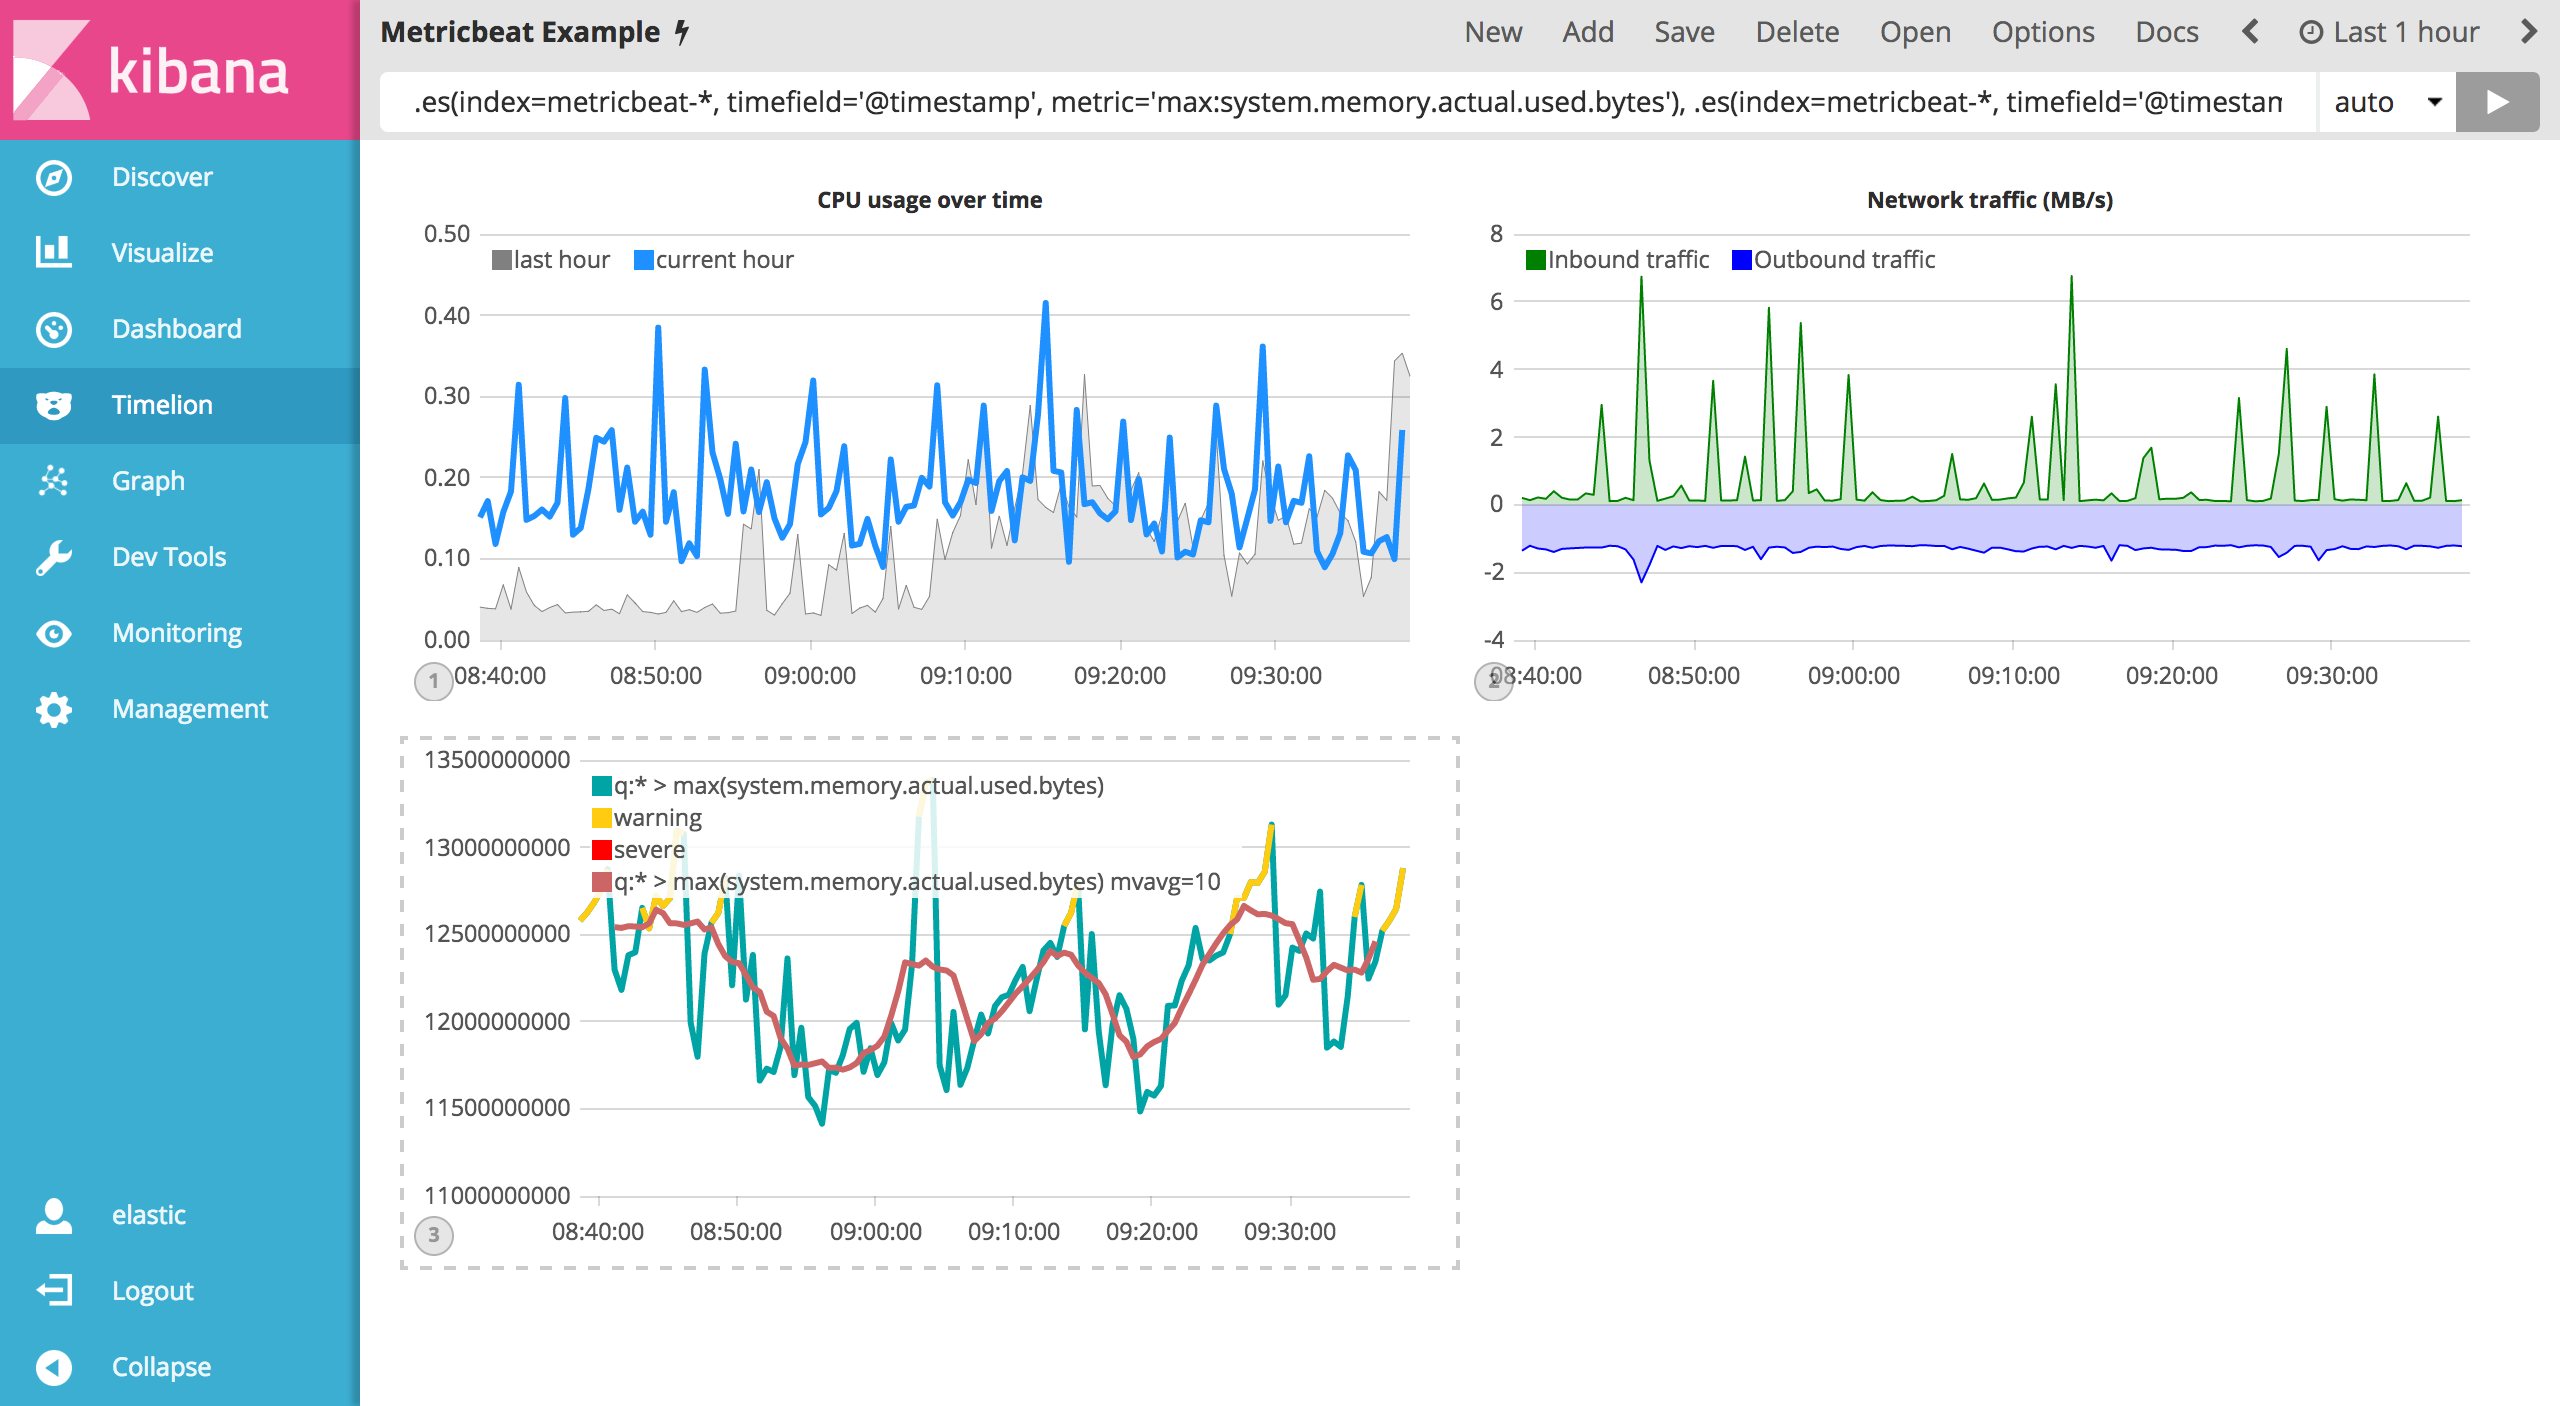
Now that you have thresholds defined to easily identify outliers, let’s create a new series to determine what the trend really is. Timelion’s mvavg() function allows you to calculate the moving average over a given window. This is especially helpful for noisy time series. For this tutorial, you will use .mvavg(10) to create a moving average with a window of 10 data points. Use the following expression to create a moving average of the maximum memory usage:
.es(index=metricbeat-*, timefield='@timestamp', metric='max:system.memory.actual.used.bytes'), .es(index=metricbeat-*, timefield='@timestamp', metric='max:system.memory.actual.used.bytes').if(gt,12500000000,.es(index=metricbeat-*, timefield='@timestamp', metric='max:system.memory.actual.used.bytes'),null).label('warning').color('#FFCC11'), .es(index=metricbeat-*, timefield='@timestamp', metric='max:system.memory.actual.used.bytes').if(gt,15000000000,.es(index=metricbeat-*, timefield='@timestamp', metric='max:system.memory.actual.used.bytes'),null).label('severe').color('red'), .es(index=metricbeat-*, timefield='@timestamp', metric='max:system.memory.actual.used.bytes').mvavg(10)
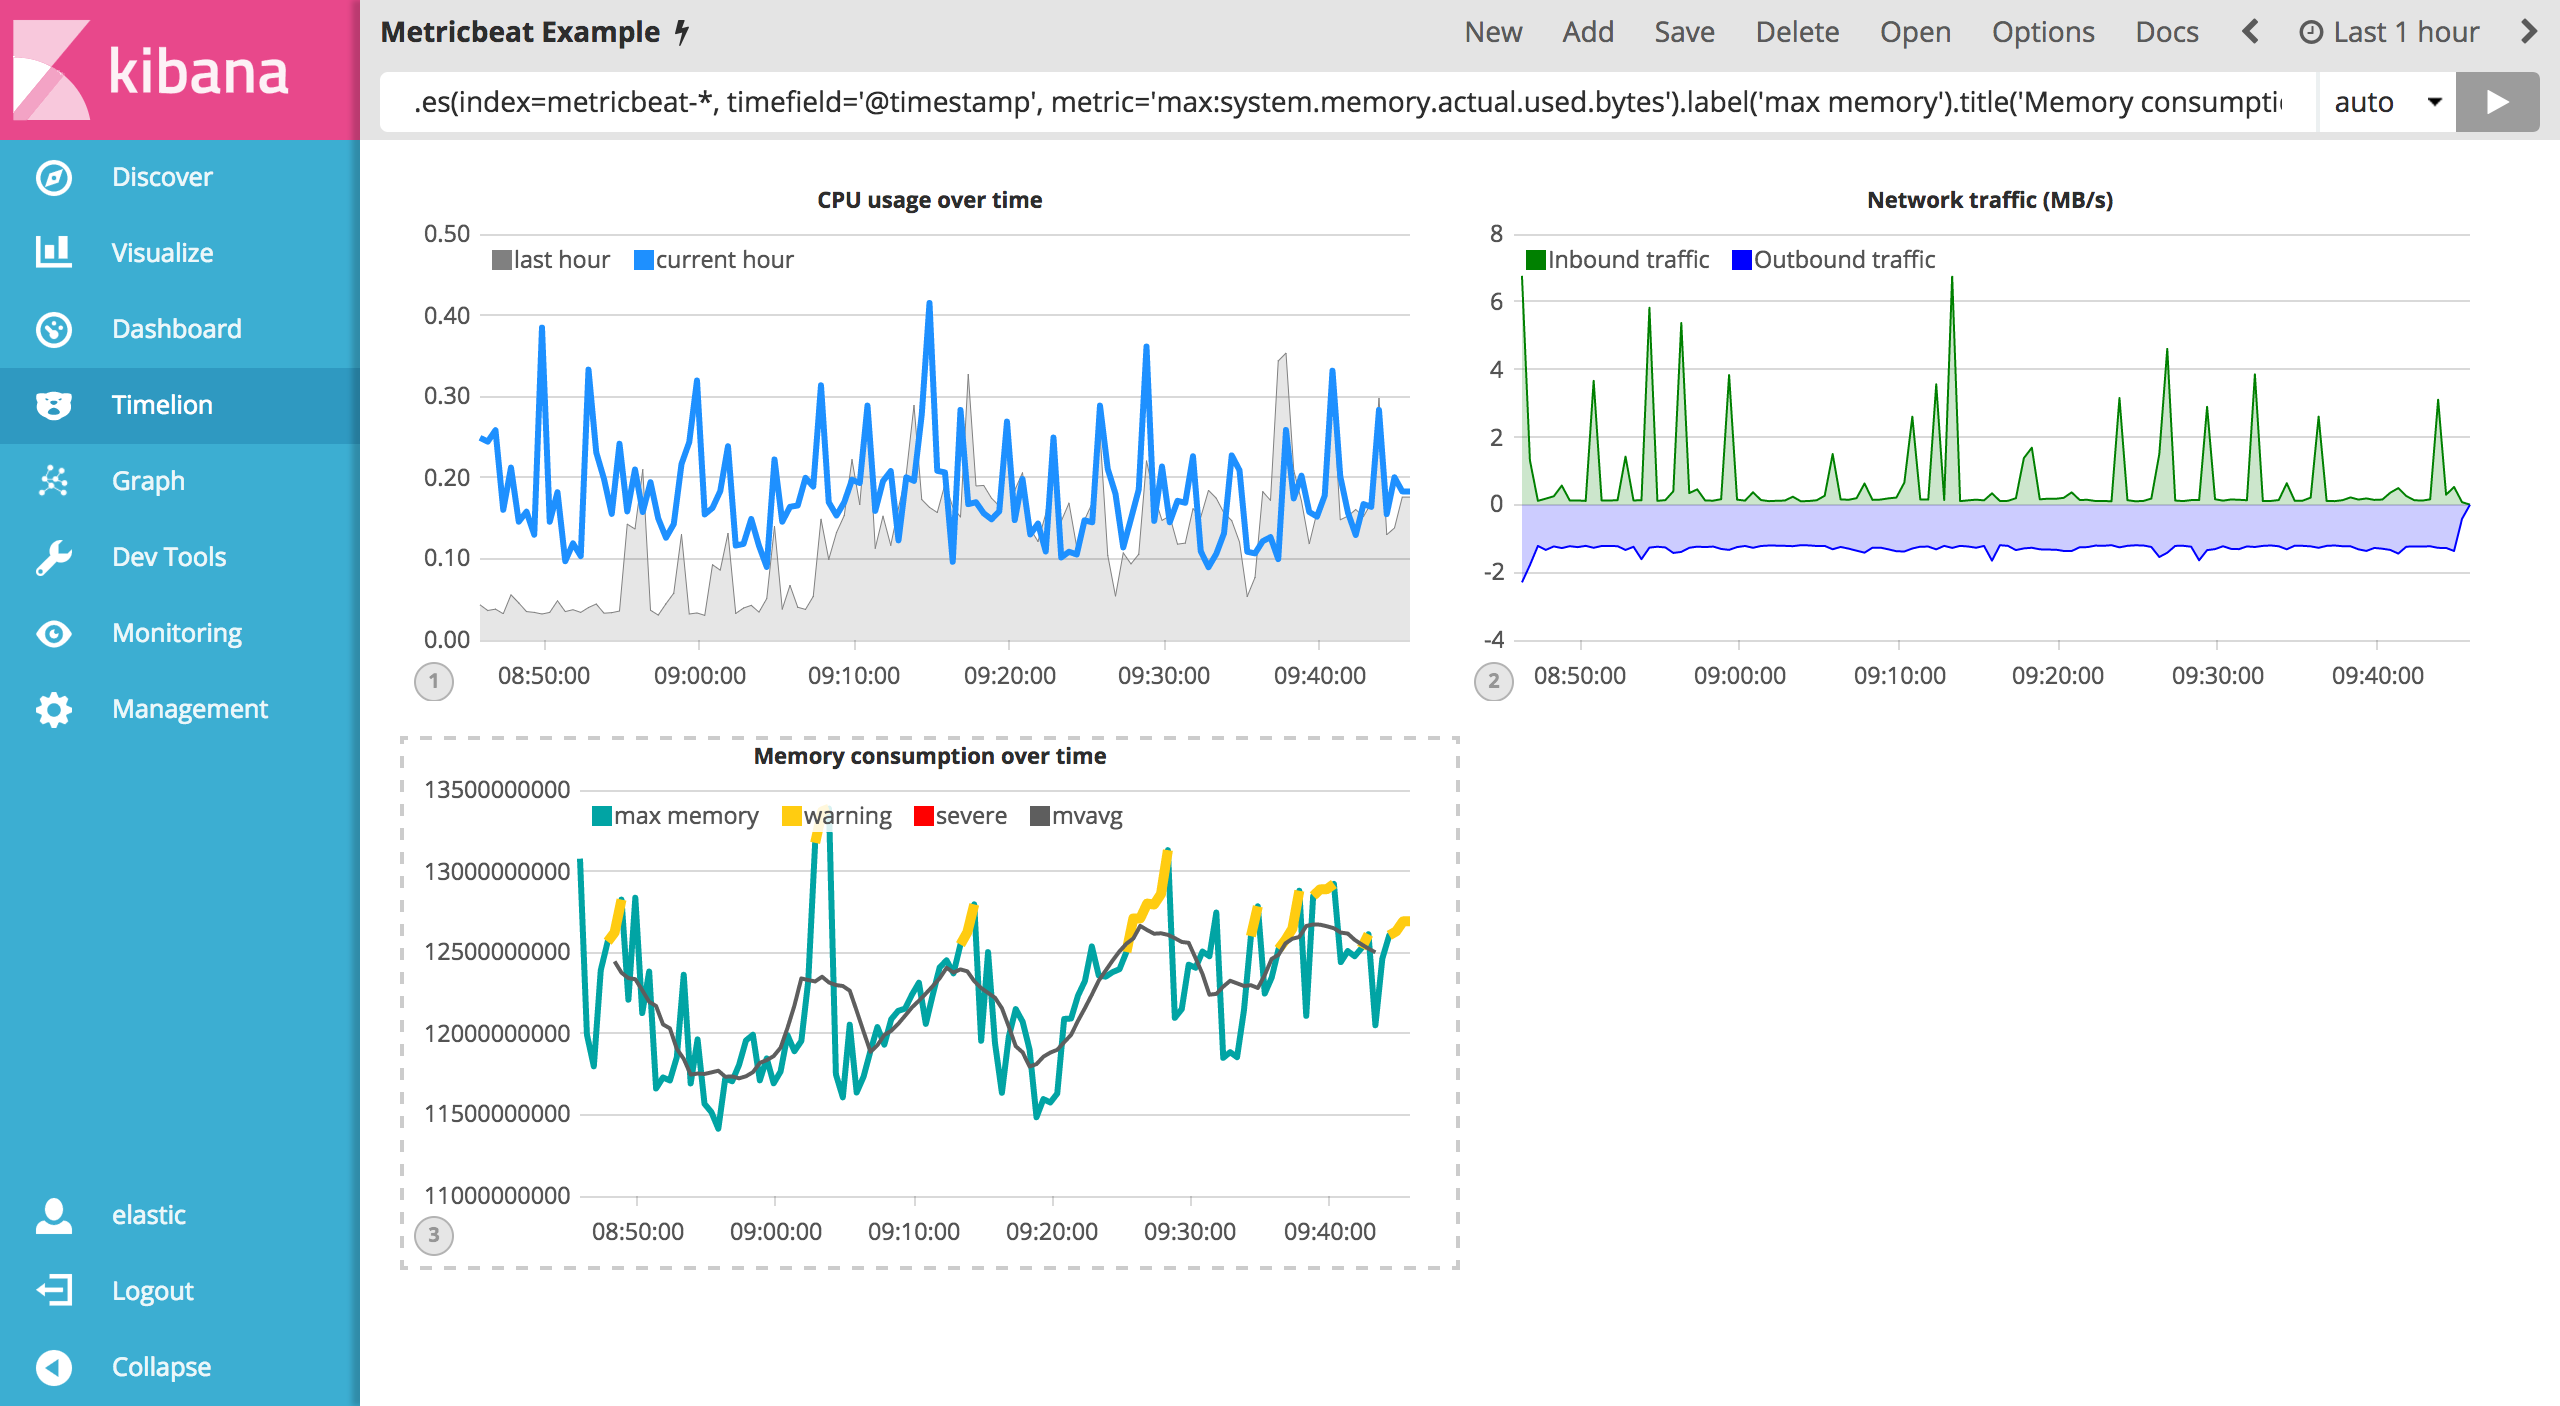
Now that you have thresholds and a moving average, let’s format the visualization so it is a bit easier to consume. As with the last section, use the .color(), .line(), .title() and .legend() functions to update your visualization accordingly:
.es(index=metricbeat-*, timefield='@timestamp', metric='max:system.memory.actual.used.bytes').label('max memory').title('Memory consumption over time'), .es(index=metricbeat-*, timefield='@timestamp', metric='max:system.memory.actual.used.bytes').if(gt,12500000000,.es(index=metricbeat-*, timefield='@timestamp', metric='max:system.memory.actual.used.bytes'),null).label('warning').color('#FFCC11').lines(width=5), .es(index=metricbeat-*, timefield='@timestamp', metric='max:system.memory.actual.used.bytes').if(gt,15000000000,.es(index=metricbeat-*, timefield='@timestamp', metric='max:system.memory.actual.used.bytes'),null).label('severe').color('red').lines(width=5), .es(index=metricbeat-*, timefield='@timestamp', metric='max:system.memory.actual.used.bytes').mvavg(10).label('mvavg').lines(width=2).color(#5E5E5E).legend(columns=4, position=nw)
Save your Timelion sheet and continue on to the next section to add these new visualizations to your dashboard.