IMPORTANT: No additional bug fixes or documentation updates
will be released for this version. For the latest information, see the
current release documentation.
Editing a visualization
edit
IMPORTANT: This documentation is no longer updated. Refer to Elastic's version policy and the latest documentation.
Editing a visualization
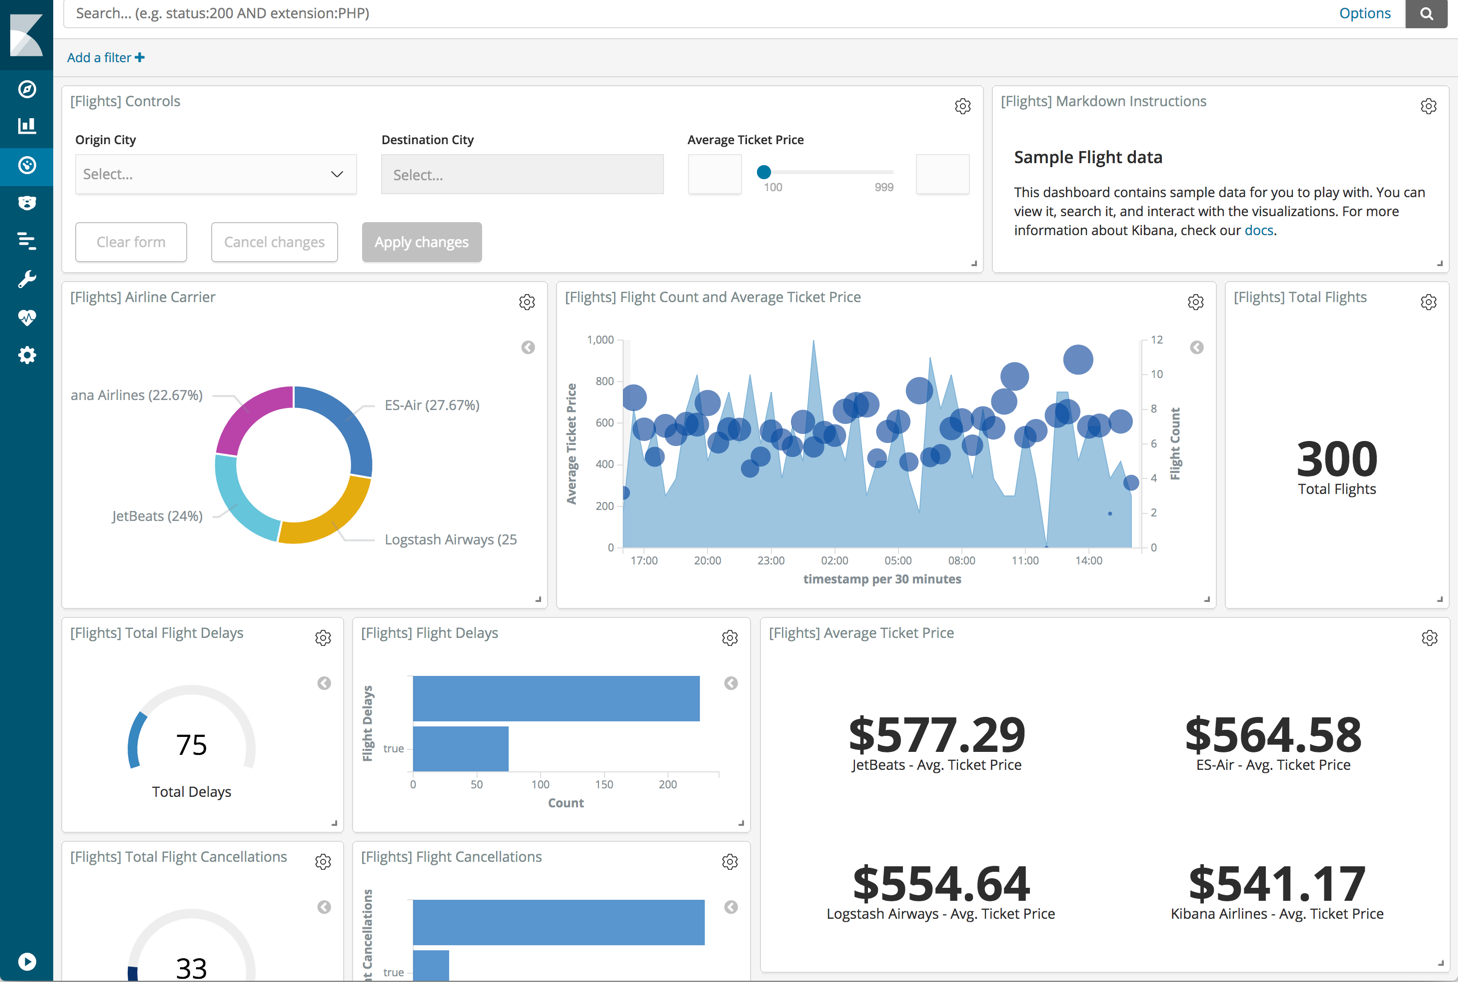
editYou have edit permissions for the Global Flight dashboard so you can change the appearance and behavior of the visualizations. For example, you might want to see which airline has the lowest average fares.
- Go to the Global Flight dashboard.
- In the menu bar, click Edit.
- In the Average Ticket Price visualization, click the gear icon in the upper right.
- From the Options menu, select Edit visualization.
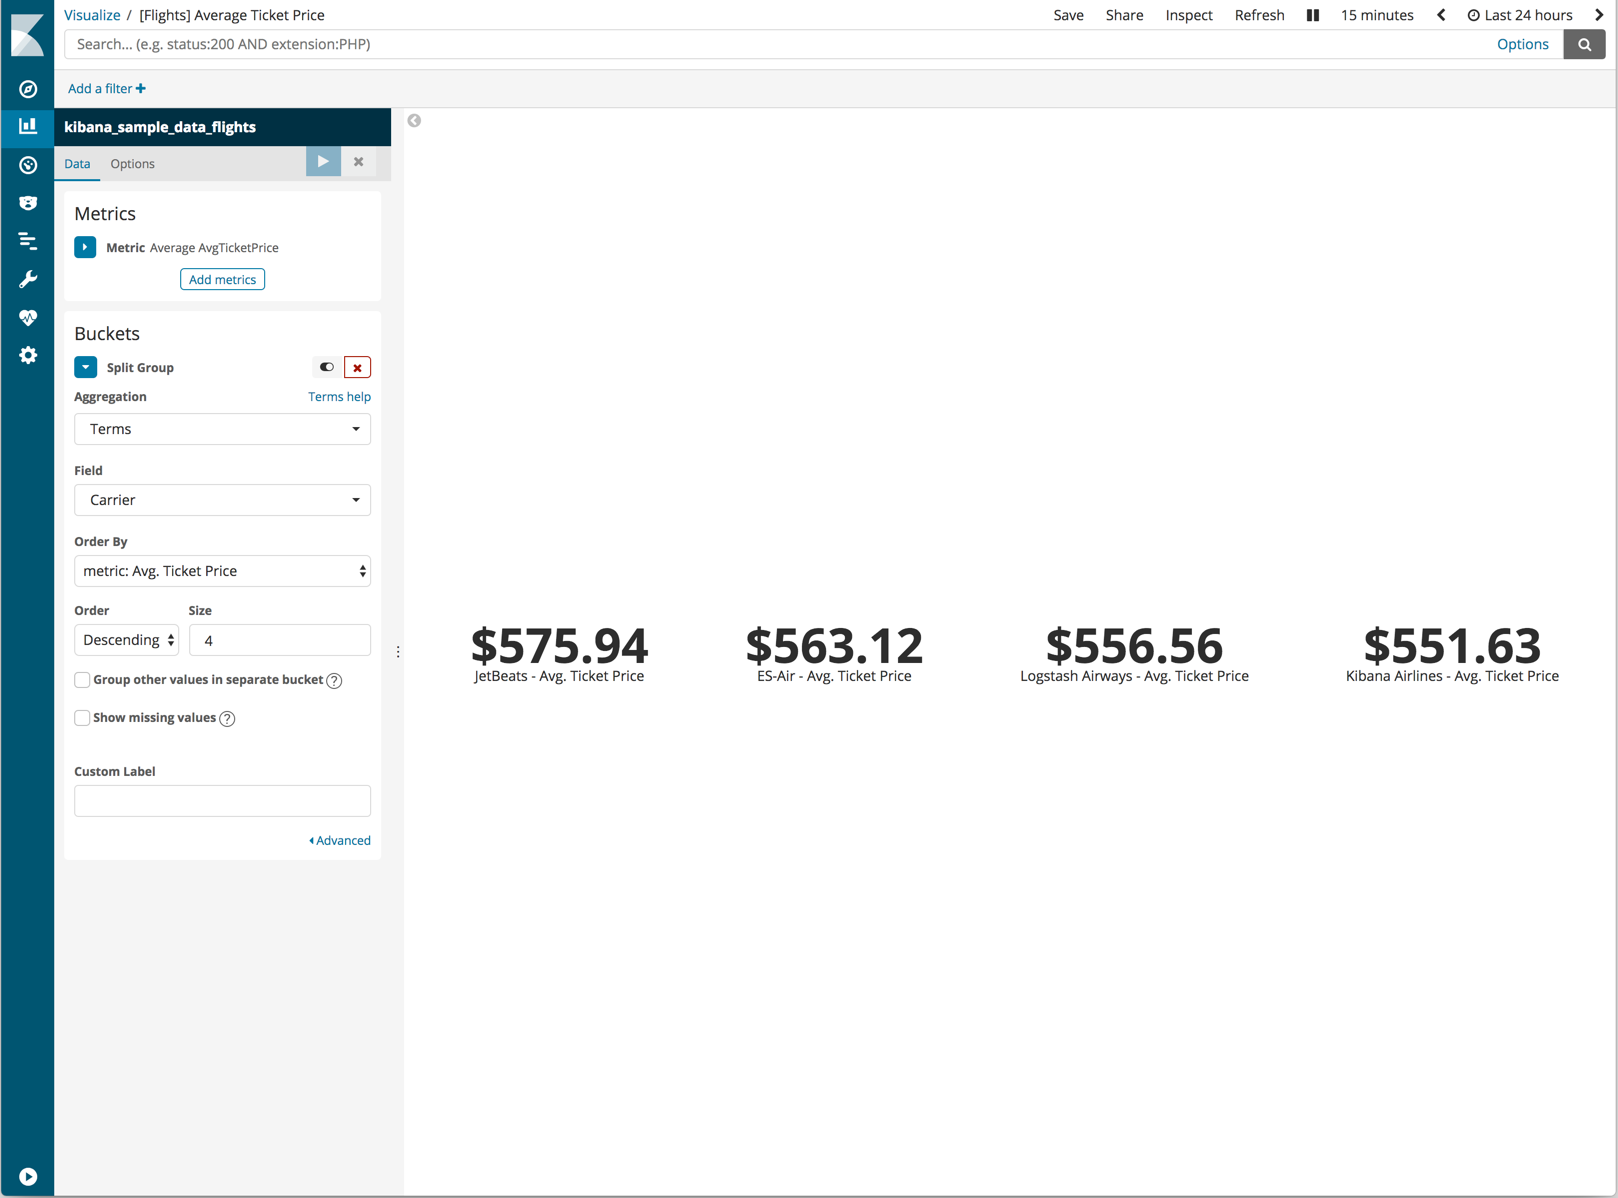
Edit a metric visualization
editAverage Ticket Price is a metric visualization. To specify which groups to display in this visualization, you use an Elasticsearch bucket aggregation. This aggregation sorts the documents that match your search criteria into different categories, or buckets.
- In the Buckets pane, select Split Group.
- In the Aggregation dropdown menu, select Terms.
- In the Field dropdown, select Carrier.
- Set Descending to four.
-
Click Apply changes
 .
.
You now see the average ticket price for all four airlines.
Save the changes
edit- In the menu bar, click Save.
- Leave the visualization name unchanged and click Save.
- Go to the Global Flight dashboard.
- Resize the panel for the Average Ticket Price visualization by dragging the handle in the lower right. You can also rearrange the visualizations by clicking the header and dragging.
-
In the menu bar, click Save and then confirm the save.