IMPORTANT: No additional bug fixes or documentation updates
will be released for this version. For the latest information, see the
current release documentation.
Coordinate map
edit
IMPORTANT: This documentation is no longer updated. Refer to Elastic's version policy and the latest documentation.
Coordinate map
editUsing a coordinate map, you can visualize geographic information in the log file sample data.
-
Create a Coordinate map and set the search source to
logstash*. - In the top menu bar, click the time picker on the far right.
- Click Absolute.
- Set the start time to May 18, 2015 and the end time to May 20, 2015.
- Click Go.
You haven’t defined any buckets yet, so the visualization is a map of the world.
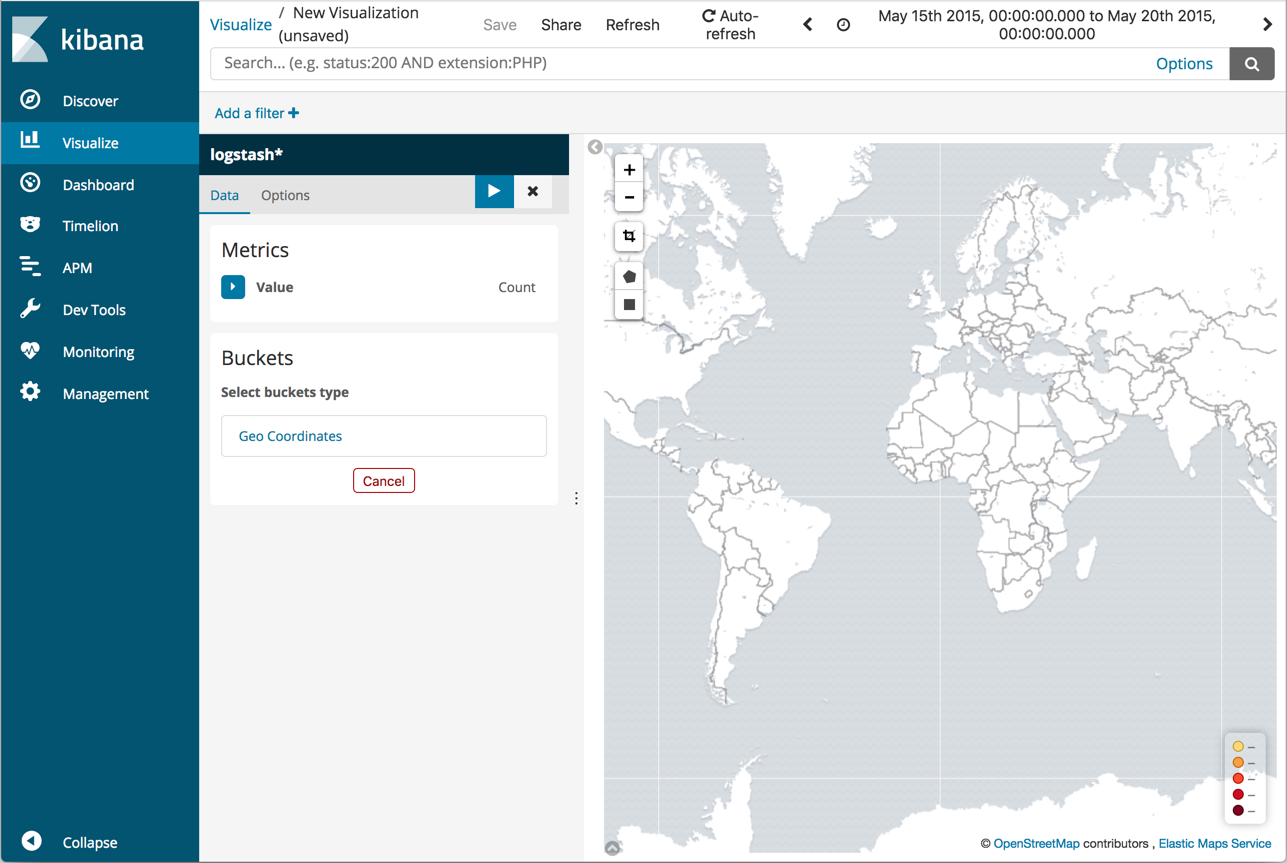
Now map the geo coordinates from the log files.
- In the Buckets pane, click Geo Coordinates.
- Set Aggregation to Geohash and Field to geo.coordinates.
-
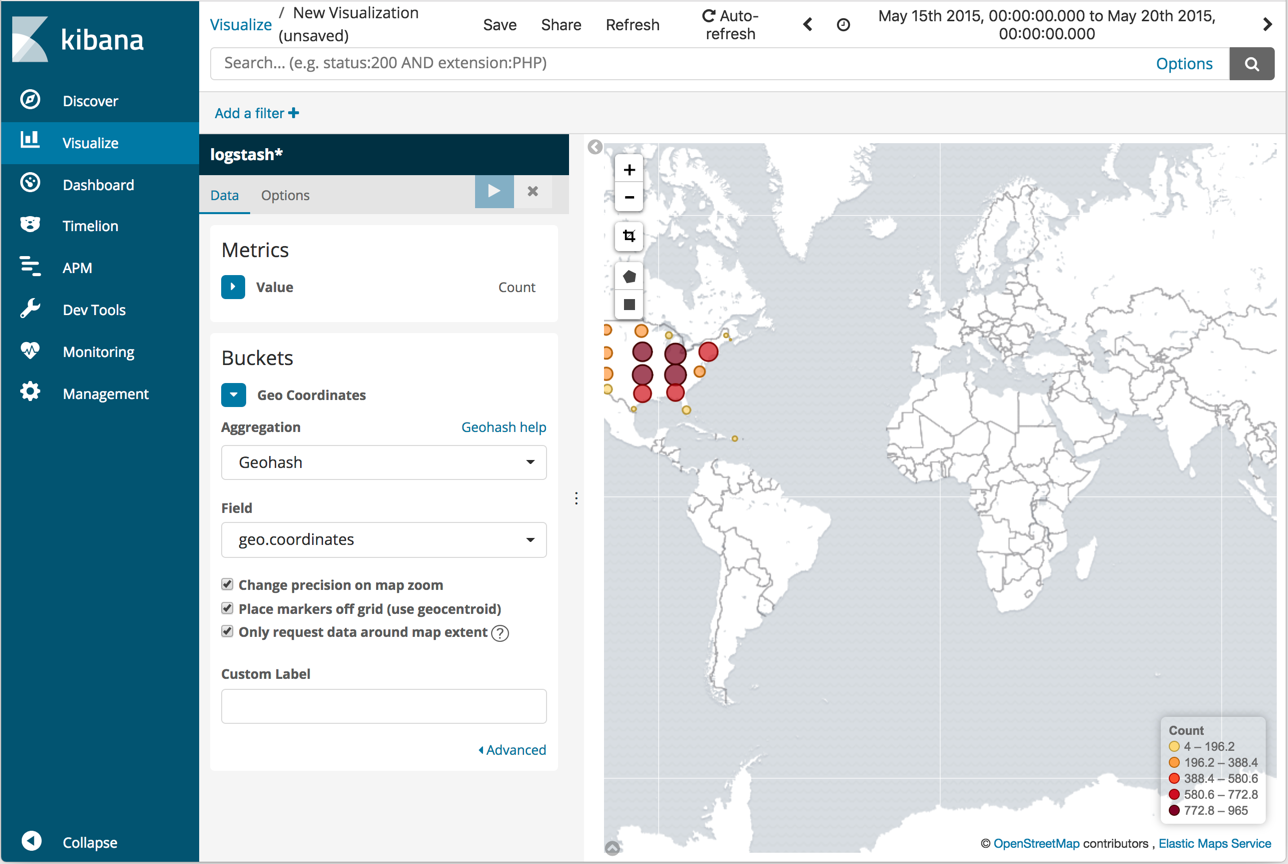
Click Apply changes
 .
.
The map now looks like this:
You can navigate the map by clicking and dragging. The controls on the top left of the map enable you to zoom the map and set filters. Give them a try.
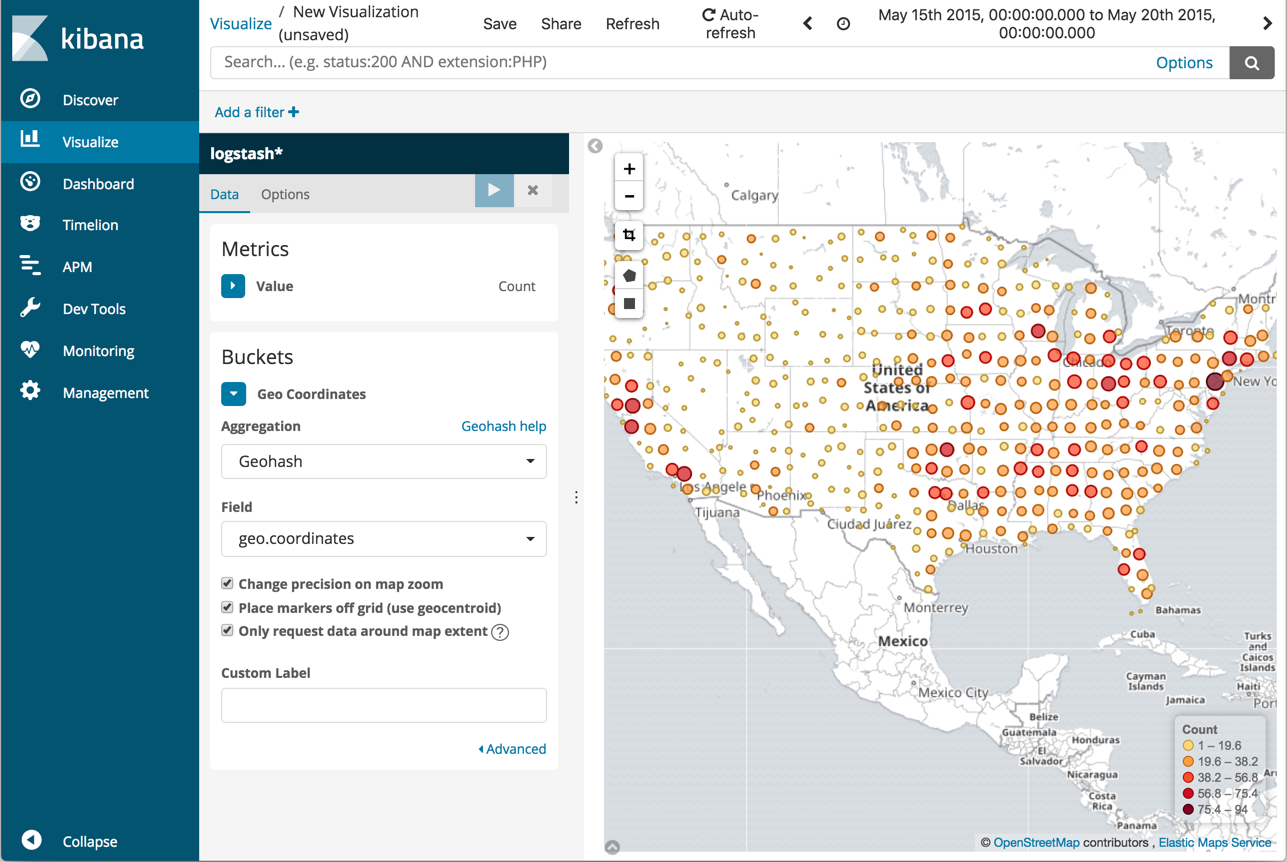
Save this map with the name Map Example.