IMPORTANT: No additional bug fixes or documentation updates
will be released for this version. For the latest information, see the
current release documentation.
Building a Dashboard
edit
IMPORTANT: This documentation is no longer updated. Refer to Elastic's version policy and the latest documentation.
Building a Dashboard
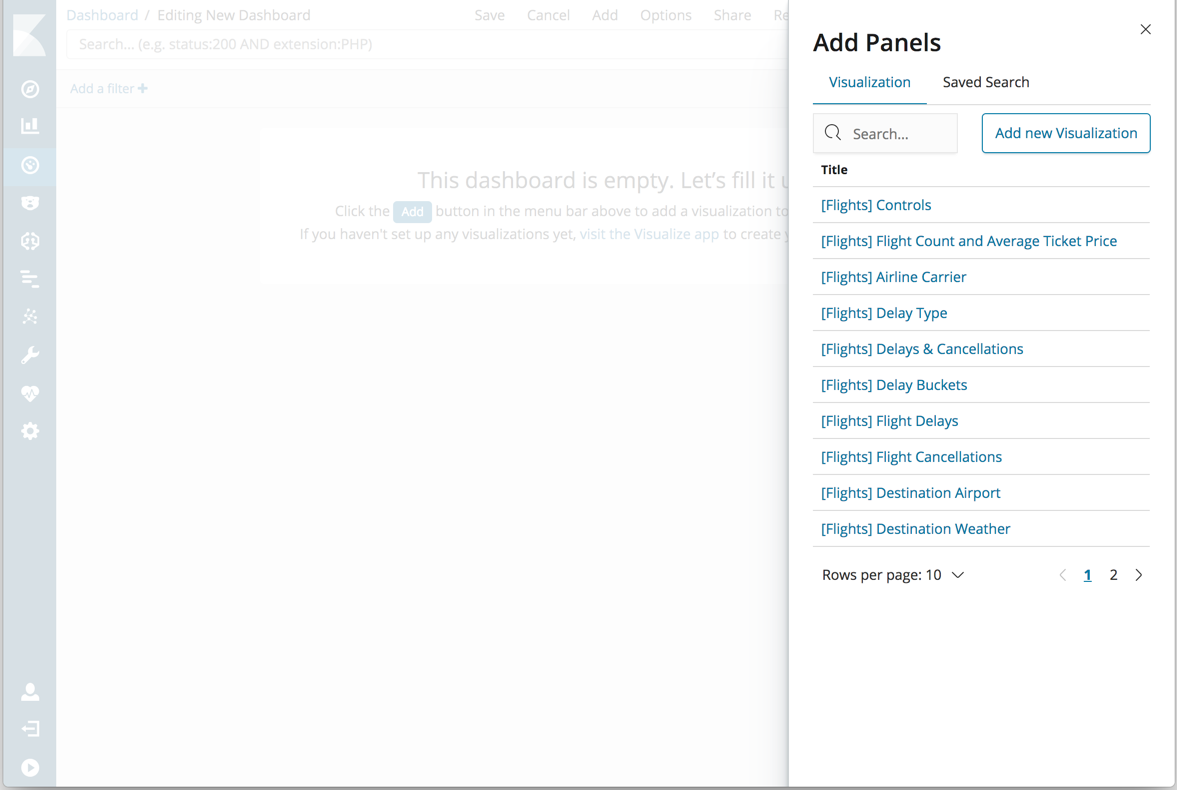
editIf you haven’t yet indexed data into Elasticsearch or created an index pattern, you’ll be prompted to do so as you follow the steps for creating a dashboard. Or, you can use one of the prebuilt sample data sets, available from the Kibana home page.
- In the side navigation, click Dashboard.
- Click Create new dashboard.
- Click Add.
-
Use Add Panels to add visualizations and saved searches to the dashboard. If you have a large number of visualizations, you can filter the lists.
- When you’re finished adding and arranging the panels, go to the menu bar and click Save.
- In Save Dashboard, enter a dashboard title and optionally a description.
- To store the time period specified in the time filter, enable Store time with dashboard.
- Click Save.
To import, export, and delete dashboards, see Managing Saved Objects.
Changing the Color Theme
editBy default, Kibana dashboards use the light color theme. To use the dark color theme:
- Go to the menu bar and click Edit.
- Click Options in the menu bar.
- Select Use dark theme.
To set the dark theme as the default, go to Management > Advanced Settings. Scroll down to Dashboard and toggle Dark Theme to On.