Viewing Visualization Data
editViewing Visualization Data
editIf your visualization supports it, you can display the raw data behind the visualization using the Expand/Collapse button.
- Open the dashboard.
-
Hover over the visualization and click the Expand button in the lower left.
The underlying data is displayed in a table. You can also view the raw Elasticsearch request, the response in JSON, and the request statistics. These statistics show the query duration, request duration, total number of matching records, and the index that was searched.
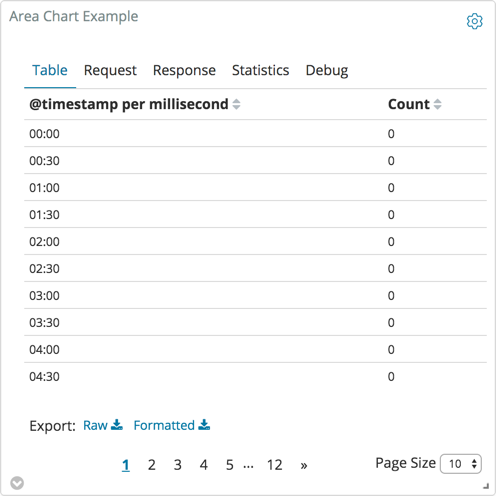
To export the visualization data as a comma separated values (CSV) file, click Raw or Formatted at the bottom of the data table. Raw exports the response data as provided. Formatted exports the reponse data using applicable Kibana field formatters.
To return to the visualization, click the Collapse button in the lower left corner.