WARNING: Version 6.2 of Kibana has passed its EOL date.
This documentation is no longer being maintained and may be removed. If you are running this version, we strongly advise you to upgrade. For the latest information, see the current release documentation.
Visualization Spy
editVisualization Spy
editTo display the raw data behind the visualization, click the  button in the bottom left corner of the container. The visualization spy panel will open. Use the select input to view detailed information about the raw data.
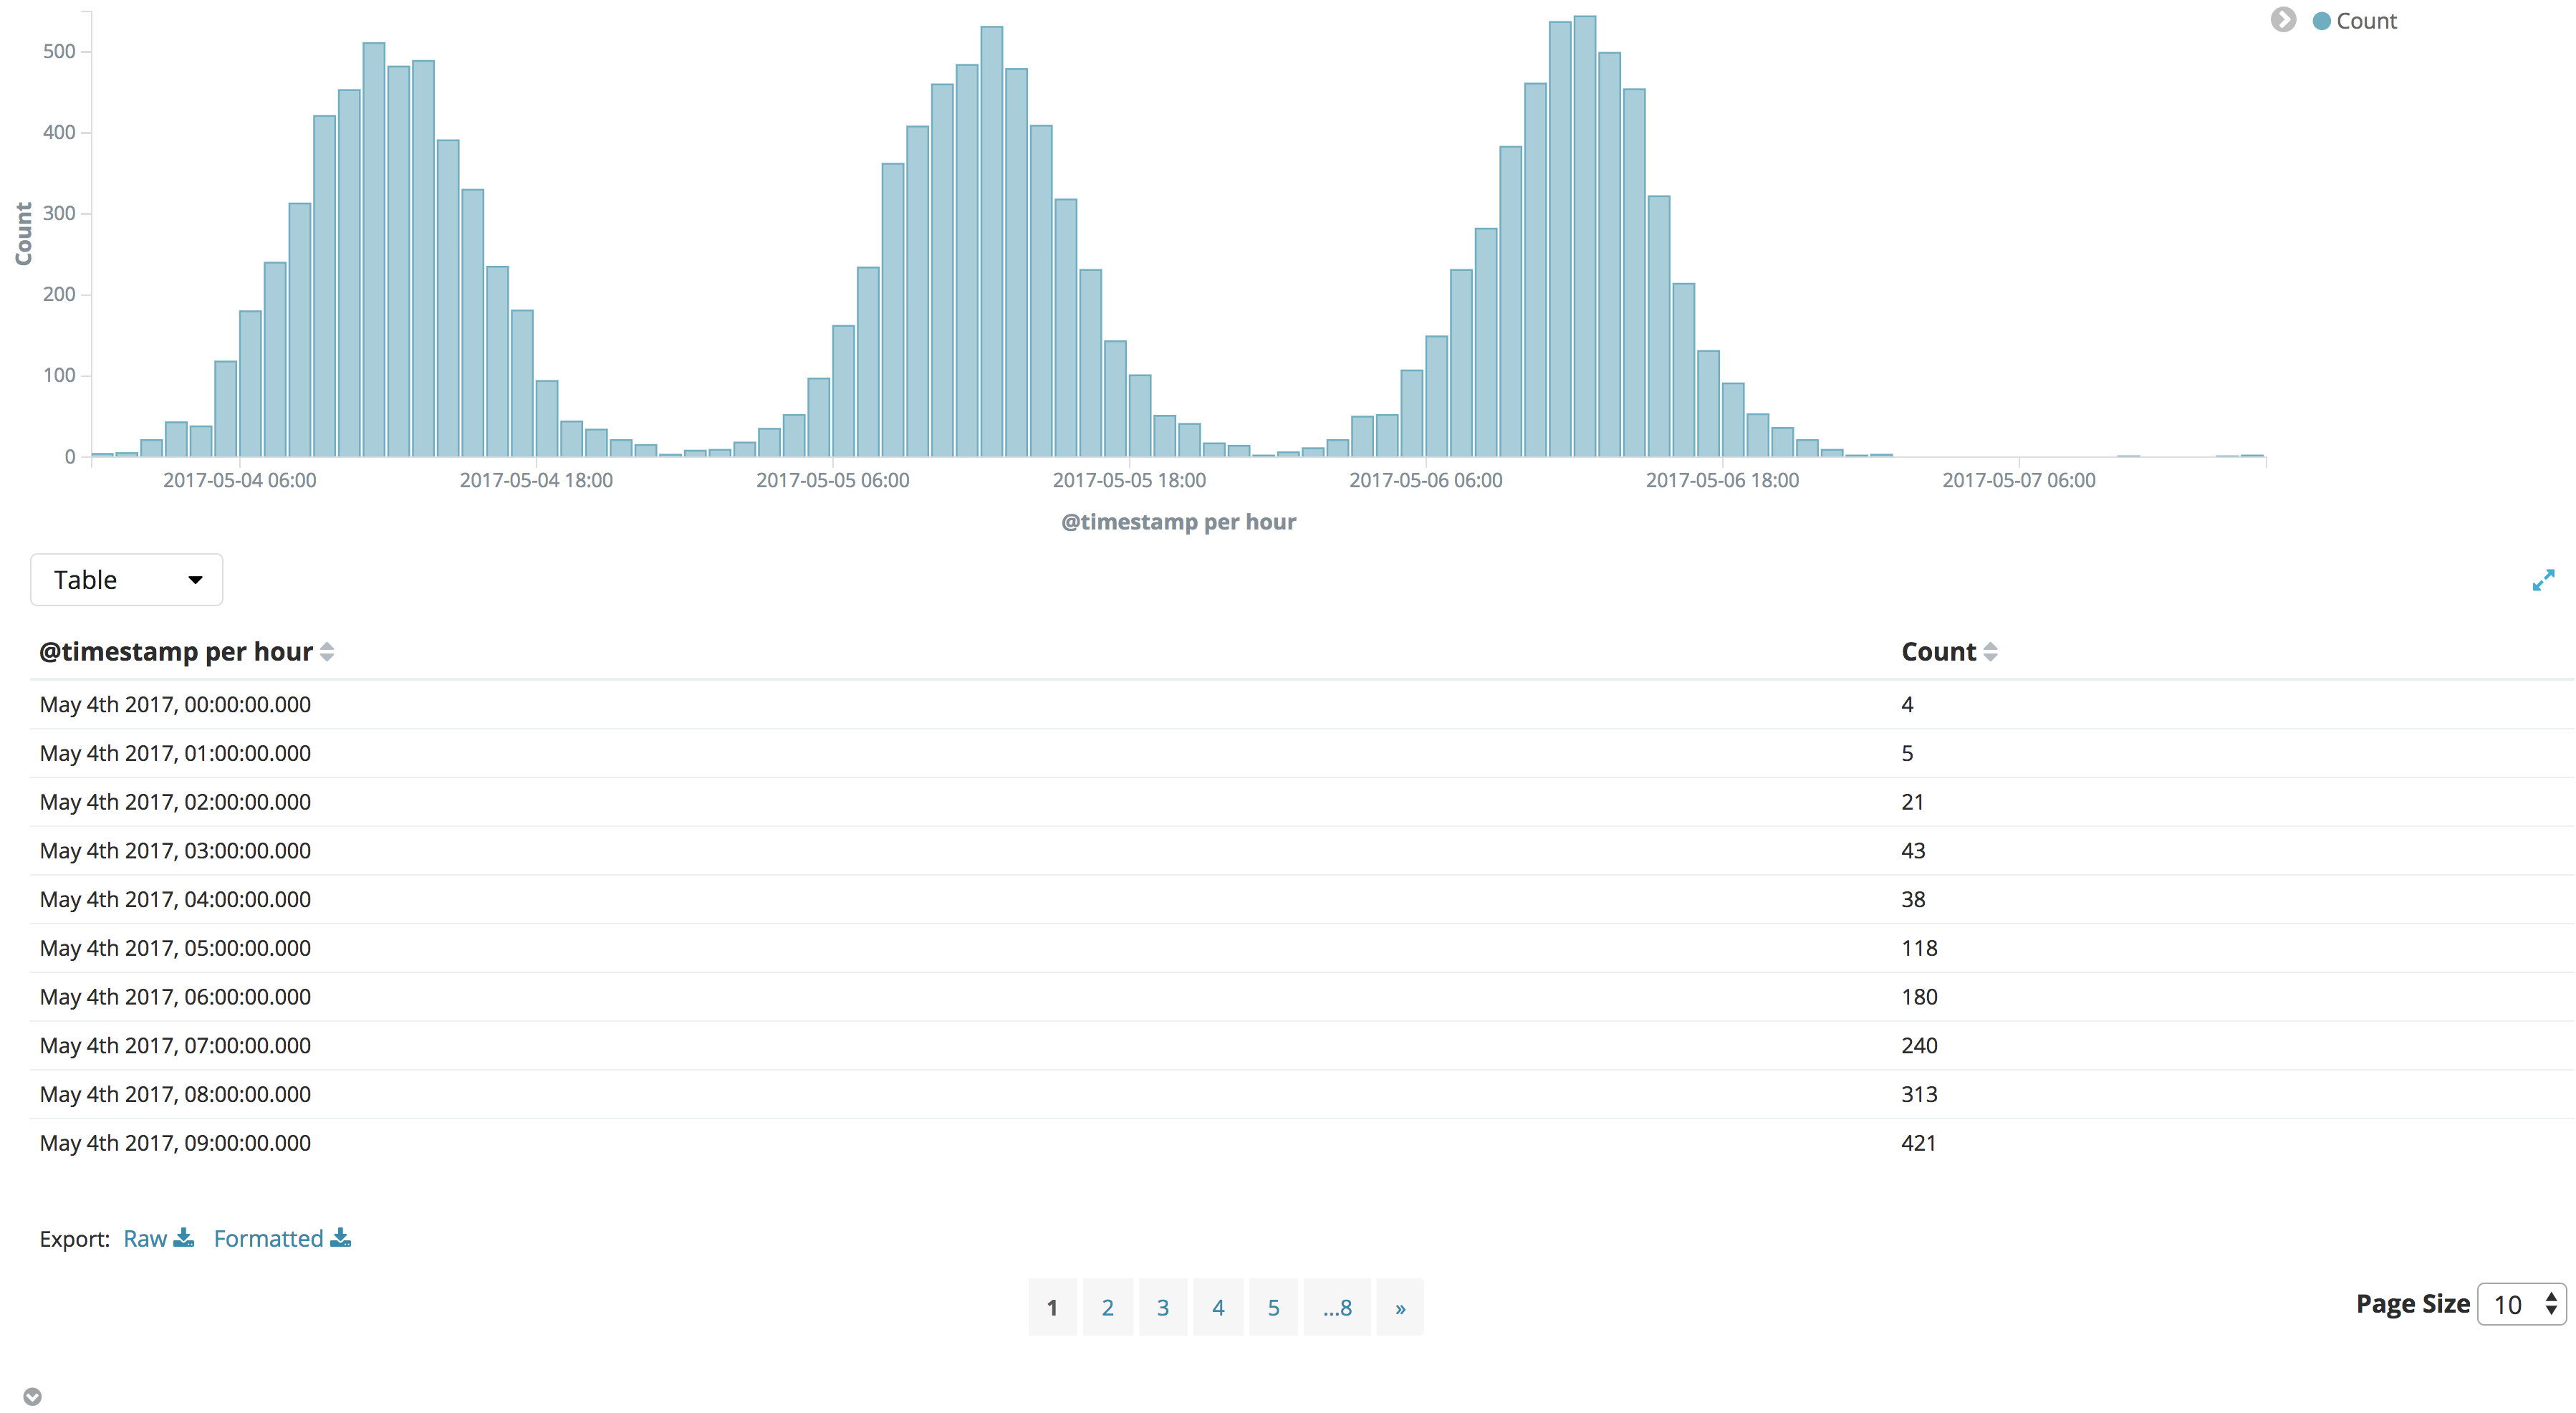
TableA representation of the underlying data, presented as a paginated data grid. You can sort the items in the table by clicking on the table headers at the top of each column.
RequestThe raw request used to query the server, presented in JSON format.
ResponseThe raw response from the server, presented in JSON format.
StatisticsA summary of the statistics related to the request and the response, presented as a data grid. The data grid includes the query duration, the request duration, the total number of records found on the server, and the index pattern used to make the query.
DebugThe visualization saved state presented in JSON format.
To export the raw data behind the visualization as a comma-separated-values (CSV) file, click on either the Raw or Formatted links at the bottom of any of the detailed information tabs. A raw export contains the data as it is stored in Elasticsearch. A formatted export contains the results of any applicable Kibana field formatters.