WARNING: Version 6.2 of Kibana has passed its EOL date.
This documentation is no longer being maintained and may be removed. If you are running this version, we strongly advise you to upgrade. For the latest information, see the current release documentation.
Interface Overview
editInterface Overview
editThe user interface for each visualization is compose of a "Data" tab and "Panel Options". The only exception to that is the Time Series and Markdown visualizations; the Time Series has a third tab for annotations and the Markdown has a third tab for the editor.
Data Tab
editThe data tab is used for configuring the series for each visualization. This tab allows you to add multiple series, depending on what the visualization supports, with multiple aggregations composed together to create a single metric. Here is a breakdown of the significant components of the data tab UI.
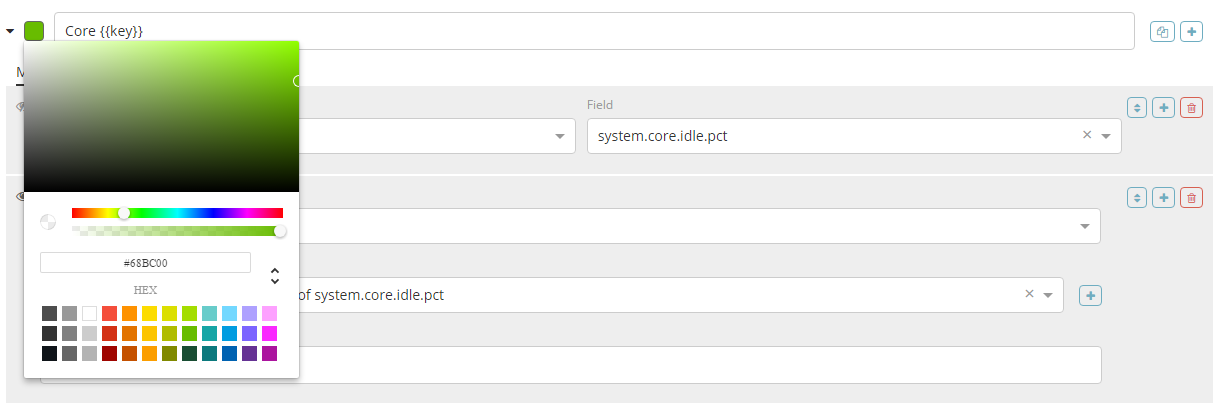
Series Label and Color
editEach series supports a label which will be used for legends and titles depending on
which visualization type is selected. For series that are grouped by a term, you
can specify a mustache variable of {{key}} to substitute the term. For most
visualizations you can also choose a color by clicking on the swatch, this will display
the color picker.
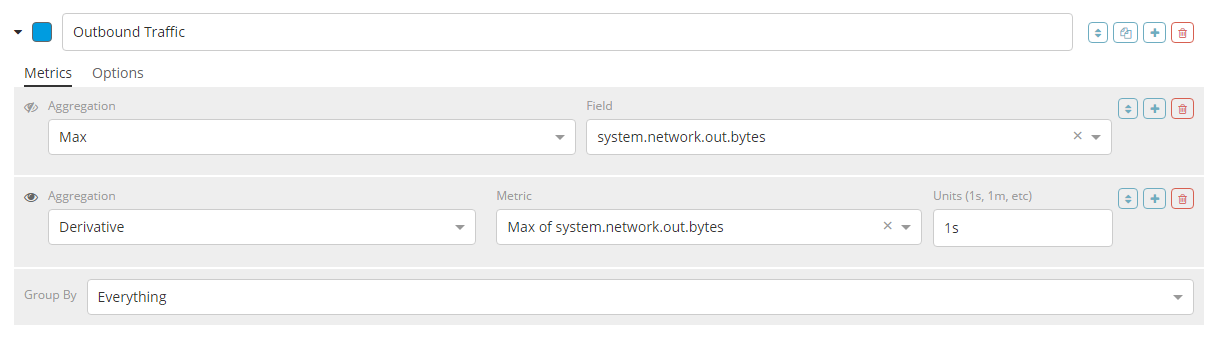
Metrics
editEach series supports multiple metrics (aggregations); the last metric (aggregation) is the value that will be displayed for the series, this is indicated with the "eye" icon to the left of the metric. Metrics can be composed using pipeline aggregations. A common use case is to create a metric with a "max" aggregation then create a "derivative" metric and choose the previous "max" metric as the source; this will create a rate.
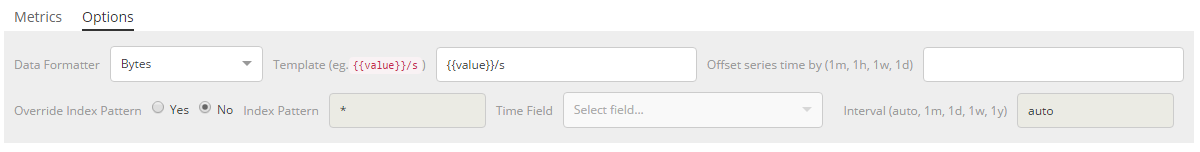
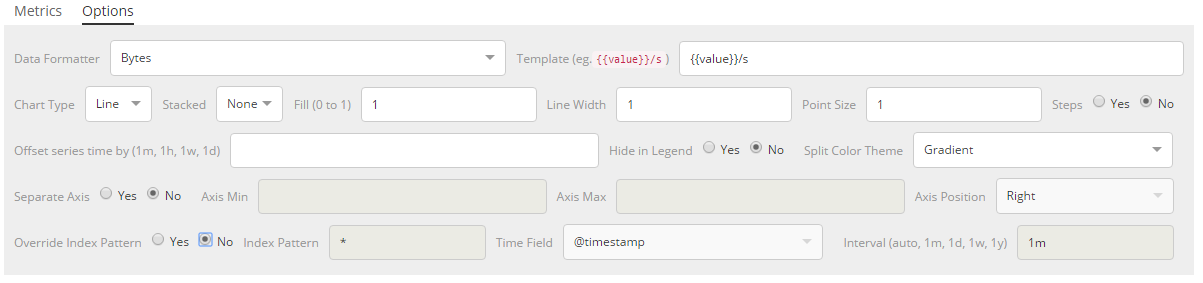
Series Options
editEach series also supports a set of options which are dependent on the type of visualizations you have selected. Universal across each visualization type you can configure:
- Data format
- Time range offset
- Index pattern, timestamp, and interval override
For the Time Series visualization you can also configure:
- Chart type
- Options for each chart type
- Legend Visibility
- Y-Axis options
- Split color theme
Group By Controls
editAt the bottom of the metrics there is a set of "Group By" controls that allows you to specify how the series should be grouped or split. There are four choices:
- Everything
- Filter (single)
- Filters (multiple with configurable colors)
- Terms
By default the series is grouped by everything.
Panel Options Tab
editThe panel options tab is used for configuring the entire panel; the set of options available is dependent on which visualization you have selected. Below is a list of the options available per visualization:
Time Series
- Index pattern, timestamp, and Interval
- Y-Axis min and max
- Y-Axis position
- Background color
- Legend visibility
- Legend position
- Panel filter
Metric
- Index pattern, timestamp, and interval
- Panel filter
- Color rules for background and primary value
Top N
- Index pattern, timestamp, and interval
- Panel filter
- Background color
- Item URL
- Color rules for bar colors
Gauge
- Index pattern, timestamp, and interval
- Panel filter
- Background color
- Gauge max
- Gauge style
- Inner gauge color
- Inner gauge width
- Gauge line width
- Color rules for gauge line
Markdown
- Index pattern, timestamp, and interval
- Panel filter
- Background color
- Scroll bar visibility
- Vertical alignment of content
- Custom Panel CSS with support for Less syntax
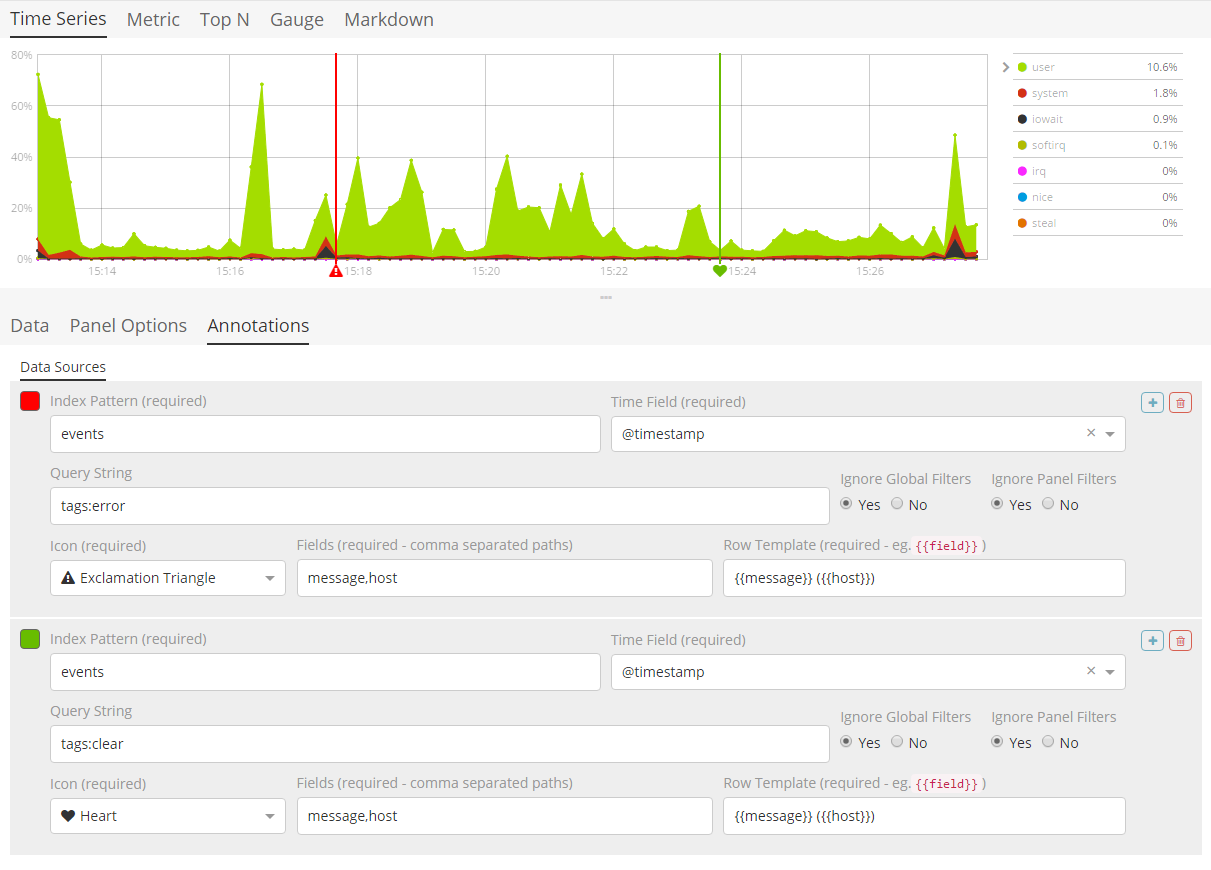
Annotations Tab
editThe annotations tab is used for adding annotation data sources to the Time Series Visualization. You can configure the following options:
- Index pattern and time field
- Annotation color
- Annotation icon
- Fields to include in message
- Format of message
- Filtering options at the panel and global level
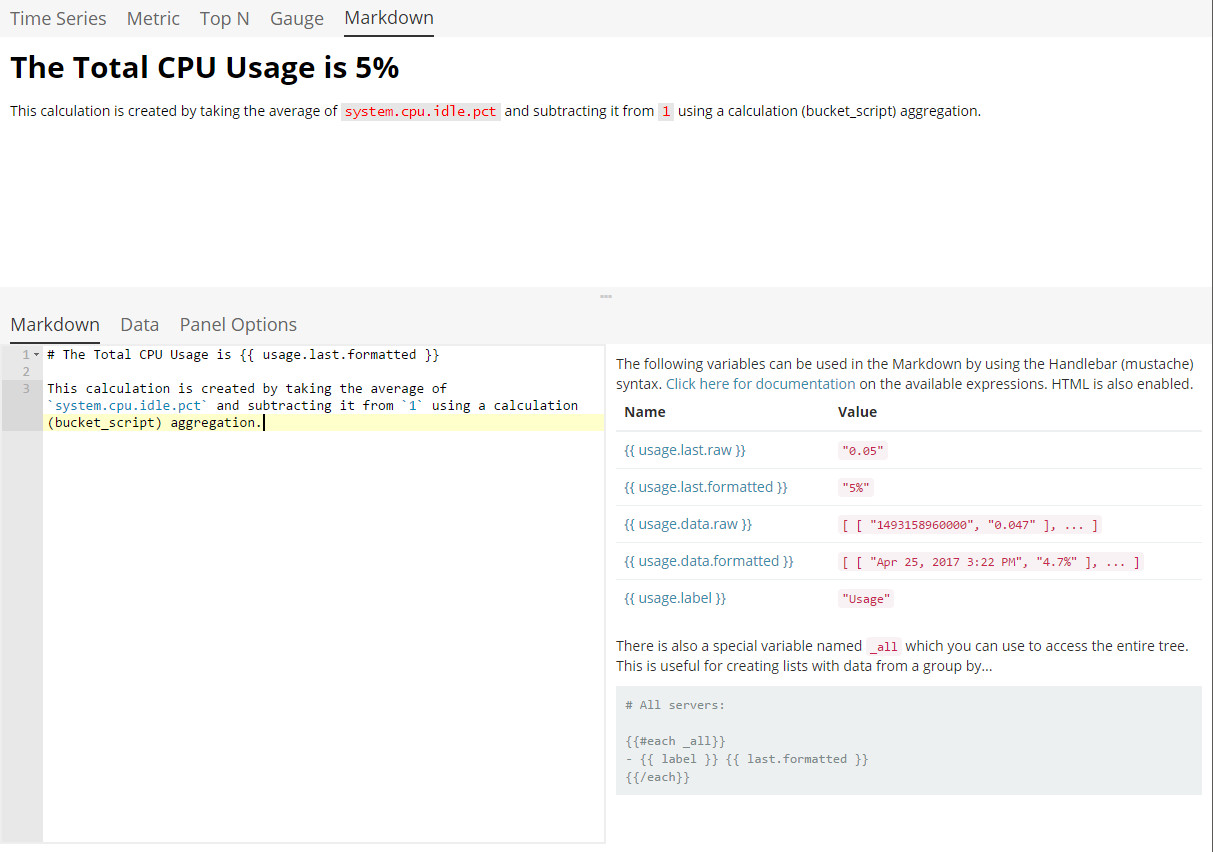
Markdown Tab
editThe markdown tab is used for editing the source for the Markdown visualization. The user interface has an editor on the left side and the available variables from the data tab on the right side. You can click on the variable names to insert the mustache template variable into the markdown at the cursor position. The mustache syntax uses the Handlebar.js processor which is an extended version of the Mustache template language.