WARNING: Version 6.1 of Kibana has passed its EOL date.
This documentation is no longer being maintained and may be removed. If you are running this version, we strongly advise you to upgrade. For the latest information, see the current release documentation.
Visualization Factory
editVisualization Factory
editUse the VisualizationFactory to create a new visualization.
The creation-methods create a new visualization tied to the underlying rendering technology.
You should also register the visualization with VisTypesRegistryProvider.
import { CATEGORY } from 'ui/vis/vis_category';
import { VisFactoryProvider } from 'ui/vis/vis_factory';
import { VisTypesRegistryProvider } from 'ui/registry/vis_types';

const MyNewVisType = (Private) => {
  const VisFactory = Private(VisFactoryProvider);

  return  VisFactory.createBaseVisualization({
    name: 'my_new_vis',
    title: 'My New Vis',
    icon: 'my_icon',
    description: 'Cool new chart',
    category: CATEGORY.OTHER
    ...
  });
}

VisTypesRegistryProvider.register(MyNewVisType);
The list of common parameters:
- name: unique visualization name, only lowercase letters and underscore
- title: title of your visualization as displayed in kibana
- icon: the icon class to use (font awesome)
- image: instead of icon you can provide svg image (imported)
- description: description of your visualization as shown in kibana
-
category: the category your visualization falls into (one of
ui/vis/vis_categoryvalues) - visConfig: object holding visualization parameters
- visConfig.defaults: object holding default visualization configuration
- visualization: A constructor function for a Visualization.
- requestHandler: <string> one of the available request handlers or a <function> for a custom request handler
- responseHandler: <string> one of the available response handlers or a <function> for a custom response handler
- editor: <string> one of the available editors or Editor class for custom one
- editorConfig: object holding editor parameters
- options.showTimePicker: <bool> show or hide time picker (defaults to true)
- options.showQueryBar: <bool> show or hide query bar (defaults to true)
- options.showFilterBar: <bool> show or hide filter bar (defaults to true)
- options.showIndexSelection: <bool> show or hide index selection (defaults to true)
- stage: <string> Set this to "experimental" or "labs" to mark your visualization as experimental. Labs visualizations can also be disabled from the advanced settings. (defaults to "production")
- feedbackMessage: <string> You can provide a message (which can contain HTML), that will be appended to the experimental notification in visualize, if your visualization is experimental or in lab mode.
Each of the factories have some of the custom parameters, which will be described below.
Base Visualization Type
editThe base visualization type does not make any assumptions about the rendering technology you are going to use and works with pure Javascript. It is the visualization type we recommend to use.
You need to provide a type with a constructor function, a render method which will be called every time options or data change, and a destroy method which will be called to cleanup.
The render function receives the data object and status object which tells what actually changed. Render function needs to return a promise, which should be resolved once the visualization is done rendering.
Status object has the following properties: vis, aggs, resize, data. Each of them is set to true if the matching
object changed since last call to the render function or set to false otherwise. You can use it to make your
visualization rendering more efficient.
-
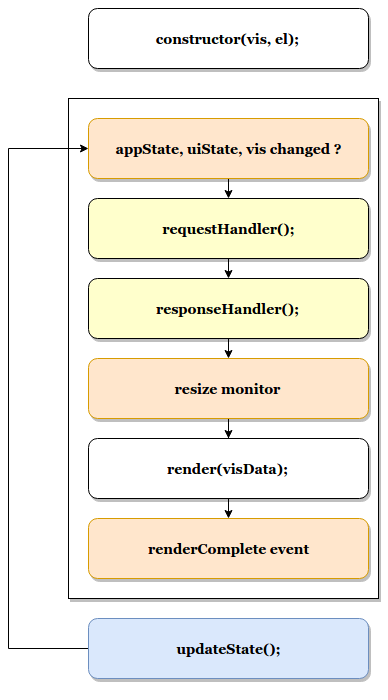
Your visualizations constructor will get called with
visobject and the DOM-element to which it should render. At this point you should prepare everything for rendering, but not render yet -
<visualize>component monitorsappState,uiStateandvisfor changes -
on changes the
<visualize>-directive will call yourrequestHandler. Implementing a request handler is optional, as you might use one of the provided ones. -
response from
requestHandlerwill get passed toresponseHandler. It should convert raw data to something that can be consumed by visualization. ImplementingresponseHandleris optional, as you might use of of the provided ones. -
On new data from the
responseHandleror on when the size of the surrounding DOM-element has changed, your visualizationrender-method gets called. It needs to return a promise which resolves once the visualization is done rendering. -
the visualization should call
vis.updateState()any time something has changed that requires to re-render or fetch new data.
import { VisFactoryProvider } from 'ui/vis/vis_factory';
import { VisTypesRegistryProvider } from 'ui/registry/vis_types';

class MyVisualization {
   constructor(el, vis) {
      this.el = el;
      this.vis = vis;
   }
   async render(visData, status) {
      ...
      return 'done rendering';
   }
   destroy() {
      console.log('destroying');
   }
}

const MyNewVisType = (Private) => {
  const VisFactory = Private(VisFactoryProvider);

  return VisFactory.createBaseVisualization({
    name: 'my_new_vis',
    title: 'My New Vis',
    icon: 'my_icon',
    description: 'Cool new chart',
    visualization: MyVisualization
  });
}

VisTypesRegistryProvider.register(MyNewVisType);
AngularJS Visualization Type
editThe AngularJS visualization type assumes you are using angular as your rendering technology. Instead of providing the controller we need to provide the angular template to render.
The visualization will receive vis, uiState and visData on the $scope and needs to
call $scope.renderComplete() once it is done rendering.
const MyNewVisType = (Private) => {
  const VisFactory = Private(VisFactoryProvider);

  return VisFactory.createAngularVisualization({
    name: 'my_new_vis',
    title: 'My New Vis',
    icon: 'my_icon',
    description: 'Cool new chart',
    visConfig: {
       template: '<div ng-controller="MyAngularController"></div>`
    }
  });
}
React Visualization Type
editReact visualization type assumes you are using React as your rendering technology. Instead of passing it an AngularJS template you need to pass a React component.
The visualization will receive vis, uiState and visData as props.
It also has a renderComplete function, which needs to be called once the rendering has completed.
import { ReactComponent } from './my_react_component';

const MyNewVisType = (Private) => {
  const VisFactory = Private(VisFactoryProvider);

  return VisFactory.createReactVisualization({
    name: 'my_new_vis',
    title: 'My New Vis',
    icon: 'my_icon',
    description: 'Cool new chart',
    visConfig: {
       template: ReactComponent
    }
  });
}
Vislib Visualization Type
editThis visualization type should only be used for vislib visualizations. Vislib is kibana’s D3 library which can produce
point series charts and pie charts.