WARNING: Version 5.6 of Kibana has passed its EOL date.
This documentation is no longer being maintained and may be removed. If you are running this version, we strongly advise you to upgrade. For the latest information, see the current release documentation.
Putting it all Together with Dashboards
edit
IMPORTANT: This documentation is no longer updated. Refer to Elastic's version policy and the latest documentation.
Putting it all Together with Dashboards
editA dashboard is a collection of visualizations that you can arrange and share. To build a dashboard that contains the visualizations you saved during this tutorial:
- Click Dashboard in the side navigation.
- Click Add to display the list of saved visualizations.
- Click Markdown Example, Pie Example, Bar Example, and Map Example, then close the list of visualizations by clicking the small up-arrow at the bottom of the list.
Hovering over a visualization displays the container controls that enable you to edit, move, delete, and resize the visualization.
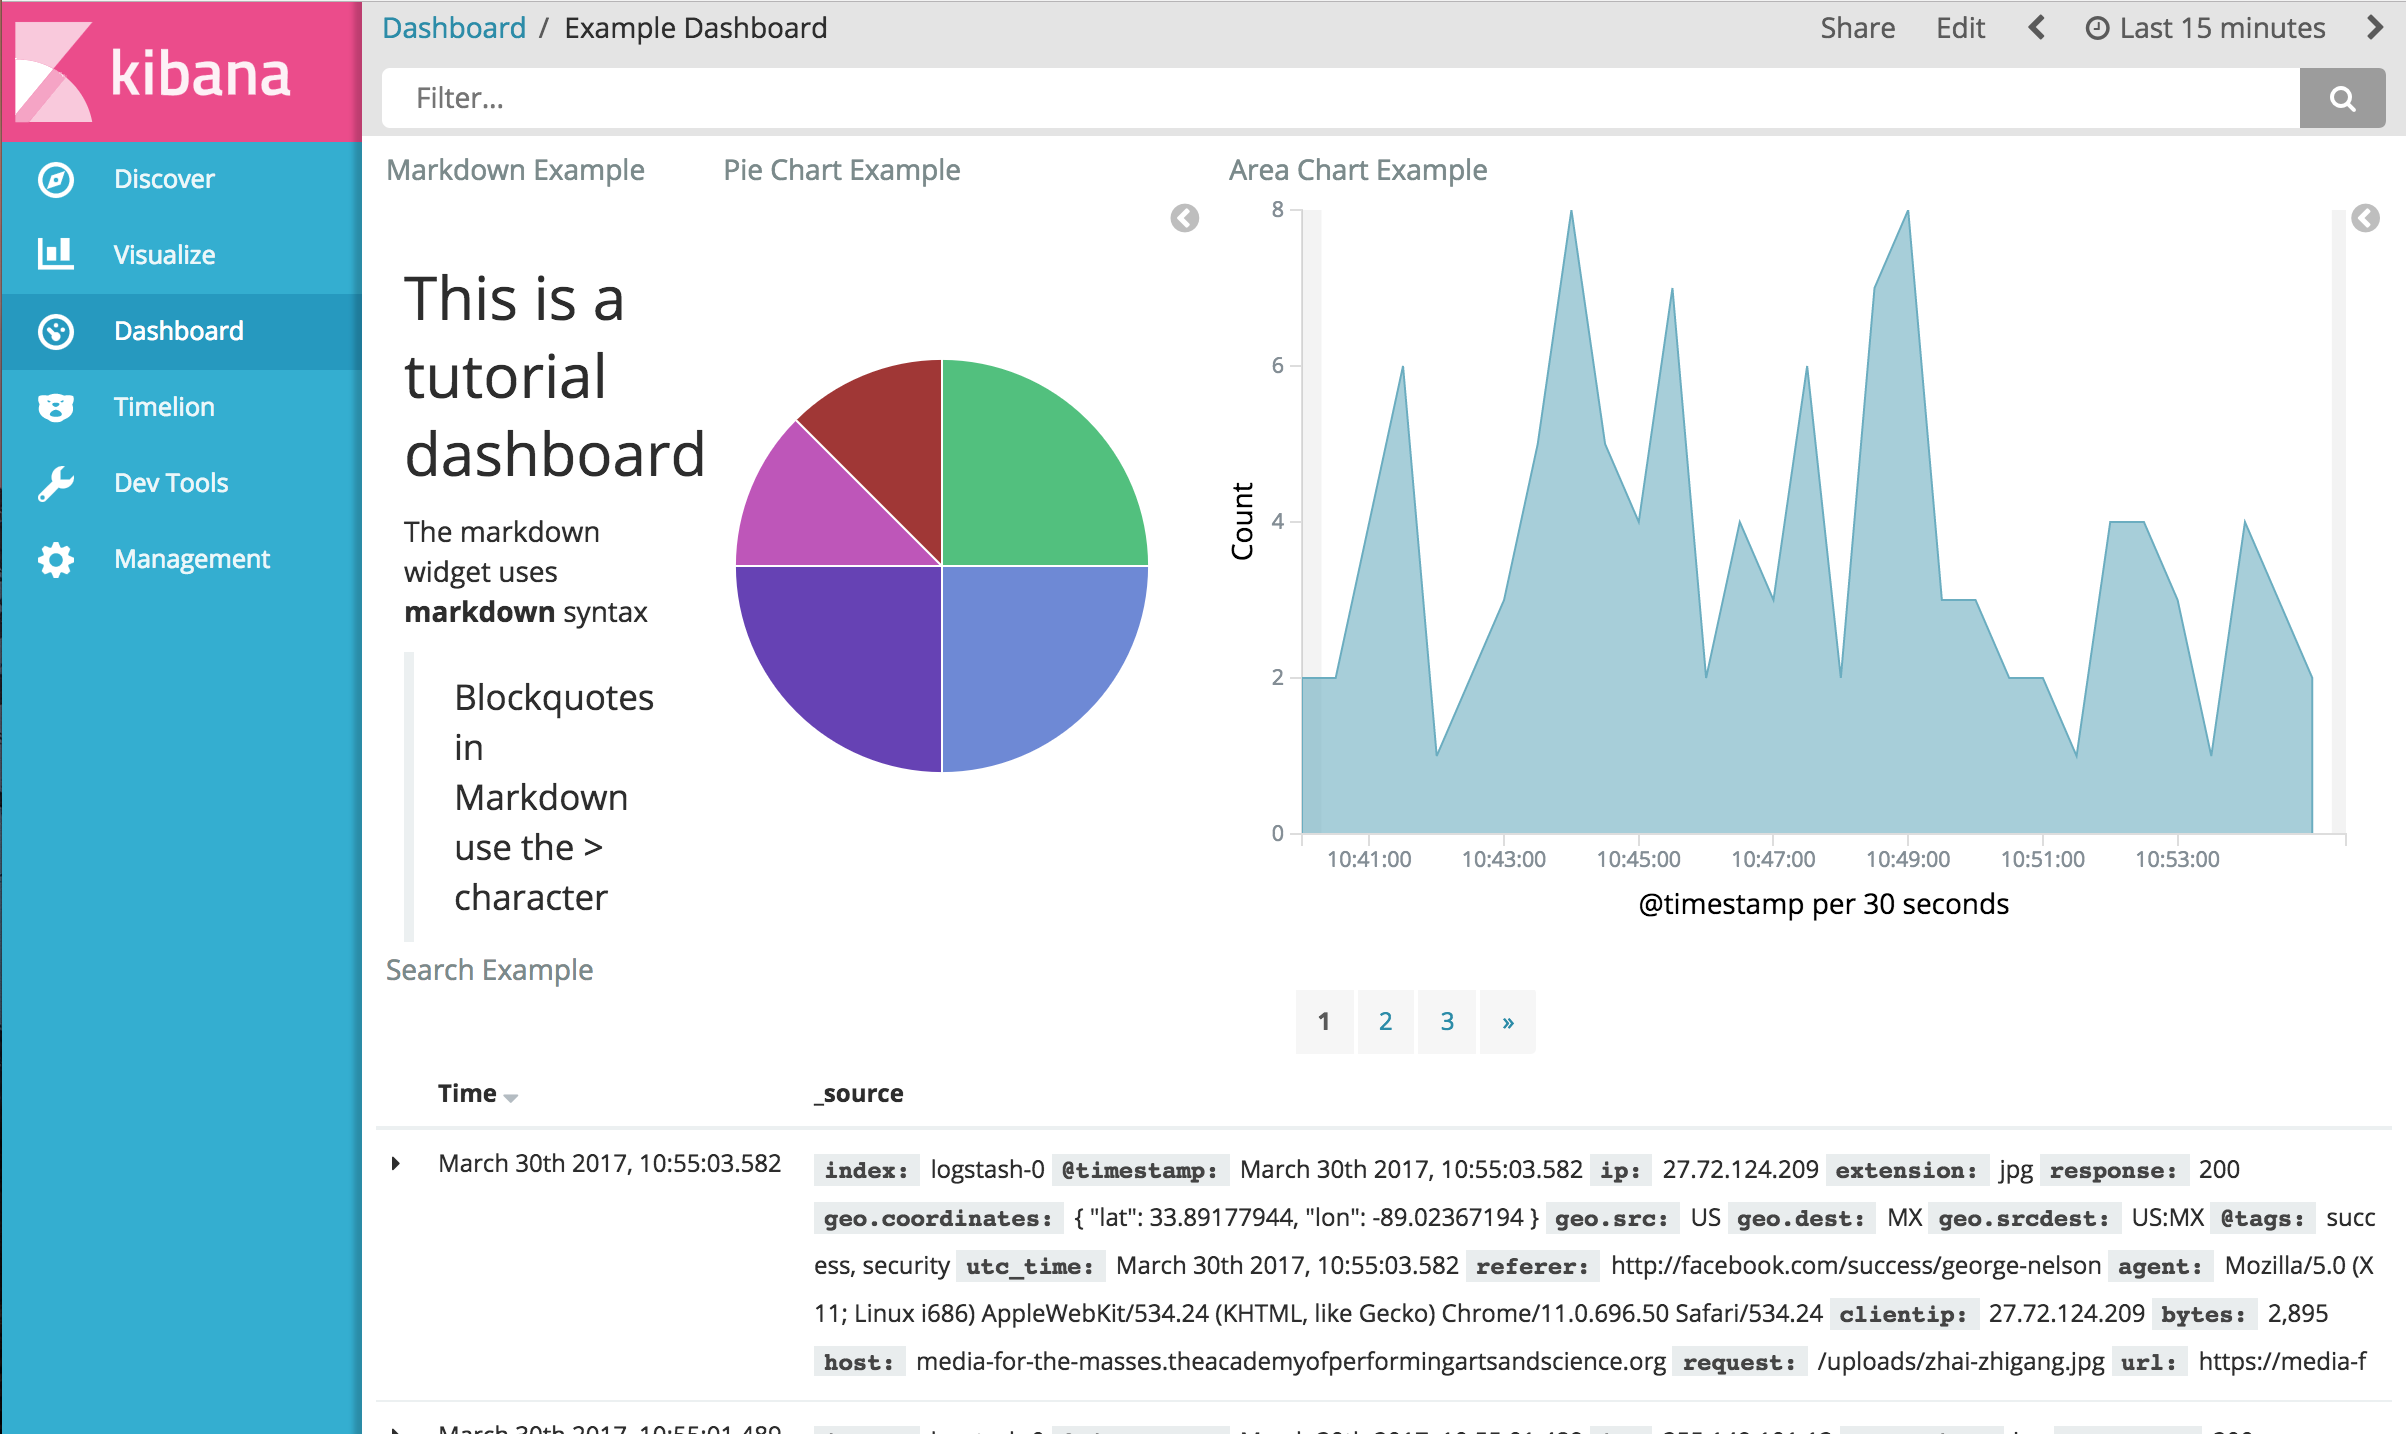
Your sample dashboard should end up looking roughly like this:
To get a link to share or HTML code to embed the dashboard in a web page, save the dashboard and click Share.