WARNING: Version 5.6 of Kibana has passed its EOL date.
This documentation is no longer being maintained and may be removed. If you are running this version, we strongly advise you to upgrade. For the latest information, see the current release documentation.
Add to dashboard
editAdd to dashboard
editYou’ve officially harnessed the power of Timelion to create time series visualizations. The final step of this tutorial is to add your new visualizations to a dashboard. Below, this section will show you how to save a visualization from your Timelion sheet and add it to an existing dashboard.
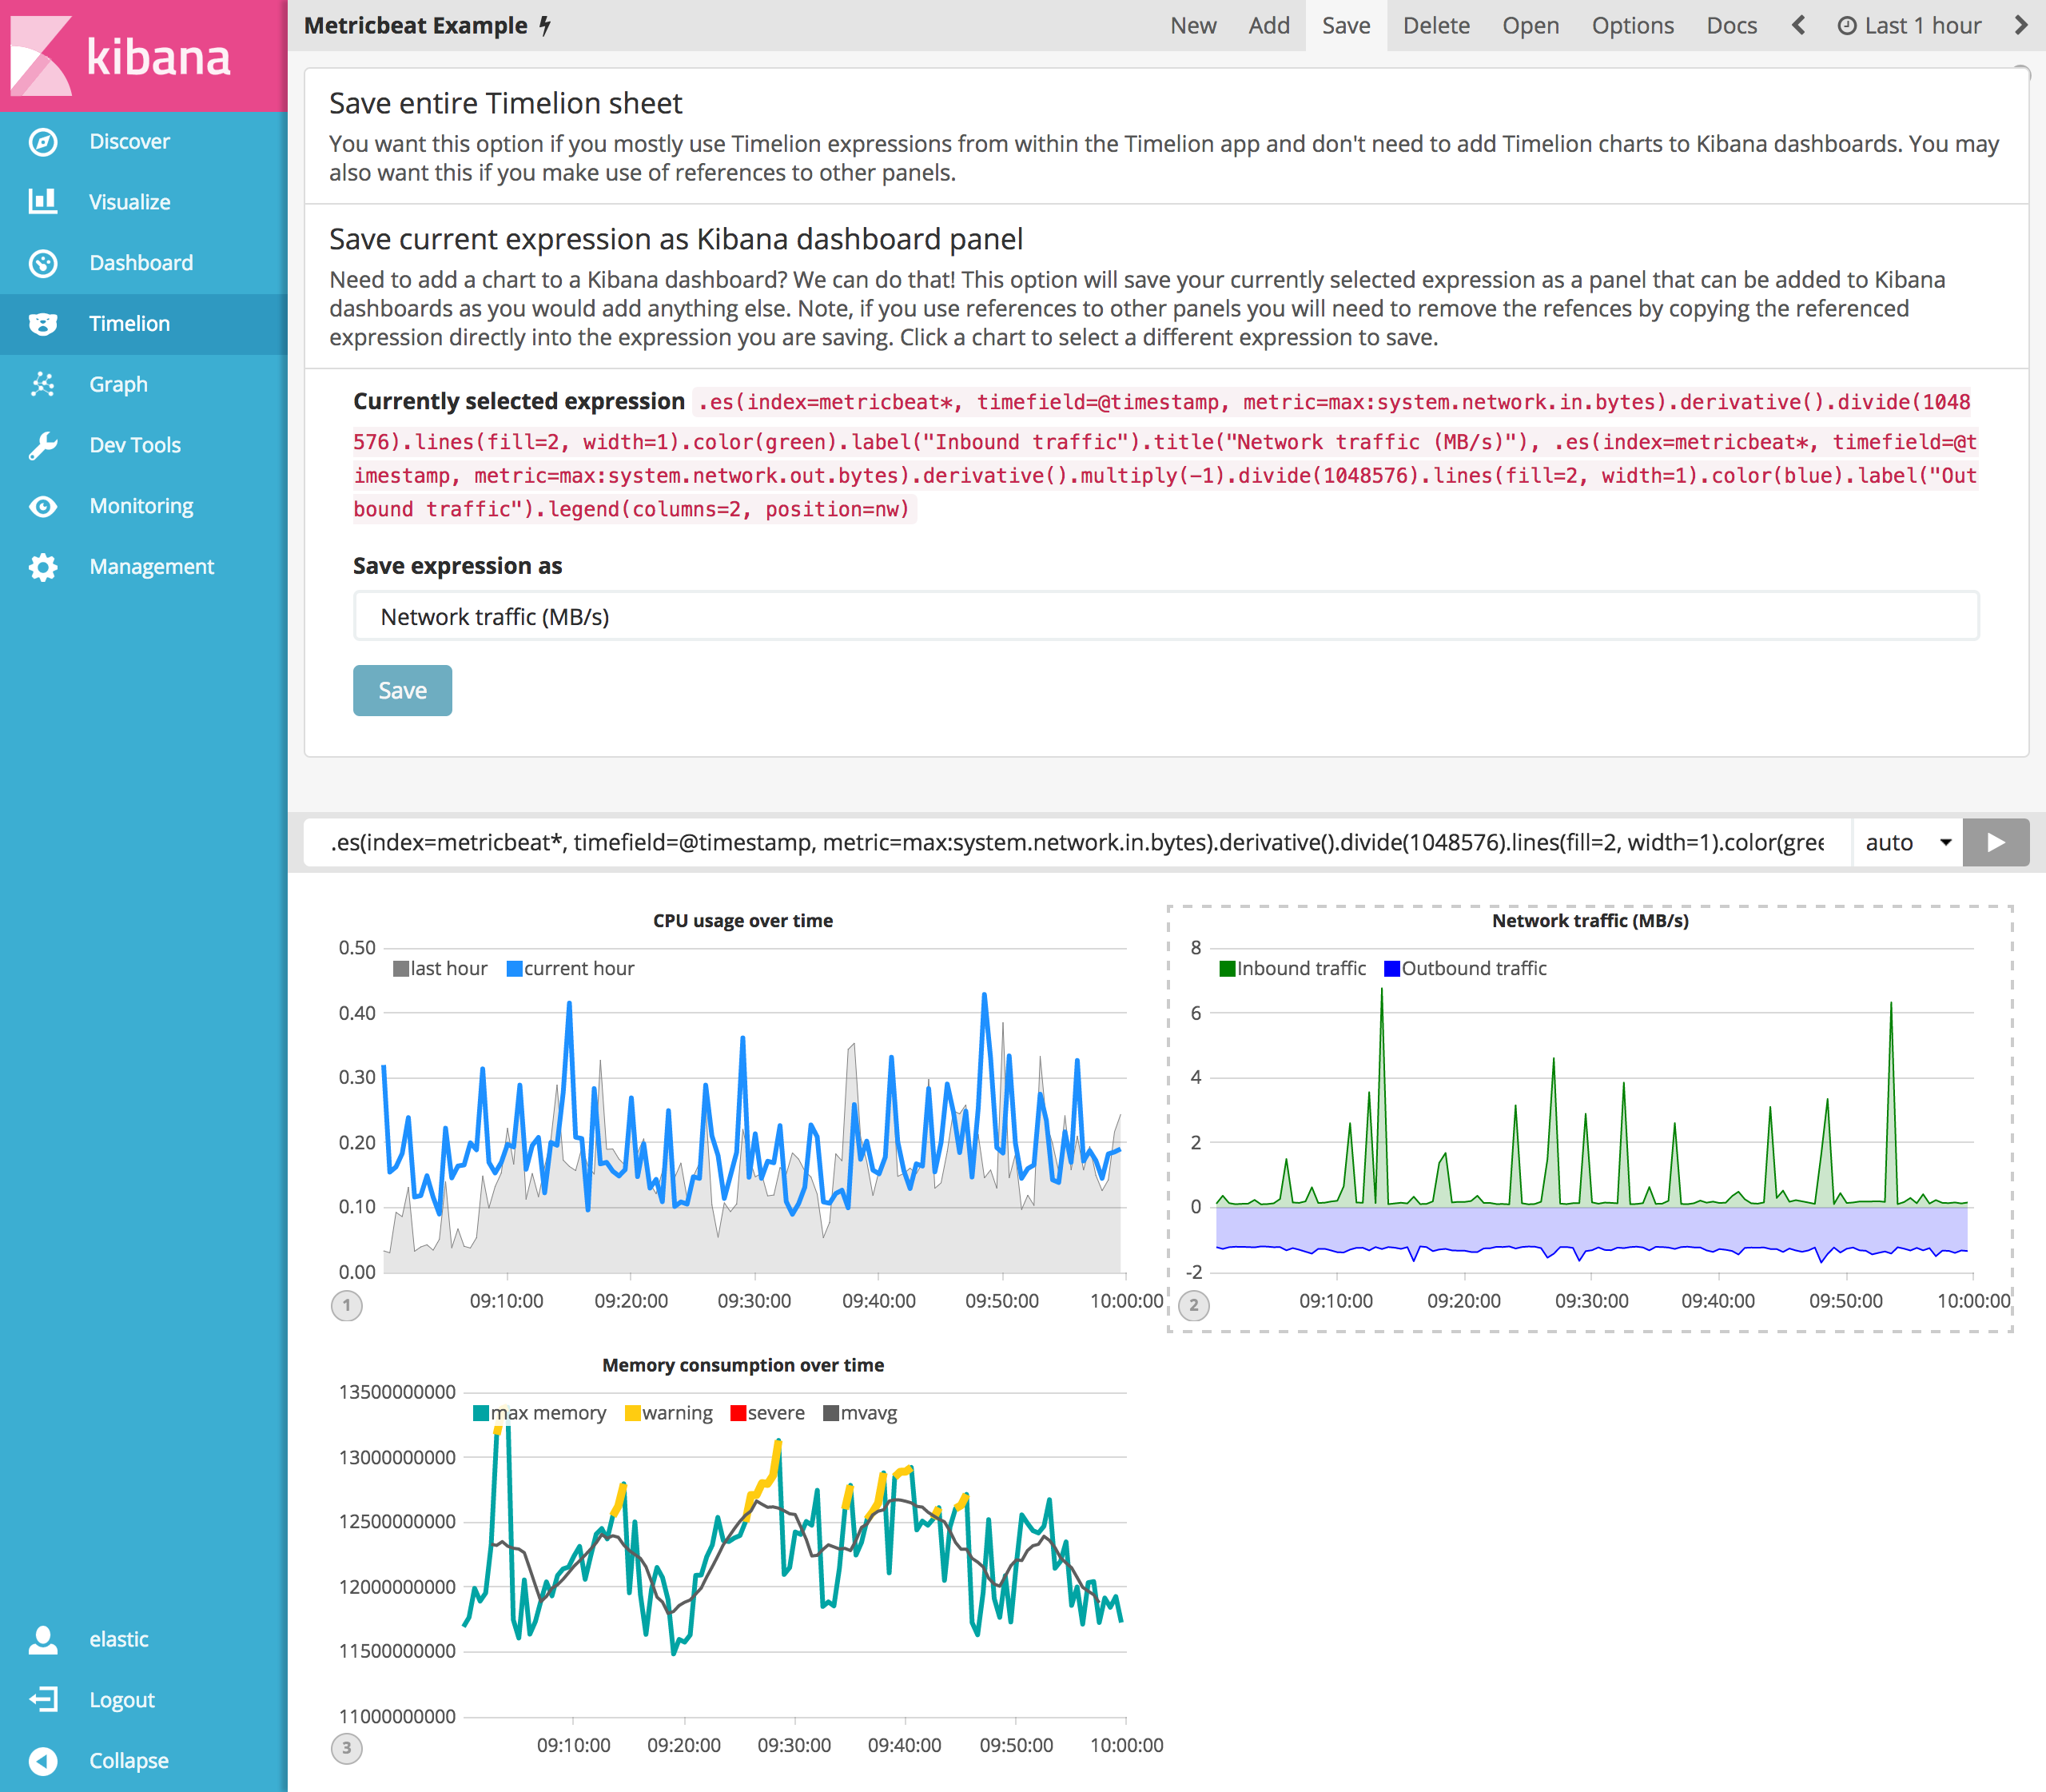
To save a Timelion visualization as a dashboard panel, follow the steps below.
- Select the visualization you’d like to add to one (or multiple) dashboards
-
Click the
Saveoption in the top menu -
Select
Save current expression as Kibana dashboard panel -
Name your panel and and click
Saveto save as a dashboard visualization
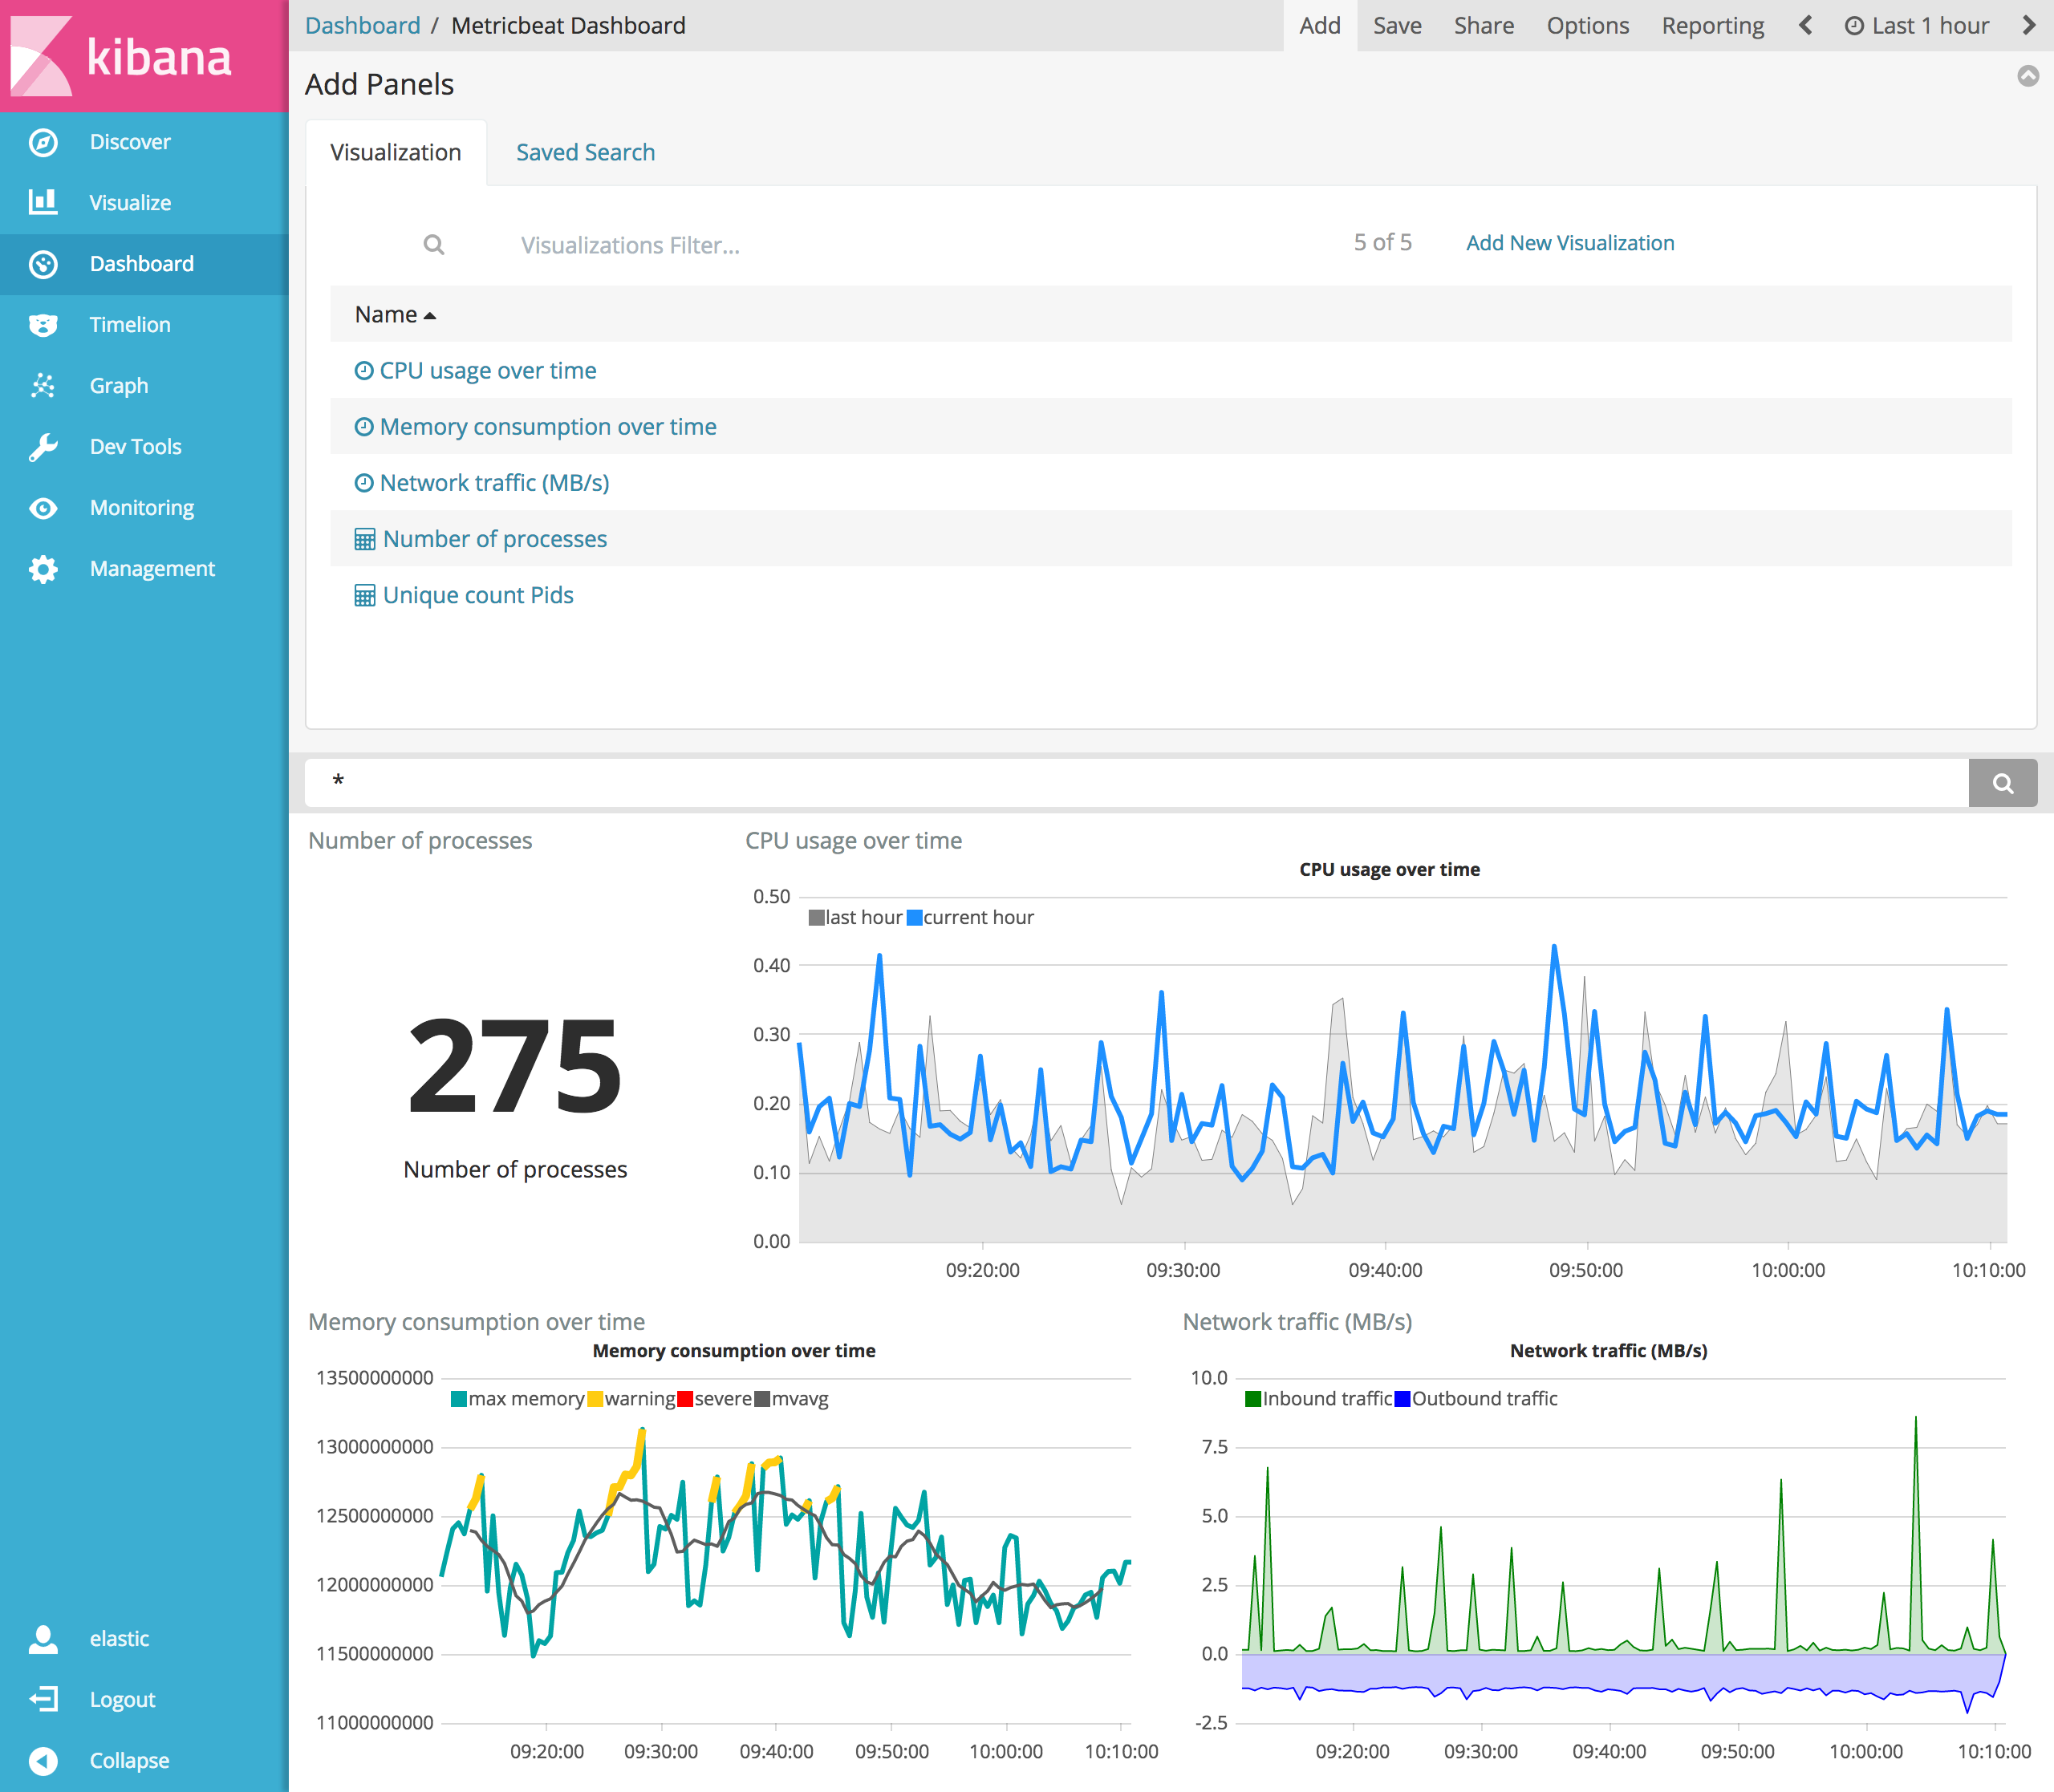
Now you can add this dashboard panel to any dashboard you’d like. This visualization will now be listed in the Visualize list. Go ahead and follow the same process for the rest of the visualizations you created.
Create a new dashboard or open an existing one to add the Timelion visualizations as you would any other visualization.
You can also create time series visualizations right from the Visualize app—just select the Timeseries visualization type and enter a Timelion expression in the expression field.