WARNING: Version 4.1 of Kibana has passed its EOL date.
This documentation is no longer being maintained and may be removed. If you are running this version, we strongly advise you to upgrade. For the latest information, see the current release documentation.
Putting it all Together with Dashboards
editPutting it all Together with Dashboards
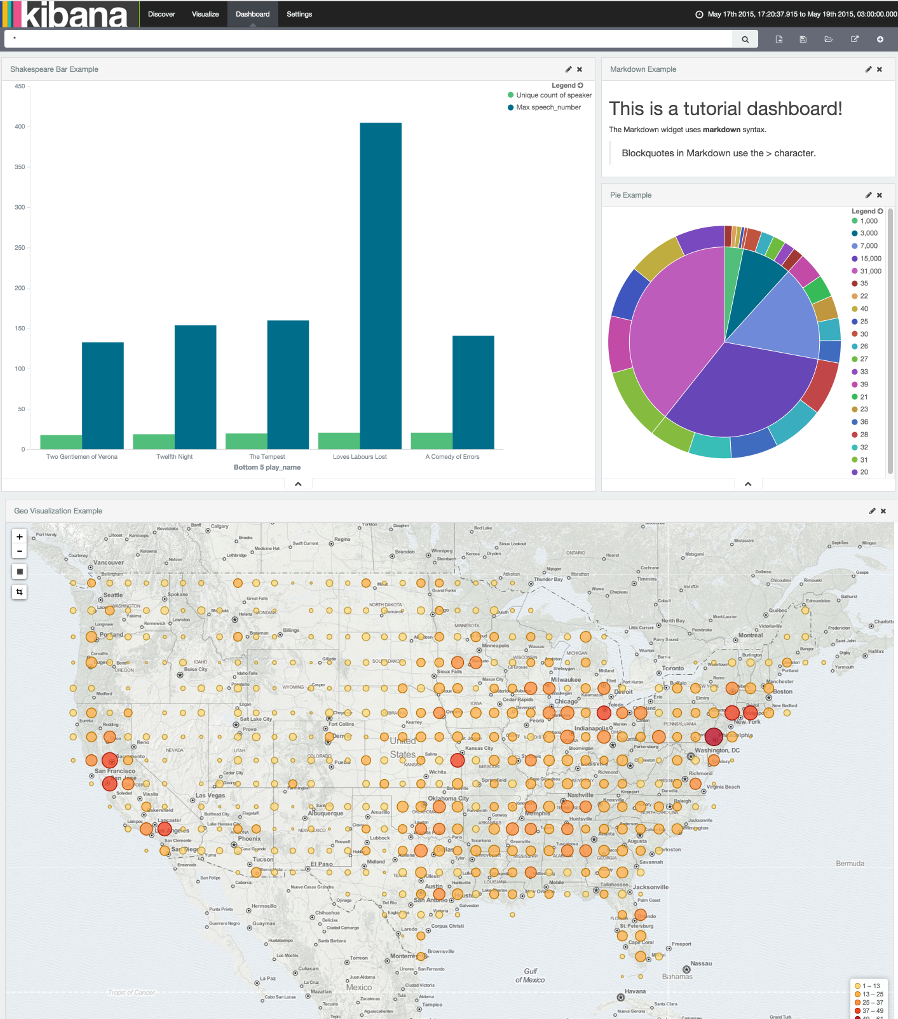
editA Kibana dashboard is a collection of visualizations that you can arrange and share. To get started, click the Dashboard tab, then the Add Visualization button at the far right of the search box to display the list of saved visualizations. Select Markdown Example, Pie Example, Bar Example, and Map Example, then close the list of visualizations by clicking the small up-arrow at the bottom of the list. You can move the containers for each visualization by clicking and dragging the title bar. Resize the containers by dragging the lower right corner of a visualization’s container. Your sample dashboard should end up looking roughly like this:
Click the Save Dashboard button, then name the dashboard Tutorial Dashboard. You can share a saved dashboard by clicking the Share button to display HTML embedding code as well as a direct link.
Wrapping Up
editNow that you’ve handled the basic aspects of Kibana’s functionality, you’re ready to explore Kibana in further detail. Take a look at the rest of the documentation for more details!