Introduction
editIntroduction
editGraph provides a way to discover how items in an Elasticsearch index are related. You can explore the connections between indexed terms and see which connections are the most meaningful. This can be useful in a variety of applications, from fraud detection to recommendation engines.
For example, you might use Graph to uncover website vulnerabilities that hackers are targeting so you can harden your website. Or, you might provide Graph-based personalized recommendations to your e-commerce customers.
Graph consists of two components: an Elasticsearch plugin that provides a simple, yet powerful graph exploration API, and a Kibana plugin that provides an interactive Graph visualization tool.
You can use Graph with your existing Elasticsearch indices—simply install it and start exploring!
How Graph Works
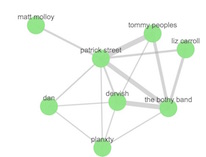
editGraph provides an alternative way to extract and summarize information about the documents and terms in your Elasticsearch index. A graph is really just a network of related items. In our case, this means a network of related terms in the index.
In the Graph API, the terms you want to include in the graph are called vertices. The relationship between any two vertices is a connection. The connection summarizes the documents that contain both vertices' terms.
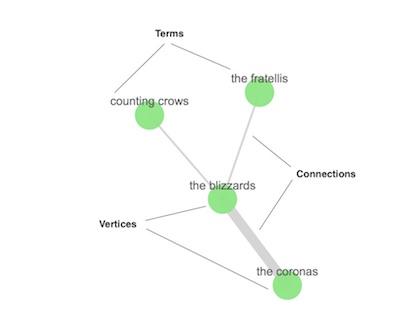
If you’re into Graph theory, you might know vertices and connections as nodes and edges. They’re the same thing, we just want to use terminology that makes sense to people who aren’t graph geeks and avoid any confusion with the nodes in an Elasticsearch cluster.
The beauty of Graph is that it works out of the box with existing Elasticsearch indices and doesn’t require you to store any additional data. How? The vertices are simply the terms that you’ve already indexed. The connections are derived on the fly using Elasticsearch aggregations. What’s more, Graph is able to identify the most meaningful connections by taking advantage of Elasticsearch relevance scoring. The same data structures and relevance ranking tools built into Elasticsearch to support text searches enable the Graph API to separate useful signals from the noise that is typical of most connected data.
This foundation lets you easily answer questions like:
- What are the shared behaviors of people trying to hack my website?
- If users bought this type of gardening gloves, what other products might they be interested in?
- Which people on Stack Overflow have expertise in both Hadoop-related technologies and Python-related tech?
But what about performance, you ask? The Elasticsearch aggregation framework enables Graph to quickly summarize millions of documents as a single super-connection. Instead of retrieving every banking transaction between accounts A and B, Graph can derive a single connection that represents that relationship. And, of course, this summarization process works across multi-node clusters and scales with your Elasticsearch deployment. Advanced options let you control how Graph samples and summarizes the data. You can also set timeouts to prevent Graph queries from adversely affecting the cluster.
Visualizing Connections with Graph
editThe Graph plugin for Kibana lets you interactively explore connections within your data. This is a great way to get acquainted with what the Graph API has to offer.
When you open the Graph app, getting started is as easy as 1, 2, 3:
- Select an index.
- Select a multi-value field that contains the terms you want to graph. (The vertices in the graph will be selected from these terms.)
- Enter a search query to discover relationships between terms in the selected field.
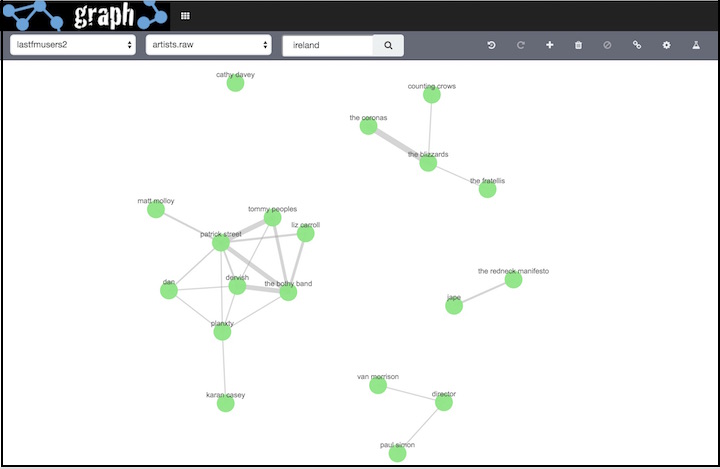
For example, we indexed user data from Last.fm that contains the top artists played by each user. To use the Graph UI to find artists we might like, we can select the Last.fm index, select the field that contains the raw artist information, and search for an artist we like:
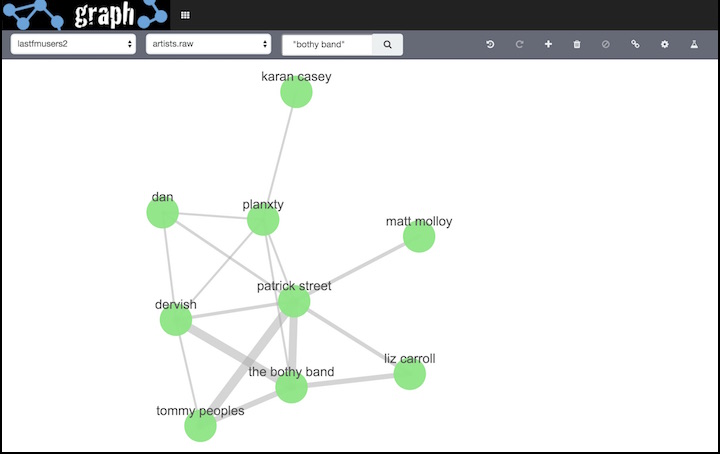
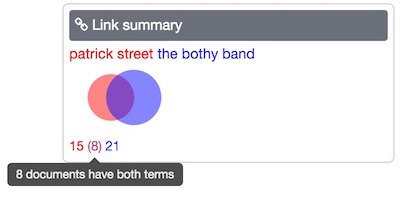
The weight of the connection between two vertices indicates how strongly they are related. You can click any connection to view more information about the relationship:
Once you have your initial graph, you can use the toolbar buttons to explore additional connections. Click the Expand button  to display additional vertices that connect to your graph. Click the Link button
  to display additional connections between the displayed vertices. To explore a particular area of the graph, select the vertices you are interested in and click the Expand or Link button. To step back through your changes to the graph, click the Undo button
  .
.
To see more relationships within your data, you can submit additional queries.
By default, when you submit a search query Graph searches all available fields. You can constrain your search to a particular field using the Lucene query syntax. For example,
country: ireland.
To access advanced features such as visualizing connections across multiple fields and grouping vertices, click the Advanced button  .
.
Where to Go Next
edit- Getting Started
- Install the Graph plugin and Kibana app to start exploring relationships in your data.
Have Comments, Questions, or Feedback?
editHead over to our Graph Discussion Forum to share your experience, questions, and suggestions.