Troubleshoot common problems
editTroubleshoot common problemsedit
We have collected the most common known problems and listed them here. If your problem is not described here, please review the open issues in the following GitHub repositories:
| Repository | To review or report issues about |
|---|---|
Fleet and Integrations UI |
|
Elastic Agent |
|
Beats shippers |
|
Fleet Server |
|
Elastic Package Registry |
|
Documentation issues |
Have a question? Read our FAQ, or contact us in the discuss forum. Your feedback is valuable to us.
Running Elastic Agent standalone? Also refer to Debug standalone Elastic Agents.
Troubleshooting contentsedit
Find troubleshooting information for Fleet, Fleet Server, and Elastic Agent in the following documentation:
- Elastic Agent unenroll fails
- illegal_argument_exception when TSDB is enabled
-
Elastic Agents hosted on Elastic Cloud are stuck in
UpdatingorOffline - When using Elastic Cloud, Fleet Server is not listed in Kibana
-
The
/api/fleet/setupendpoint can’t reach the package registry - Kibana cannot connect to Elastic Package Registry in air-gapped environments
- Fleet in Kibana crashes
-
Elastic Agent enrollment fails on the host with
x509: certificate signed by unknown authoritymessage -
Elastic Agent enrollment fails on the host with
x509: cannot validate certificate for x.x.x.x because it doesn't contain any IP SANsmessage -
Elastic Agent enrollment fails on the host with
Client.Timeout exceededmessage - Many Fleet Server problems can be triaged and fixed with the below tips
- Retrieve the Elastic Agent version
- Check the Elastic Agent status
- Collect Elastic Agent diagnostics bundle
- Some problems occur so early that insufficient logging is available
-
The Elastic Agent is cited as
Healthybut still has set up problems sending data to Elasticsearch -
Elastic Agent is stuck in status
Updating - Fleet Server is running and healthy with data, but other Agents cannot use it to connect to Elasticsearch
-
Elasticsearch authentication service fails with
Authentication using apikey failedmessage -
Elastic Agent fails with
Agent process is not root/admin or validation failedmessage - Integration policy upgrade has too many conflicts
- Elastic Agent hangs while unenrolling
-
On Fleet Server startup, ERROR seen with
State changed to CRASHED: exited with code: 1 - Uninstalling Elastic Endpoint fails
-
API key is unauthorized to send telemetry to
.logs-endpoint.diagnostic.collection-*indices - Hosted Elastic Agent is offline
- APM & Fleet fails to upgrade to 8.x on Elastic Cloud
- Air-gapped Elastic Agent upgrade can fail due to an inaccessible PGP key
- Elastic Agents are unable to connect after removing the Fleet Server integration
- Elastic Agent Out of Memory errors on Kubernetes
Elastic Agent unenroll failsedit
In Fleet, if you delete an Elastic Agent policy that is associated with one or more inactive enrolled agents, when the agent returns back to a Healthy or Offline state, it cannot be unenrolled. Attempting to unenroll the agent results in an Error unenrolling agent message, and the unenrollment fails.
To resolve this problem, you can use the Kibana Fleet APIs to force unenroll the agent.
To uninstall a single Elastic Agent:
POST kbn:/api/fleet/agents/<agent_id>/unenroll
{
  "force": true,
  "revoke": true
}
To bulk uninstall a set of Elastic Agents:
POST kbn:/api/fleet/agents/bulk_unenroll
{ "agents": ["<agent_id1>", "<agent-id2>"],
  "force": true,
  "revoke": true
}
We are also updating the Fleet UI to prevent removal of an Elastic Agent policy that is currently associated with any inactive agents.
illegal_argument_exception when TSDB is enablededit
When you use an Elastic Agent integration in which TSDB (Time Series Database) is enabled, you may encounter an illegal_argument_exception error in the Fleet UI.
This can occur if you have a component template defined that includes a _source attribute, which conflicts with the _source: synthetic setting used when TSDB is enabled.
For details about the error and how to resolve it, refer to the section Runtime fields cannot be used in TSDB indices in the Innovation Hub article TSDB enabled integrations for Elastic Agent.
Elastic Agents hosted on Elastic Cloud are stuck in Updating or Offlineedit
In Elastic Cloud, after upgrading Fleet Server and its integration policies, agents enrolled in the Elastic Cloud agent policy may experience issues updating. To resolve this problem:
-
In a terminal window, run the following
cURLrequest, providing your Kibana superuser credentials to reset the Elastic Cloud agent policy.-
On Kibana versions 8.11 and later, run:
curl -u <username>:<password> --request POST \
  --url <kibana_url>/internal/fleet/reset_preconfigured_agent_policies/policy-elastic-agent-on-cloud \
  --header 'content-type: application/json' \
  --header 'kbn-xsrf: xyz' \
  --header 'elastic-api-version: 1'
-
On Kibana versions earlier than 8.11, run:
curl -u <username>:<password> --request POST \
  --url <kibana_url>/internal/fleet/reset_preconfigured_agent_policies/policy-elastic-agent-on-cloud \
  --header 'content-type: application/json' \
  --header 'kbn-xsrf: xyz'
-
-
Force unenroll the agent stuck in
Updating:- To find agent’s ID, go to Fleet > Agents and click the agent to see its details. Copy the Agent ID.
-
In a terminal window, run:
curl -u <username>:<password> --request POST \
  --url <kibana_url>/api/fleet/agents/<agentID>/unenroll \
  --header 'content-type: application/json' \
  --header 'kbn-xsrf: xx' \
  --data-raw '{"force":true,"revoke":true}' \
  --compressed
Where
<agentID>is the ID you copied in the previous step.
-
Restart the Integrations Server:
In the Elastic Cloud console under Integrations Server, click Force Restart.
When using Elastic Cloud, Fleet Server is not listed in Kibanaedit
If you are unable to see Fleet Server in Kibana, make sure it’s set up.
To set up Fleet Server on Elastic Cloud:
- Go to your deployment on Elastic Cloud.
- Follow the Elastic Cloud prompts to set up Integrations Server. Once complete, the Fleet Server Elastic Agent will show up in Fleet.
To enable Fleet and set up Fleet Server on a self-managed cluster:
-
In the Elasticsearch configuration file,
config/elasticsearch.yml, set the following security settings to enable security and API keys:xpack.security.enabled: true xpack.security.authc.api_key.enabled: true
-
In the Kibana configuration file,
config/kibana.yml, enable Fleet and specify your user credentials:xpack.encryptedSavedObjects.encryptionKey: "something_at_least_32_characters" elasticsearch.username: "my_username" elasticsearch.password: "my_password"
To set up passwords, you can use the documented Elasticsearch APIs or the
elasticsearch-setup-passwordscommand. For example,./bin/elasticsearch-setup-passwords autoAfter running the command:
- Copy the Elastic user name to the Kibana configuration file.
- Restart Kibana.
- Follow the documented steps for setting up a self-managed Fleet Server. For more information, refer to What is Fleet Server?.
The /api/fleet/setup endpoint can’t reach the package registryedit
To install Integrations, the Fleet app requires a connection to an external service called the Elastic Package Registry.
For this to work, the Kibana server must connect to https://epr.elastic.co on port 443.
Kibana cannot connect to Elastic Package Registry in air-gapped environmentsedit
In air-gapped environments, you may encounter the following error if you’re using a custom Certificate Authority (CA) that is not available to Kibana:
{"type":"log","@timestamp":"2022-03-02T09:58:36-05:00","tags":["error","plugins","fleet"],"pid":58716,"message":"Error connecting to package registry: request to https://customer.server.name:8443/categories?experimental=true&include_policy_templates=true&kibana.version=7.17.0 failed, reason: self signed certificate in certificate chain"}
To fix this problem, add your CA certificate file path to the Kibana startup
file by defining the NODE_EXTRA_CA_CERTS environment variable. More information
about this in TLS configuration of the Elastic Package Registry section.
Fleet in Kibana crashesedit
- To investigate the error, open your browser’s development console.
-
Select the Network tab, and refresh the page.
One of the requests to the Fleet API will most likely have returned an error. If the error message doesn’t give you enough information to fix the problem, please contact us in the discuss forum.
Elastic Agent enrollment fails on the host with x509: certificate signed by unknown authority messageedit
To ensure that communication with Fleet Server is encrypted, Fleet Server requires Elastic Agents to present a signed certificate. In a self-managed cluster, if you don’t specify certificates when you set up Fleet Server, self-signed certificates are generated automatically.
If you attempt to enroll an Elastic Agent in a Fleet Server with a self-signed certificate, you will encounter the following error:
Error: fail to enroll: fail to execute request to fleet-server: x509: certificate signed by unknown authority
Error: enroll command failed with exit code: 1
To fix this problem, pass the --insecure flag along with the enroll or
install command. For example:
sudo ./elastic-agent install --url=https://<fleet-server-ip>:8220 --enrollment-token=<token> --insecure
Traffic between Elastic Agents and Fleet Server over HTTPS will be encrypted; you’re simply acknowledging that you understand that the certificate chain cannot be verified.
Allowing Fleet Server to generate self-signed certificates is useful to get things running for development, but not recommended in a production environment.
For more information, refer to Configure SSL/TLS for self-managed Fleet Servers.
Elastic Agent enrollment fails on the host with x509: cannot validate certificate for x.x.x.x because it doesn't contain any IP SANs messageedit
To ensure that communication with Elasticsearch is encrypted, Fleet Server requires Elasticsearch to present a signed certificate.
This error occurs when you use self-signed certificates with Elasticsearch using IP as a Common Name (CN).
With IP as a CN, Fleet Server looks into subject alternative names (SANs), which is empty. To work
around this situation, use the --fleet-server-es-insecure flag to disable certificate verification.
You will also need to set ssl.verification_mode: none in the Output settings in Fleet and Integrations UI.
Elastic Agent enrollment fails on the host with Client.Timeout exceeded messageedit
To enroll in Fleet, Elastic Agent must connect to the Fleet Server instance. If the agent is unable to connect, you see the following failure:
fail to enroll: fail to execute request to {fleet-server}:Post http://fleet-server:8220/api/fleet/agents/enroll?: net/http: request canceled while waiting for connection (Client.Timeout exceeded while awaiting headers)
Here are several steps to help you troubleshoot the problem.
-
Check for networking problems. From the host, run the
pingcommand to confirm that it can reach the Fleet Server instance. -
Additionally,
curlthe/statusAPI of Fleet Server:curl -f http://<fleet-server-url>:8220/api/status
-
Verify that you have specified the correct Kibana Fleet settings URL and port for your environment.
By default, HTTPS protocol and port 8220 is expected by Fleet Server to communicate with Elasticsearch unless you have explicitly set it otherwise.
-
Check that you specified a valid enrollment key during enrollment. To do this:
- In Fleet, select Enrollment tokens.
- To view the secret, click the eyeball icon. The secret should match the string that you used to enroll Elastic Agent on your host.
-
If the secret doesn’t match, create a new enrollment token and use this
token when you run the
elastic-agent enrollcommand.
Many Fleet Server problems can be triaged and fixed with the below tipsedit
When creating an issue or sending a support forum communication, this section can help you identify what is required.
Fleet Server allows Elastic Agent to connect to Elasticsearch, which is the same as the connection to Kibana in prior releases. However, because Fleet Server is on the edge host, it may result in additional networking setup and troubleshooting.
Retrieve the Elastic Agent versionedit
-
If you installed the Elastic Agent, run the following command (the example is for POSIX based systems):
elastic-agent version
-
If you have not installed the Elastic Agent and you are running it as a temporary process, you can run:
./elastic-agent version
Both of the above commands are accessible via Windows or macOS with their OS-specific slight variation in how you call them. If needed, please refer to Install Elastic Agents for examples of how to adjust them.
Check the Elastic Agent statusedit
Run the following command to view the current status of the Elastic Agent.
elastic-agent status
Based on the information returned, you can take further action.
If Elastic Agent is running, but you do not see what you expect, here are some items to review:
- In Fleet, click Agents. Check which policy is associated with the running Elastic Agent. If it is not the policy you expected, you can change it.
-
In Fleet, click Agents, and then select the Elastic Agent policy. Check for the integrations that should be included.
For example, if you want to include system data, make sure the System integration is included in the policy.
-
Confirm if the Collect agent logs and Collect agent metrics options are selected.
- In Fleet, click Agents, and then select the Elastic Agent policy.
-
Select the Settings tab. If you want to collect agent logs or metrics, select these options.
The Elastic Cloud agent policy is created only in Elastic Cloud deployments and, by default, does not include the collection of logs of metrics.
Collect Elastic Agent diagnostics bundleedit
The Elastic Agent diagnostics bundle collects the following information:
- Elastic Agent versions numbers
- Beats (and other process) version numbers and process metadata
- Local configuration, elastic-agent policy, and the configuration that is rendered and passed to Beats and other processes
- Elastic Agent’s local log files
- Elastic Agent and Beats pprof profiles
Note that the diagnostics bundle is intended for debugging purposes only, its structure may change between releases.
Elastic Agent attempts to automatically redact credentials and API keys when creating diagnostics. Please review the contents of the archive before sharing to ensure that there are no credentials in plain text.
Get the diagnostics bundle using the CLI
Run the following command to generate a zip archive containing diagnostics information that the Elastic team can use for debugging cases.
elastic-agent diagnostics
Get the diagnostics bundle through Fleet
Fleet provides the ability to remotely generate and gather an Elastic Agent’s diagnostics bundle.
An agent can gather and upload diagnostics if it is online in a Healthy or Unhealthy state. The diagnostics are sent to Fleet Server which in turn adds it into Elasticsearch. Therefore, this works even with Elastic Agents that are not using the Elasticsearch output.
To download the diagnostics bundle for local viewing:
- In Fleet, open the Agents tab.
- In the Host column, click the agent’s name.
- Click the Diagnostics tab.
-
Click the Request diagnostics .zip button.
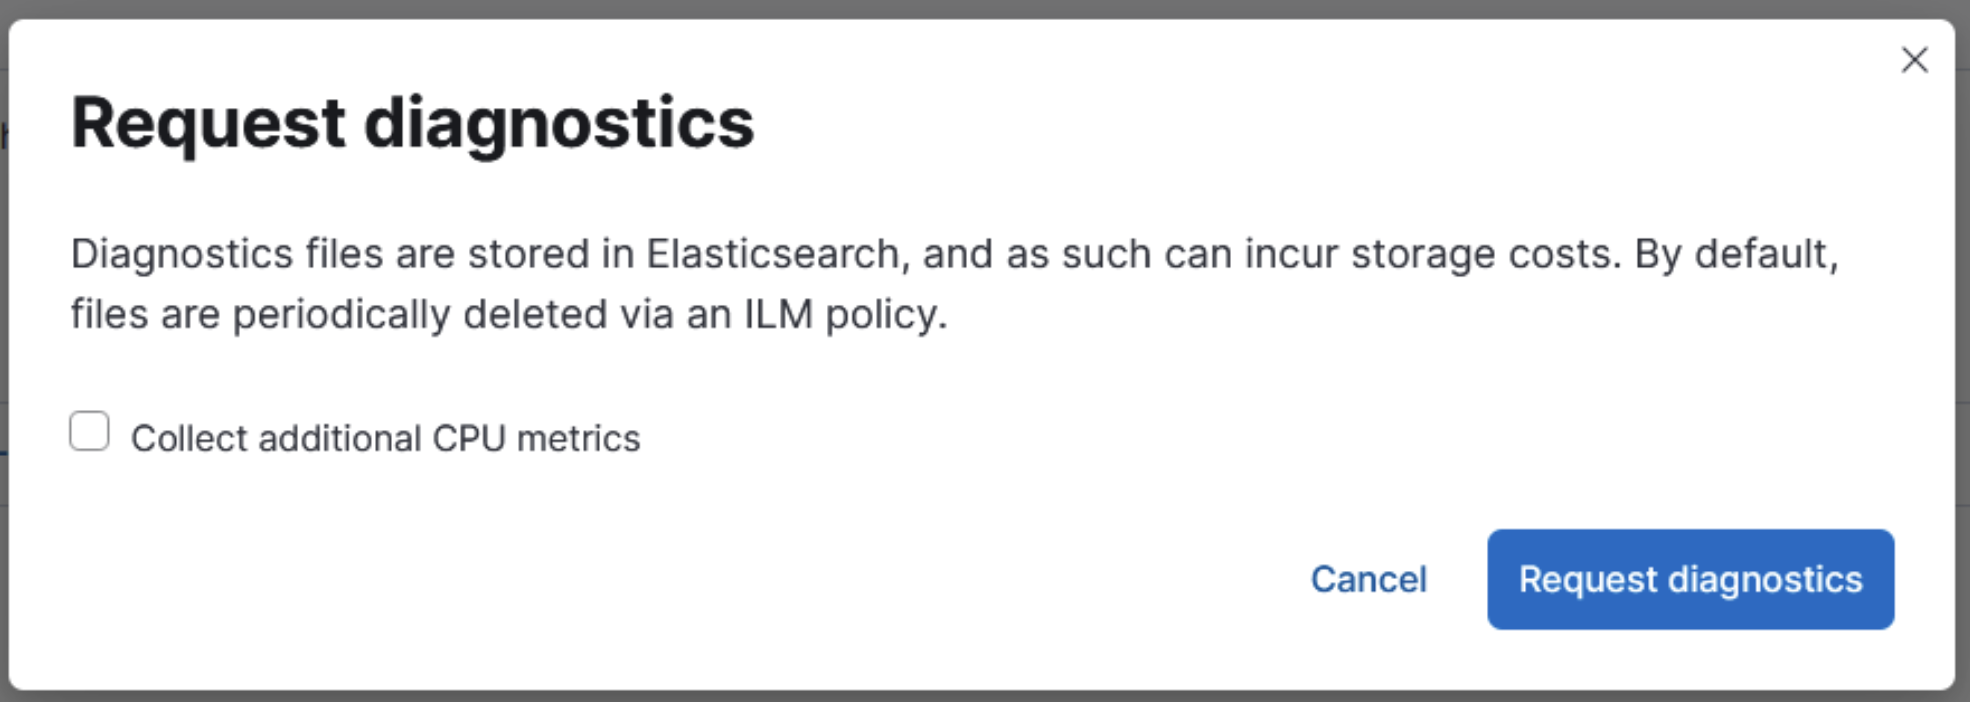
Any in-progress or previously collected bundles for the Elastic Agent will be listed on this page.
Note that the bundles are stored in Elasticsearch and will be removed after 30 days.
Some problems occur so early that insufficient logging is availableedit
If some problems occur early and insufficient logging is available, run the following command:
./elastic-agent install -f
The stand-alone install command installs the Elastic Agent, and all of the service configuration is set up. You can now run the enrollment command. For example:
elastic-agent enroll --fleet-server-es=https://<es-url>:443 --fleet-server-service-token=<token> --fleet-server-policy=<policy-id>
Note: Port 443 is commonly used in Elastic Cloud. However, with self-managed deployments, your Elasticsearch may run on port 9200 or something entirely different.
For information on where to find agent logs, refer to our FAQ.
The Elastic Agent is cited as Healthy but still has set up problems sending data to Elasticsearchedit
-
To confirm that the Elastic Agent is running and its status is
Healthy, select the Agents tab.If you previously selected the Collect agent logs option, you can now look at the agent logs.
-
Click the agent name and then select the Logs tab.
If there are no logs displayed, it suggests a communication problem between your host and Elasticsearch. The possible reason for this is that the port is already in use.
-
You can check the port usage using tools like Wireshark or netstat. On a POSIX system, you can run the following command:
netstat -nat | grep :8220
Any response data indicates that the port is in use. This could be correct or not if you had intended to uninstall the Fleet Server. In which case, re-check and continue.
Elastic Agent is stuck in status Updatingedit
Beginning in Elastic Stack version 8.11, a stuck Elastic Agent upgrade should be detected automatically, and you can restart the upgrade from Fleet.
Fleet Server is running and healthy with data, but other Agents cannot use it to connect to Elasticsearchedit
Some settings are only used when you have multiple Elastic Agents. If this is the case, it may help to check that the hosts can communicate with the Fleet Server.
From the non-Fleet Server host, run the following command:
curl -f http://<fleet-server-ip>:8220/api/status
The response may yield errors that you can be debug further, or it may work and show that communication ports and networking are not the problems.
One common problem is that the default Fleet Server port of 8220 isn’t open on the Fleet Server
host to communicate. You can review and correct this using common tools in alignment with any
networking and security concerns you may have.
Elasticsearch authentication service fails with Authentication using apikey failed messageedit
To save API keys and encrypt them in Elasticsearch, Fleet requires an encryption key.
To provide an API key, in the kibana.yml configuration file, set the xpack.encryptedSavedObjects.encryptionKey property.
xpack.encryptedSavedObjects.encryptionKey: "something_at_least_32_characters"
Elastic Agent fails with Agent process is not root/admin or validation failed messageedit
Ensure the user running Elastic Agent has root privileges as some integrations require root privileges to collect sensitive data.
If you’re running Elastic Agent in the foreground (and not as a service) on Linux or macOS, run the
agent under the root user: sudo or su.
If you’re using the Elastic Defend integration, make sure you’re running Elastic Agent under the SYSTEM account.
If you install Elastic Agent as a service as described in Install Elastic Agents, Elastic Agent runs under the SYSTEM account by default.
To run Elastic Agent under the SYSTEM account, you can do the following:
-
Download PsExec
and extract the contents to a folder. For example,
d:\tools. - Open a command prompt as an Administrator (right-click the command prompt icon and select Run As Administrator).
-
From the command prompt, run Elastic Agent under the SYSTEM account:
d:\tools\psexec.exe -sid "C:\Program Files\Elastic-Agent\elastic-agent.exe" run
Integration policy upgrade has too many conflictsedit
If you try to upgrade an integration policy that is several versions old, there may be substantial conflicts or configuration issues. Rather than trying to fix these problems, it might be faster to create a new policy, test it, and roll out the integration upgrade to additional hosts.
After upgrading the integration:
- Create a new policy.
- Add the integration to the policy. The newer version is automatically used.
-
Apply the policy to an Elastic Agent.
In larger deployments, you should test integration upgrades on a sample Elastic Agent before rolling out a larger upgrade initiative. Only after a small trial is deemed successful should the updated policy be rolled out all hosts.
-
Roll out the integration update to additional hosts:
- In Fleet, click Agent policies. Click on the name of the policy you want to edit.
- Search or scroll to a specific integration. Open the Actions menu and select Delete integration.
- Click Add integration and re-add the freshly deleted integration. The updated version will be used and applied to all Elastic Agents.
-
Repeat this process for each policy with the out-of-date integration.
In some instances, for example, when there are hundreds or thousands of different Elastic Agents and policies that need to be updated, this upgrade path is not feasible. In this case, update one policy and use the Copy a policy action to apply the updated policy versions to additional policies. This method’s downside is losing the granularity of assessing the individual Integration version changes individually across policies.
Elastic Agent hangs while unenrollingedit
When unenrolling Elastic Agent, Fleet waits for acknowledgment from the agent
before it completes the unenroll process. If Fleet doesn’t receive an
acknowledgment, the status hangs at unenrolling.
You can unenroll an agent to invalidate all API keys related to the agent and change the status to
inactive so that the agent no longer appears in Fleet.
- In Fleet, select Agents.
- Under Agents, choose Unenroll agent from the Actions menu next to the agent you want to unenroll.
- Click Force unenroll.
On Fleet Server startup, ERROR seen with State changed to CRASHED: exited with code: 1edit
You may see this error message for a number of different reasons. A common reason is when attempting production-like usage and the ca.crt file passed in cannot be found. To verify if this is the problem, bootstrap Fleet Server without passing a ca.crt file. This implies you would test any subsequent Elastic Agent installs temporarily with {fleet-sever}'s own self-signed cert.
Ensure to pass in the full path to the ca.crt file. A relative path is not viable.
You will know if your Fleet Server is set up with its testing oriented self-signed certificate usage, when you see the following error during Elastic Agent installs:
Error: fail to enroll: fail to execute request to fleet-server: x509: certificate signed by unknown authority
Error: enroll command failed with exit code: 1
To install or enroll against a self-signed cert Fleet Server Elastic Agent, add in the --insecure option to the
command:
sudo ./elastic-agent install --url=https://<fleet-server-ip>:8220 --enrollment-token=<token> --insecure
For more information, refer to Elastic Agent enrollment fails on the host with x509: certificate signed by unknown authority message.
Uninstalling Elastic Endpoint failsedit
When you uninstall Elastic Agent, all the programs managed by Elastic Agent, such as Elastic Endpoint, are also removed. If uninstalling fails, Elastic Endpoint might remain on your system.
To remove Elastic Endpoint, run the following commands:
cd /tmp
cp /Library/Elastic/Endpoint/elastic-endpoint elastic-endpoint
sudo ./elastic-endpoint uninstall
rm elastic-endpoint
cd /tmp
cp /opt/Elastic/Endpoint/elastic-endpoint elastic-endpoint
sudo ./elastic-endpoint uninstall
rm elastic-endpoint
cd %TEMP%
copy "c:\Program Files\Elastic\Endpoint\elastic-endpoint.exe" elastic-endpoint.exe
.\elastic-endpoint.exe uninstall
del .\elastic-endpoint.exe
API key is unauthorized to send telemetry to .logs-endpoint.diagnostic.collection-* indicesedit
By default, telemetry is turned on in the Elastic Stack to helps us learn about the features that our users are most interested in. This helps us to focus our efforts on making features even better.
If you’ve recently upgraded from version 7.10 to 7.11, you might see the
following message when you view Elastic Defend logs:
action [indices:admin/auto_create] is unauthorized for API key id [KbvCi3YB96EBa6C9k2Cm]
of user [fleet_enroll] on indices [.logs-endpoint.diagnostic.collection-default]
The above message indicates that Elastic Endpoint does not have the correct permissions to send telemetry. This is a known problem in 7.11 that will be fixed in an upcoming patch release.
To remove this message from your logs, you can turn off telemetry for the Elastic Defend integration until the next patch release is available.
- In Kibana, click Integrations, and then select the Manage tab.
- Click Elastic Defend, and then select the Policies tab to view all the installed integrations.
- Click the integration to edit it.
-
Under advanced settings, set
windows.advanced.diagnostic.enabledtofalse, and then save the integration.
Hosted Elastic Agent is offlineedit
To scale the Fleet Server deployment, Elastic Cloud starts new containers or shuts down old ones when hosted Elastic Agents are required or no longer needed. The old Elastic Agents will show in the Agents list for 24 hours then automatically disappear.
Elastic Agent fails to enroll with Fleet Server running on localhost.edit
If you’re testing Fleet Server locally on a macOS system using localhost (https://127.0.0.1:8220) as the Host URL, you may encounter this error:
Error: fail to enroll: fail to execute request to fleet-server:
lookup My-MacBook-Pro.local: no such host
This can occur on newer macOS software. To resolve the problem, ensure that file sharing is enabled on your local system.
APM & Fleet fails to upgrade to 8.x on Elastic Cloudedit
In some scenarios, upgrading APM & Fleet to 8.x may fail if the Elastic Cloud agent policy was modified manually. The Fleet app in Kibana may show a message like:
Unable to create package policy. Package 'apm' already exists on this agent policy
To work around this problem, you can reset the Elastic Cloud agent policy with an API call. Note that this will remove any custom integration policies that you’ve added to the policy, such as Synthetics monitors.
curl -u elastic:<password> --request POST \
  --url <kibana_url>/internal/fleet/reset_preconfigured_agent_policies/policy-elastic-agent-on-cloud \
  --header 'Content-Type: application/json' \
  --header 'kbn-xsrf: xyz'
Air-gapped Elastic Agent upgrade can fail due to an inaccessible PGP keyedit
In versions 8.9 and above, an Elastic Agent upgrade may fail when the upgrader can’t access a PGP key required to verify the binary signature. For details and a workaround, refer to the PGP key download fails in an air-gapped environment known issue in the version 8.9.0 Release Notes or to the workaround documentation in the elastic-agent GitHub repository.
Elastic Agents are unable to connect after removing the Fleet Server integrationedit
When you use Fleet-managed Elastic Agent, at least one Elastic Agent needs to be running the Fleet Server integration. In case the policy containing this integration is accidentally removed from Elastic Agent, all other agents will not be able to be managed. However, the Elastic Agents will continue to send data to their configured output.
There are two approaches to fixing this issue, depending on whether or not the the Elastic Agent that was running the Fleet Server integration is still installed and healthy (but is now running another policy).
To recover the Elastic Agent:
- In Fleet, open the Agents tab and click Add agent.
- In the Add agent flyout, select an agent policy that contains the Fleet Server integration. On Elastic Cloud you can use the Elastic Cloud agent policy which includes the integration.
- Follow the instructions in the flyout, and stop before running the CLI commands.
-
Depending on the state of the original Fleet Server Elastic Agent, do one of the following:
-
The original Fleet Server Elastic Agent is still running and healthy
In this case, you only need to re-enroll the agent with Fleet:
-
Copy the
elastic-agent installcommand from the Kibana UI. -
In the command, replace
installwithenroll. -
In the directory where Elastic Agent is running (for example
/opt/Elastic/Agent/on Linux), run the command asroot.For example, if Kibana gives you the command:
sudo ./elastic-agent install --url=https://fleet-server:8220 --enrollment-token=bXktc3VwZXItc2VjcmV0LWVucm9sbWVudC10b2tlbg==
Instead run:
sudo ./elastic-agent enroll --url=https://fleet-server:8220 --enrollment-token=bXktc3VwZXItc2VjcmV0LWVucm9sbWVudC10b2tlbg==
-
Copy the
-
The original Fleet Server Elastic Agent is no longer installed
In this case, you need to install the agent again:
- Copy the commands from the Kibana UI. The commands don’t need to be changed.
-
Run the commands in order. The first three commands will download a new Elastic Agent install package, expand the archive, and change directories.
The final command will install Elastic Agent. For example:
sudo ./elastic-agent install --url=https://fleet-server:8220 --enrollment-token=bXktc3VwZXItc2VjcmV0LWVucm9sbWVudC10b2tlbg==
-
After running these steps your Elastic Agents should be able to connect with Fleet again.
Elastic Agent Out of Memory errors on Kubernetesedit
In a Kubernetes environment, Elastic Agent may be terminated with reason OOMKilled due to inadequate available memory.
To detect the problem, run the kubectl describe pod command and check the results for the following content:
       Last State:   Terminated
       Reason:       OOMKilled
       Exit Code:    137
To resolve the problem, allocate additional memory to the agent and then restart it.