Fleet and Elastic Agent overview
editFleet and Elastic Agent overview
editElastic Agent
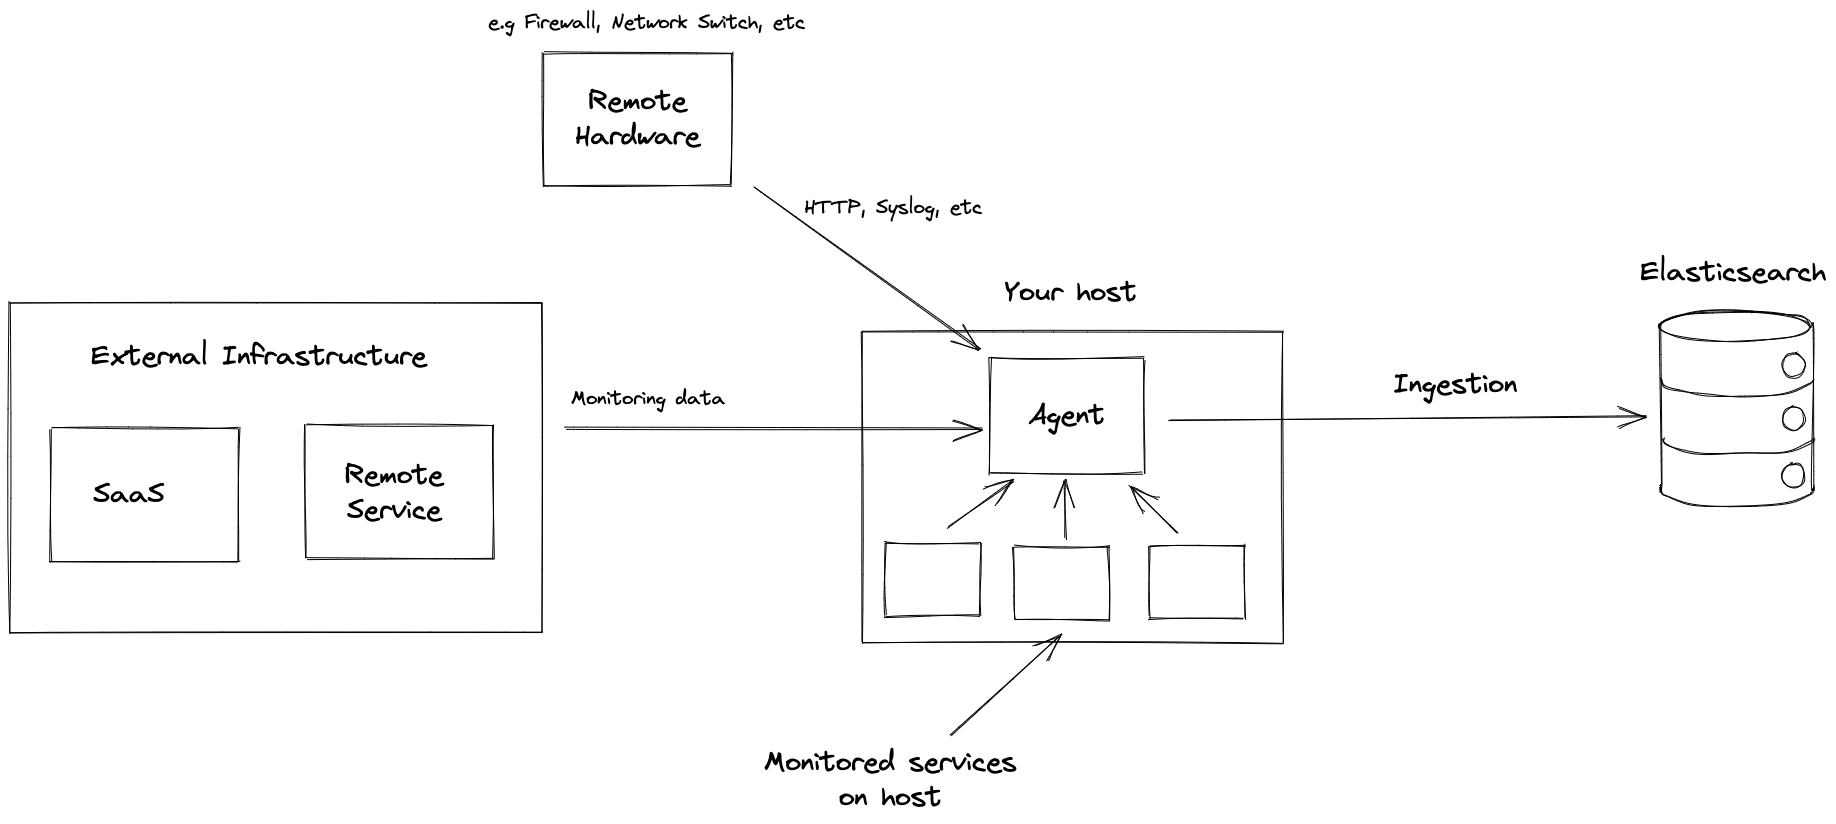
editElastic Agent is a single, unified way to add monitoring for logs, metrics, and other types of data to a host. It can also protect hosts from security threats, query data from operating systems, forward data from remote services or hardware, and more. A single agent makes it easier and faster to deploy monitoring across your infrastructure. Each agent has a single policy you can update to add integrations for new data sources, security protections, and more.
As the following diagram illustrates, Elastic Agent can monitor the host where it’s deployed, and it can collect and forward data from remote services and hardware where direct deployment is not possible.
To learn about installation options, refer to Install Elastic Agents.
Integrations
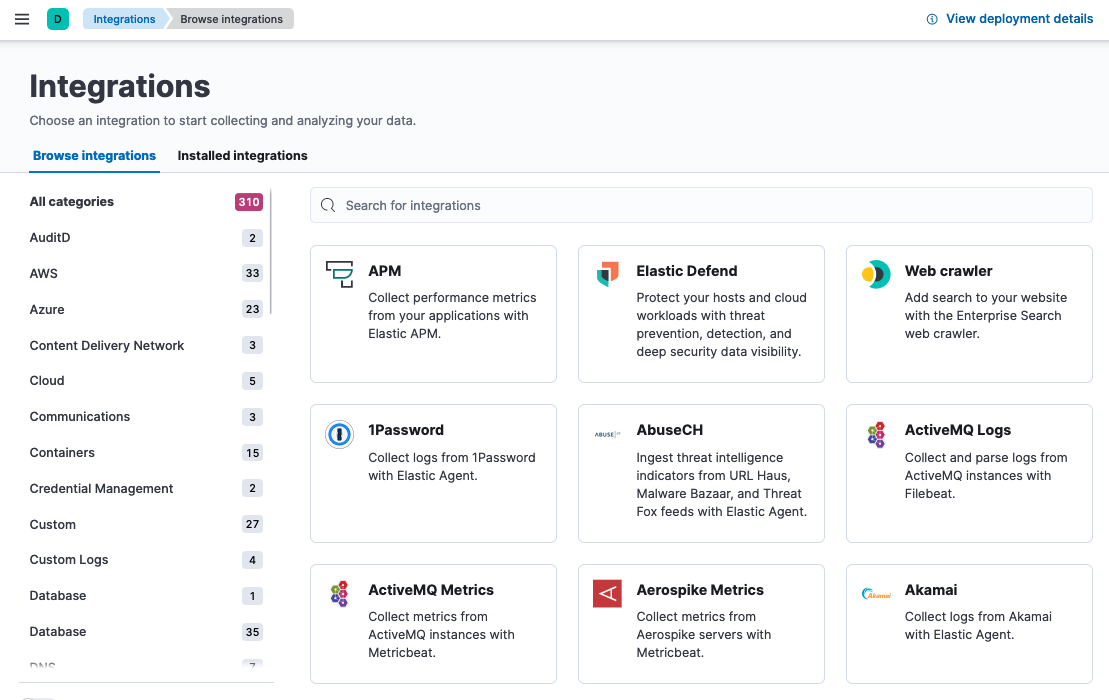
editElastic integrations provide an easy way to connect Elastic to external services and systems, and quickly get insights or take action. They can collect new sources of data, and they often ship with out-of-the-box assets like dashboards, visualizations, and pipelines to extract structured fields out of logs and events. This makes it easier to get insights within seconds. Integrations are available for popular services and platforms like Nginx or AWS, as well as many generic input types like log files.
Kibana provides a web-based UI to add and manage integrations. You can browse a unified view of available integrations that shows both Elastic Agent and Beats integrations.
Elastic Agent policies
editAgent policies specify which integrations you want to run and on which hosts. You can apply an Elastic Agent policy to multiple agents, making it even easier to manage configuration at scale.
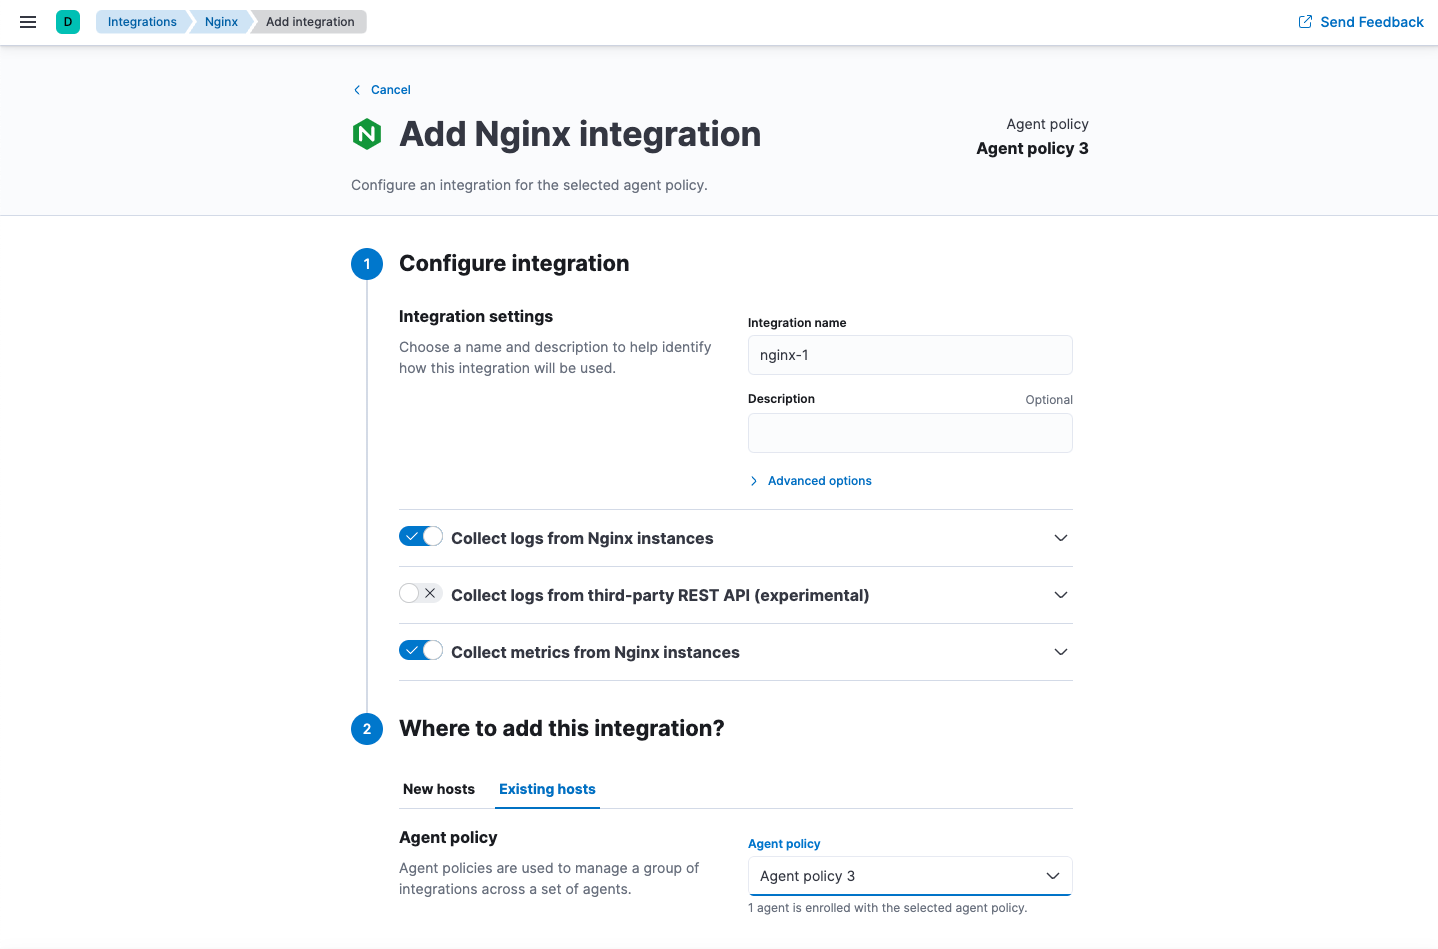
When you add an integration, you configure inputs for logs and metrics, such as the path to your Nginx access logs. When you’re done, you save the integration to an Elastic Agent policy. The next time enrolled agents check in, they receive the update. Having the policies automatically deployed is more convenient than doing it yourself by using SSH, Ansible playbooks, or some other tool.
For more information, refer to Policies.
If you prefer infrastructure as code, you may use YAML files and APIs.
Fleet has an API-first design. Anything you can do in the UI, you
can also do using the API.
This makes it easy to automate and integrate with other systems.
Elastic Package Registry
editThe Elastic Package Registry is an online package hosting service for the Elastic Agent integrations available in Kibana.
Kibana connects to the Elastic Package Registry at epr.elastic.co using the Elastic
Package Manager, downloads the latest integration package, and stores its assets
in Elasticsearch. This process typically requires an internet connection because
integrations are updated and released periodically. You can find more information about running the Elastic Package Registry in air-gapped
environments in the section about Air-gapped environments.
Central management in Fleet
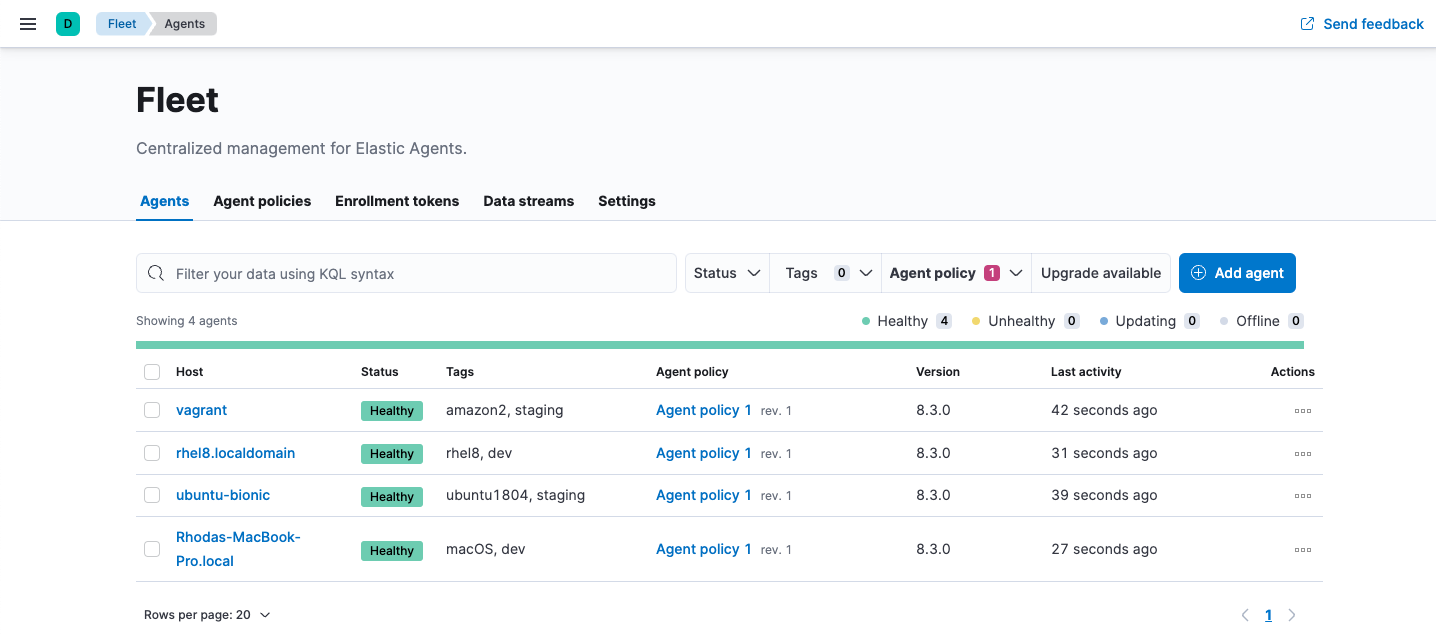
editFleet provides a web-based UI in Kibana for centrally managing Elastic Agents and their policies.
You can see the state of all your Elastic Agents in Fleet. On the Agents page, you can see which agents are healthy or unhealthy, and the last time they checked in. You can also see the version of the Elastic Agent binary and policy.
Fleet serves as the communication channel back to the Elastic Agents. Agents check in for the latest updates on a regular basis. You can have any number of agents enrolled into each agent policy, which allows you to scale up to thousands of hosts.
When you make a change to an agent policy, all the agents receive the update during their next check-in. You no longer have to distribute policy updates yourself.
When you’re ready to upgrade your Elastic Agent binaries or integrations, you can initiate upgrades in Fleet, and the Elastic Agents running on your hosts will upgrade automatically.
Roll out changes to many Elastic Agents quickly
editSome subscription levels support bulk select operations, including:
- Selective binary updates
- Selective agent policy reassignment
- Selective agent unenrollment
This capability enables you to apply changes and trigger updates across many Elastic Agents so you can roll out changes quickly across your organization.
For more information, refer to Elastic Stack subscriptions.
Fleet Server
editFleet Server is the mechanism to connect Elastic Agents to Fleet. It allows for a scalable infrastructure and is supported in Elastic Cloud and self-managed clusters. Fleet Server is a separate process that communicates with the deployed Elastic Agents. It can be started from any available x64 architecture Elastic Agent artifact.
For more information, refer to Set up Fleet Server.
Elasticsearch as the communication layer
editAll communication between the Fleet UI and Fleet Server happens through
Elasticsearch. Fleet writes policies, actions, and any changes to the fleet-*
indices in Elasticsearch. Each Fleet Server monitors the indices, picks up changes, and
ships them to the Elastic Agents. To communicate to Fleet about the status of the
Elastic Agents and the policy rollout, the Fleet Servers write updates to the
fleet-* indices.
Elastic Agent self-protection
editOn macOS and Windows, when the Elastic Defend integration is added to the agent policy, Elastic Endpoint can prevent malware from executing on the host. For more information, refer to Elastic Endpoint self-protection.
Data streams make index management easier
editThe data collected by Elastic Agent is stored in indices that are more granular than you’d get by default with the Beats shippers or APM Server. This gives you more visibility into the sources of data volume, and control over lifecycle management policies and index permissions. These indices are called data streams.