Run Elastic Agent standalone (advanced users)
editRun Elastic Agent standalone (advanced users)
editThis functionality is in beta and is subject to change. The design and code is less mature than official GA features and is being provided as-is with no warranties. Beta features are not subject to the support SLA of official GA features.
Instead of using Fleet to manage your Elastic Agents, you can run agents standalone. With standalone mode, you manually configure and manage the agents locally on the systems where they are installed.
Standalone agents are unable to update to new integration package versions automatically. When you update the package version in Kibana, you’ll need to update the standalone policy manually.
To save time, use Fleet in Kibana to generate your standalone configuration:
- Log in to Kibana and go to Management > Fleet.
- On the Agents tab, click Add agent, and look at the deployment instructions under Run standalone.
-
If you haven’t already, download and extract the Elastic Agent to your host:
curl -L -O https://artifacts.elastic.co/downloads/beats/elastic-agent/elastic-agent-7.11.2-darwin-x86_64.tar.gz
tar xzvf elastic-agent-7.11.2-darwin-x86_64.tar.gz
curl -L -O https://artifacts.elastic.co/downloads/beats/elastic-agent/elastic-agent-7.11.2-linux-x86_64.tar.gz
tar xzvf elastic-agent-7.11.2-linux-x86_64.tar.gz
- Download the Elastic Agent Windows zip file from the downloads page.
- Extract the contents of the zip file.
To simplify upgrading to future versions of Elastic Agent, we recommended that you use the tarball distribution instead of the DEB distribution.
curl -L -O https://artifacts.elastic.co/downloads/beats/elastic-agent/elastic-agent-7.11.2-amd64.deb
sudo dpkg -i elastic-agent-7.11.2-amd64.deb
To simplify upgrading to future versions of Elastic Agent, we recommended that you use the tarball distribution instead of the RPM distribution.
curl -L -O https://artifacts.elastic.co/downloads/beats/elastic-agent/elastic-agent-7.11.2-x86_64.rpm
sudo rpm -vi elastic-agent-7.11.2-x86_64.rpm
See the download page for other installation options.
- Back in Fleet, under Choose an agent policy, select a policy to use for the agent. The default policy includes a system integration for collecting logs and metrics from the host system.
-
Under Configure the agent, copy or download the policy. Copy this policy to the
elastic-agent.ymlon the host where the Elastic Agent is extracted.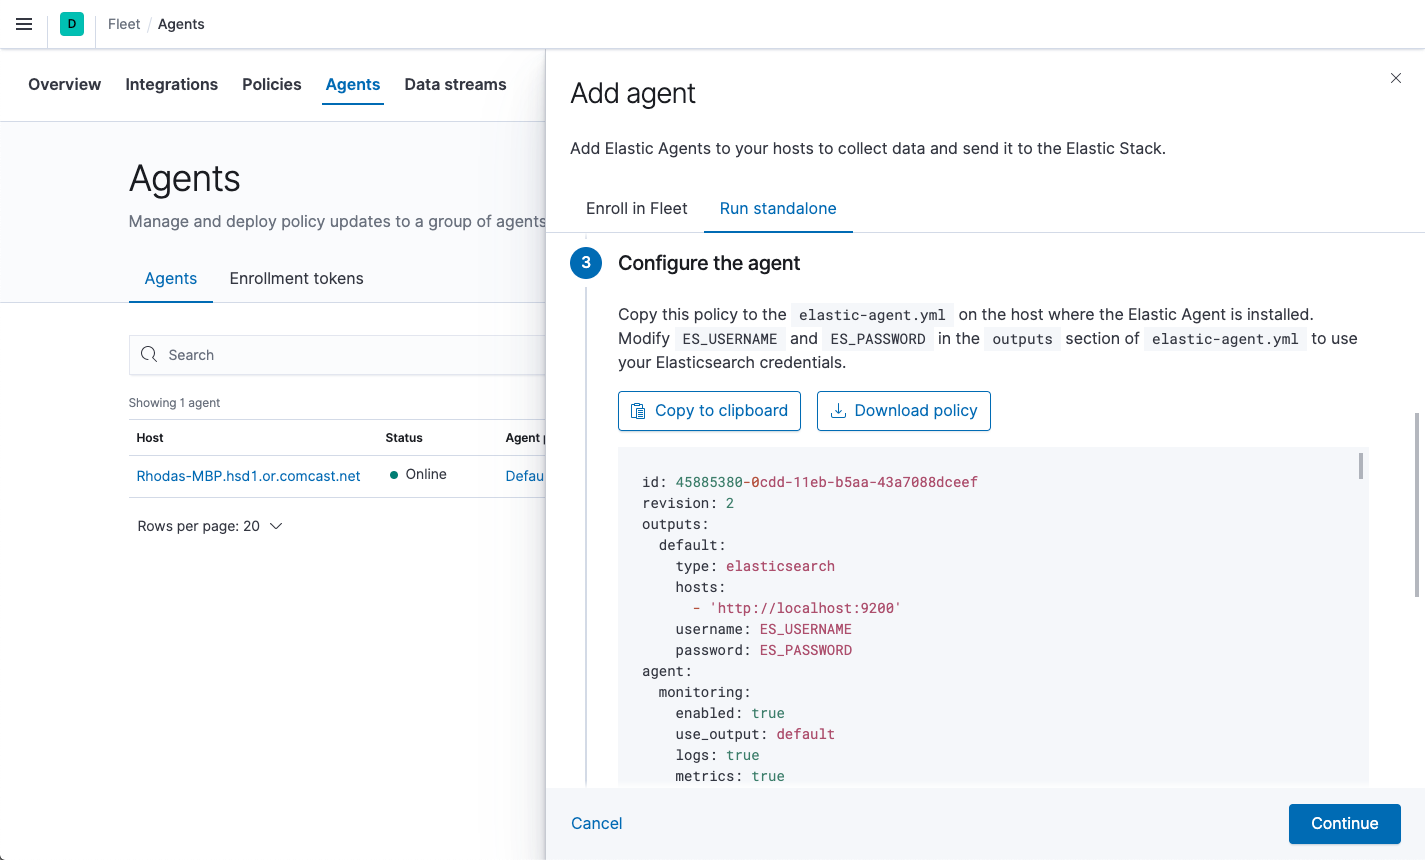
The policy generated by Fleet already contains the correct Elasticsearch address and port for your setup. If you run everything locally, the address is
127.0.0.1:9200. If you use our hosted Elasticsearch Service on Elastic Cloud, you can see the Elasticsearch endpoint URL by copying it from the overview page of your deployment. -
Modify
ES_USERNAMEandES_PASSWORDin the outputs section ofelastic-agent.ymlto use your Elasticsearch credentials. For example:[...] outputs: default: type: elasticsearch hosts: - 'http://localhost:9200' username: ES_USERNAME password: ES_PASSWORD [...]To create a role that has the privileges needed by the Elastic Agent user, go to Management > Dev Tools in Kibana and run:
POST /_security/role/standalone_agent
{
  "cluster": ["monitor"],
  "indices": [
    {
      "names": ["logs-*", "metrics-*", "events-*", ".ds-logs-*", ".ds-metrics-*", ".ds-events-*"],
      "privileges": ["write", "create_index", "indices:admin/auto_create"]
    }
  ]
}
Make sure you assign this role to the user in Kibana.
-
From the agent directory, run the appropriate command to install Elastic Agent as a managed service and start the service:
You must run this command as the root user because some integrations require root privileges to collect sensitive data.
sudo ./elastic-agent install
You must run this command as the root user because some integrations require root privileges to collect sensitive data.
sudo ./elastic-agent install
Open a PowerShell prompt as an Administrator (right-click the PowerShell icon and select Run As Administrator).
From the PowerShell prompt, change to the directory where you installed Elastic Agent, and run:
.\elastic-agent.exe install
You must run this command as the root user because some integrations require root privileges to collect sensitive data.
You must run this command as the root user because some integrations require root privileges to collect sensitive data.
This step installs the Elastic Agent files, including the
elastic-agent.ymlfile you modified earlier, into the directory locations described in Installation layout.
For additional configuration options, see Policy settings.