Analytics events
editAnalytics events
editRefer to Analytics events reference for a complete list of the fields logged by events.
Once your analytics collection is set up and analytics are integrated into your application, you can start sending events to your Elastic deployment.
Events come in three broad categories:
-
Common events: All integrations support
pageviewandclickevents. -
Search events: If you use Search UI, use the
AnalyticsPluginhook to automatically tracksearchevents. -
Custom events: Can be sent using the
trackEventfunction.
This page covers the following topics:
Send events
editSend events using the Browser tracker
editExample:
window.elasticAnalytics.trackEvent("click", { category: "product" })
Send page view events via the NPM Package in React
editExample:
const SearchPage = (props) => {
  useEffect(() => {
    // function executed on component mount
    trackPageView();
  }, []);

  return (
    <div>
      <h1>Search Page</h1>
    </div>
  );
};
Send custom events
editExample: send custom events via NPM Package.
import { trackEvent } from '@elastic/behavioral-analytics-javascript-tracker';

const ProductDetailPage = (props) => {

  return (
    <div>
      <h1>Product detail page</h1>
      <input type="button" onClick={() => {
        trackEvent("click", {
          category: "product",
          action: "add_to_cart",
          label: "product_id",
          value: "123"
        })
      }} />
      }}>Add to Basket</input>
    </div>
  )
}
How to view events
editOnce you begin sending events, you can view them in the Kibana UI.
Analytics events are stored as a logs data stream type.
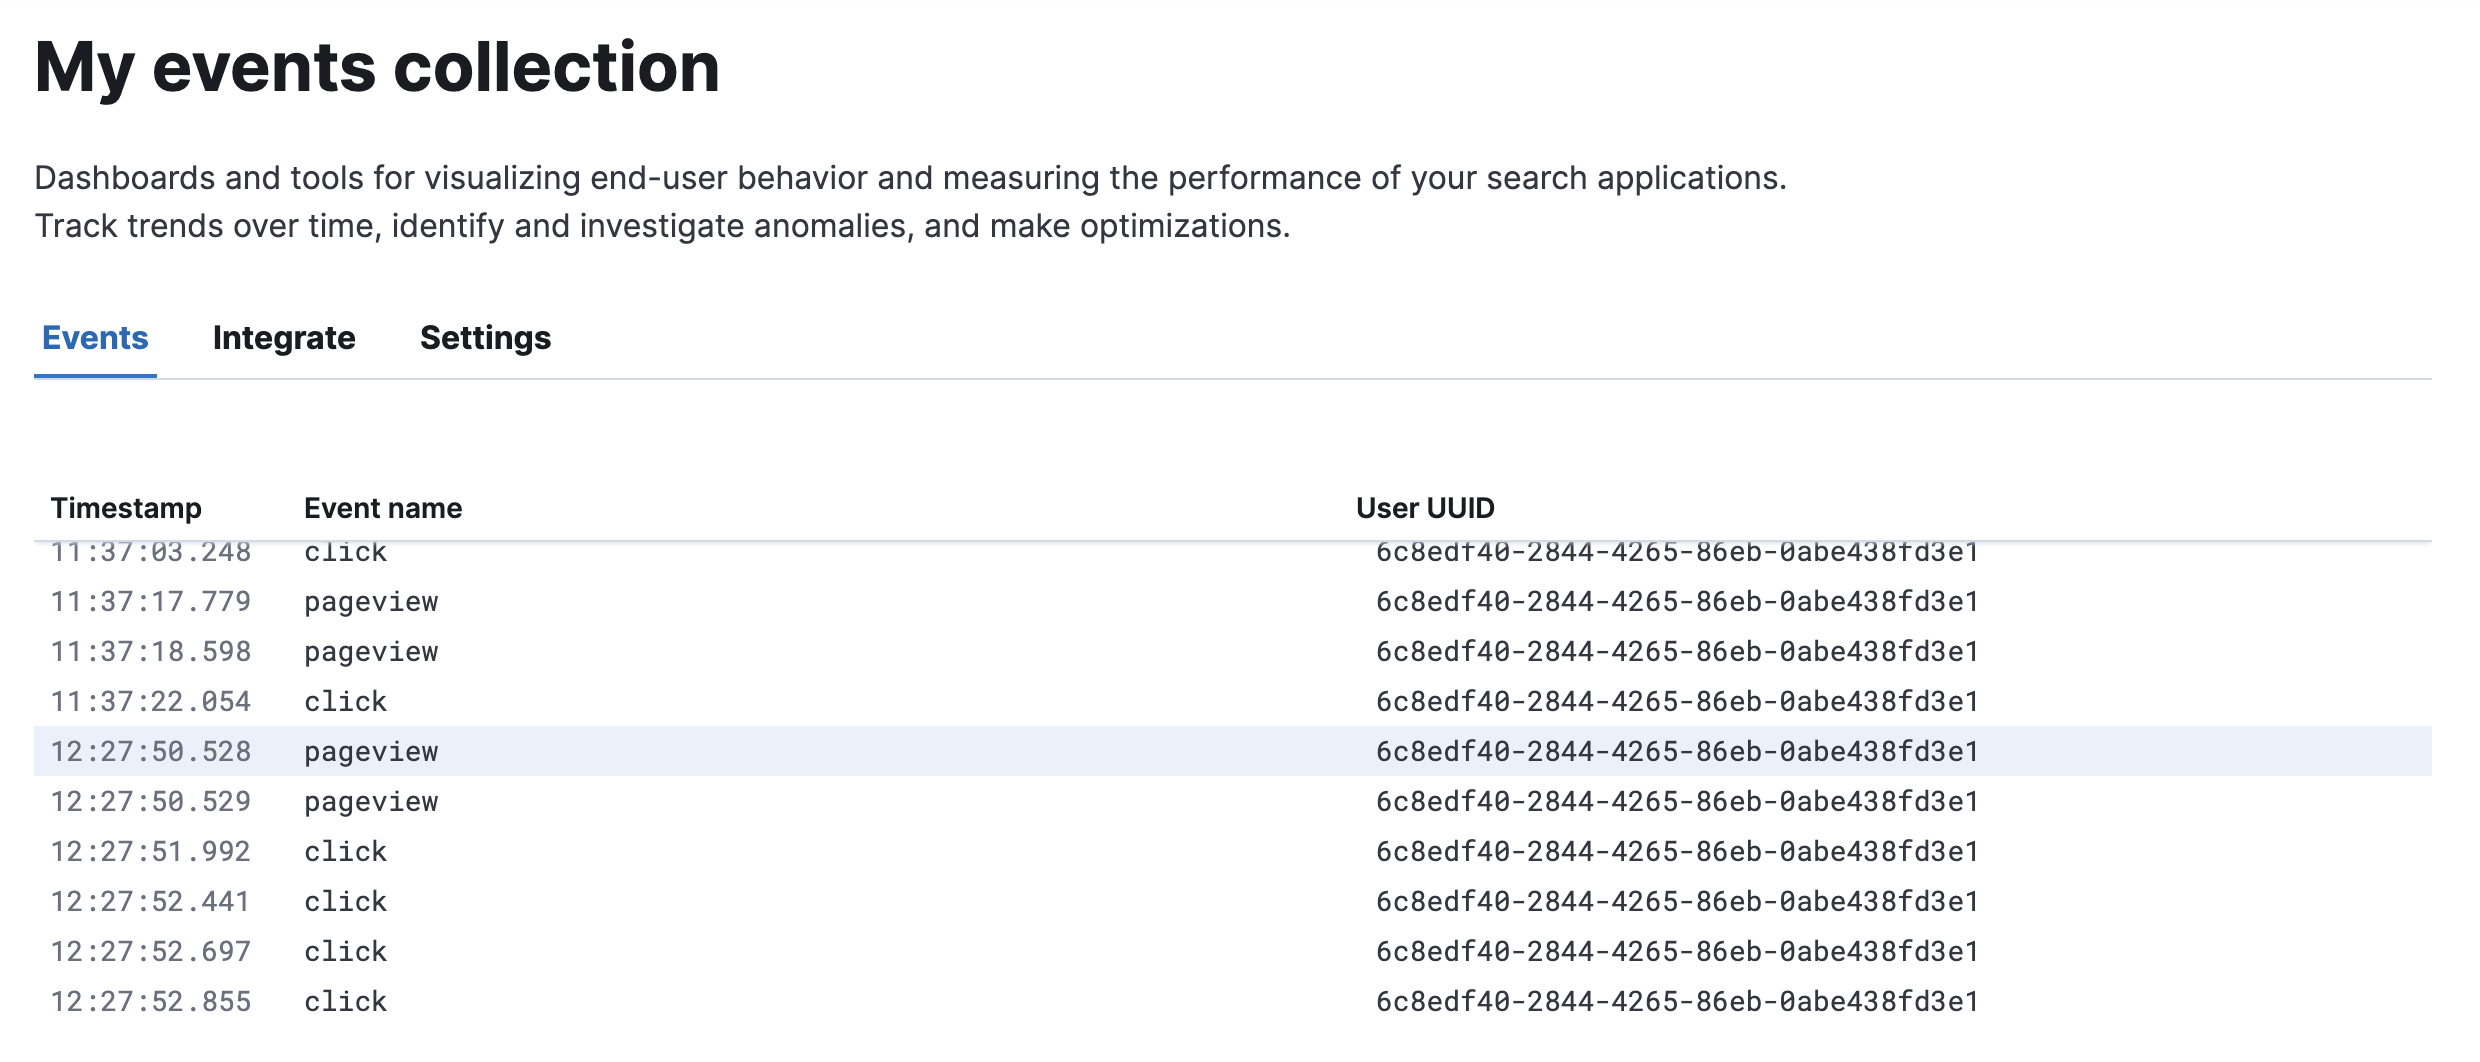
View events in the Collections dashboard
editThe Collections dashboard provides a quick overview of events you’re tracking. It’s a great place to get started. In Kibana, go to the Events tab under Enterprise Search > Behavioral Analytics > View collection.
You can view the event type, timestamp, and user UUID. The following screenshot is an example Analytics events dashboard view:
View events in Discover
editYou can also view events in the Kibana Discover app.
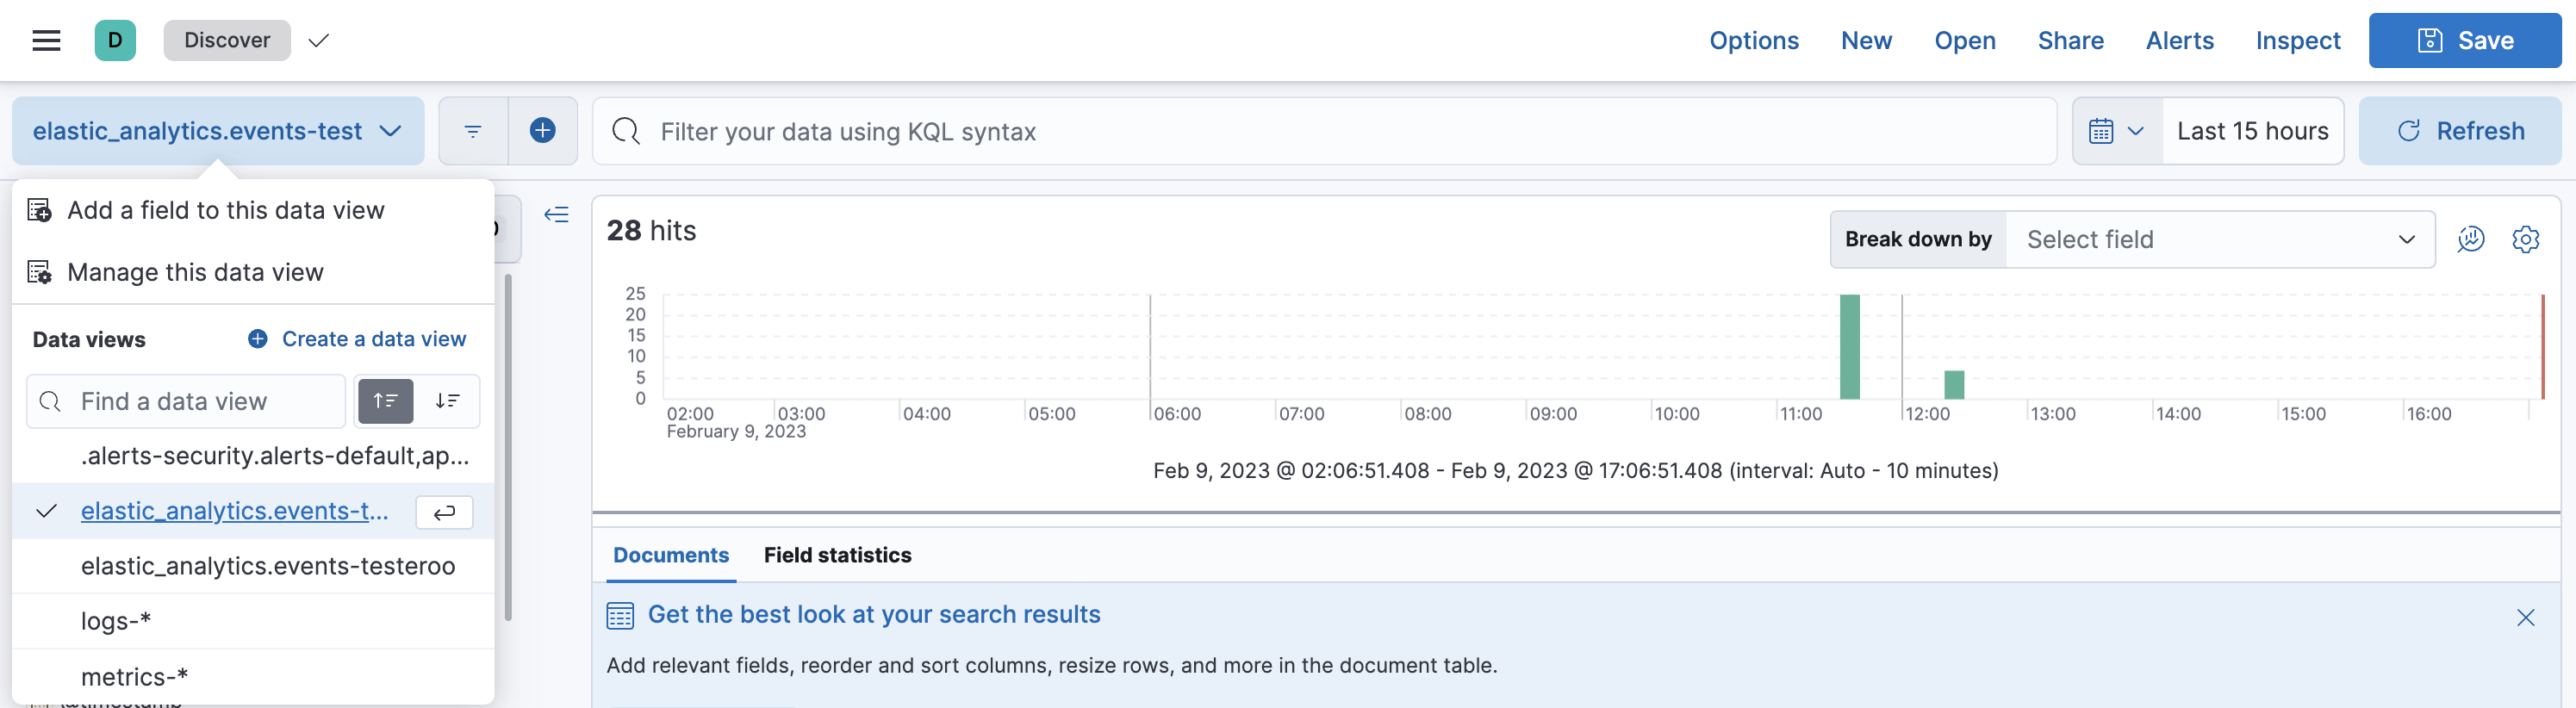
Find your collection’s data view
editFirst you need to find your collection’s data view:
- In the main menu, go to Analytics > Discover.
- Find the data view dropdown menu.
-
You’ll find a data view automatically created for your collection.
It will be named
elastic_analytics.<your-collection>. - Select this data view.
The following screenshot shows you where to find the data view dropdown menu in Discover:
Explore your event data
editNow you’re ready to explore your event data. Discover has a lot of options, but here’s a quick overview of how to get started:
-
Filter your data by searching for terms, such as
clickandpageview. You’ll see a time series of hits that match your search. -
Search for "event" in the field name search bar. For example:
-
Select
event.action. You’ll find a list of all the events you’ve sent and their frequency distribution. -
Search for
event.customer_data.totalResults : 0to find all events where user search queries had 0 results.
-
Select
- Select Visualize to create a Lens visualization.