Example: Parse logs in the Common Log Format
editExample: Parse logs in the Common Log Format
editIn this example tutorial, you’ll use an ingest pipeline to parse server logs in the Common Log Format before indexing. Before starting, check the prerequisites for ingest pipelines.
The logs you want to parse look similar to this:
212.87.37.154 - - [30/May/2099:16:21:15 +0000] \"GET /favicon.ico HTTP/1.1\"
200 3638 \"-\" \"Mozilla/5.0 (Macintosh; Intel Mac OS X 10_11_6)
AppleWebKit/537.36 (KHTML, like Gecko) Chrome/52.0.2743.116 Safari/537.36\"
These logs contain an IP address, timestamp, and user agent. You want to give these three items their own field in Elasticsearch for faster searches and visualizations. You also want to know where the request is coming from.
-
In Kibana, open the main menu and click Stack Management > Ingest Node Pipelines.
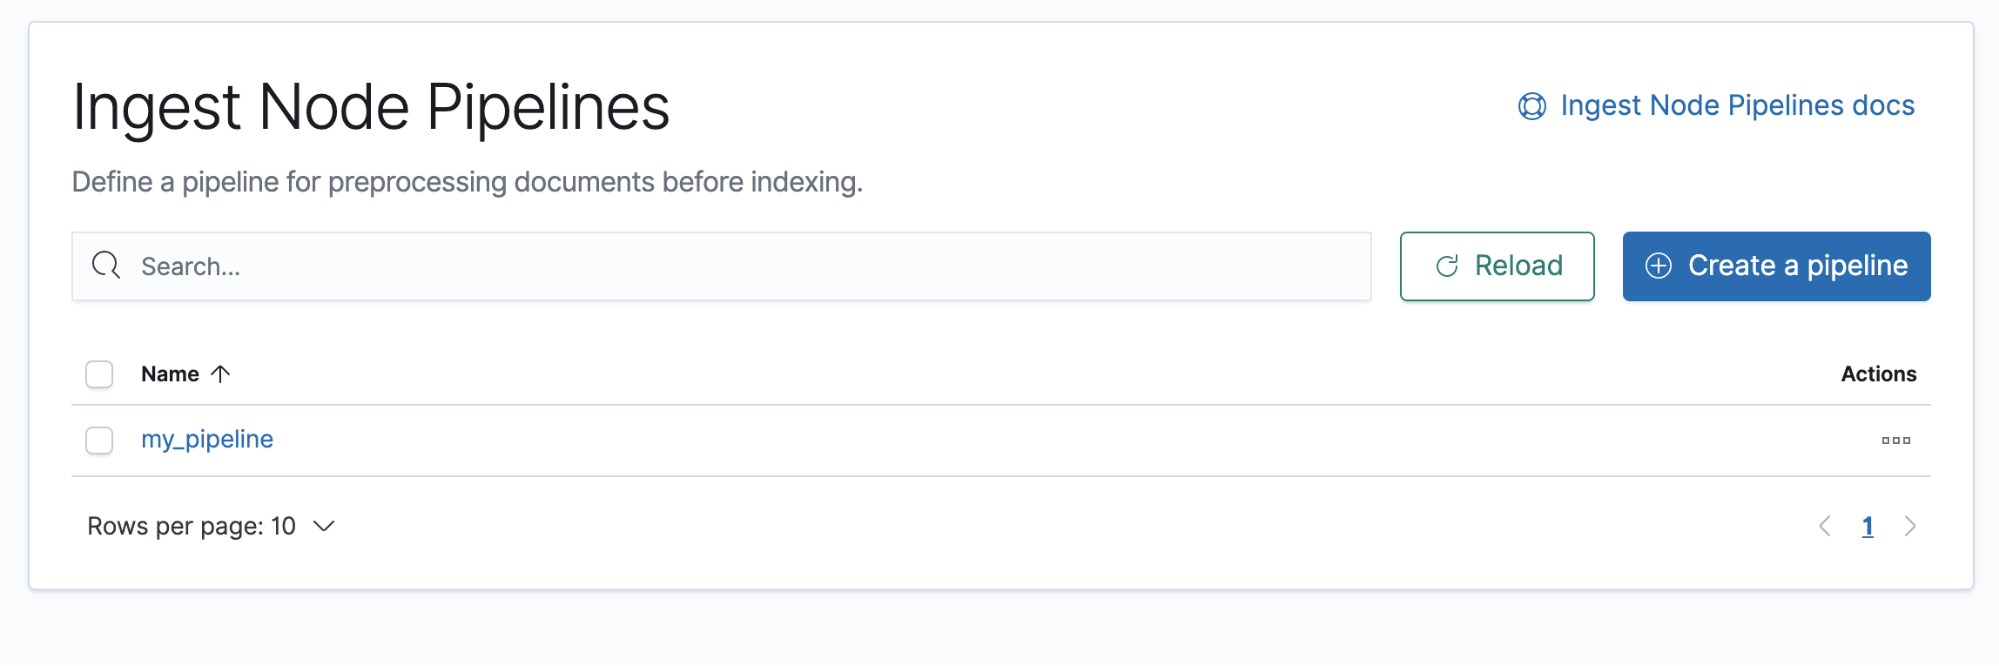
- Click Create a pipeline.
- Provide a name and description for the pipeline.
-
Add a grok processor to parse the log message:
- Click Add a processor and select the Grok processor type.
-
Set the field input to
messageand enter the following grok pattern:%{IPORHOST:client.ip} %{USER:ident} %{USER:auth} \[%{HTTPDATE:@timestamp}\] "%{WORD:verb} %{DATA:request} HTTP/%{NUMBER:httpversion}" %{NUMBER:response:int} (?:-|%{NUMBER:bytes:int}) %{QS:referrer} %{QS:user_agent} - Click Add to save the processor.
-
Add processors to map the date, IP, and user agent fields. Map the appropriate field to each processor type:
-
Date:
@timestamp -
GeoIP:
client.ip -
User agent:
user_agent
In the Date processor, specify the date format you want to use:
dd/MMM/yyyy:HH:mm:ss Z.Your form should look similar to this:
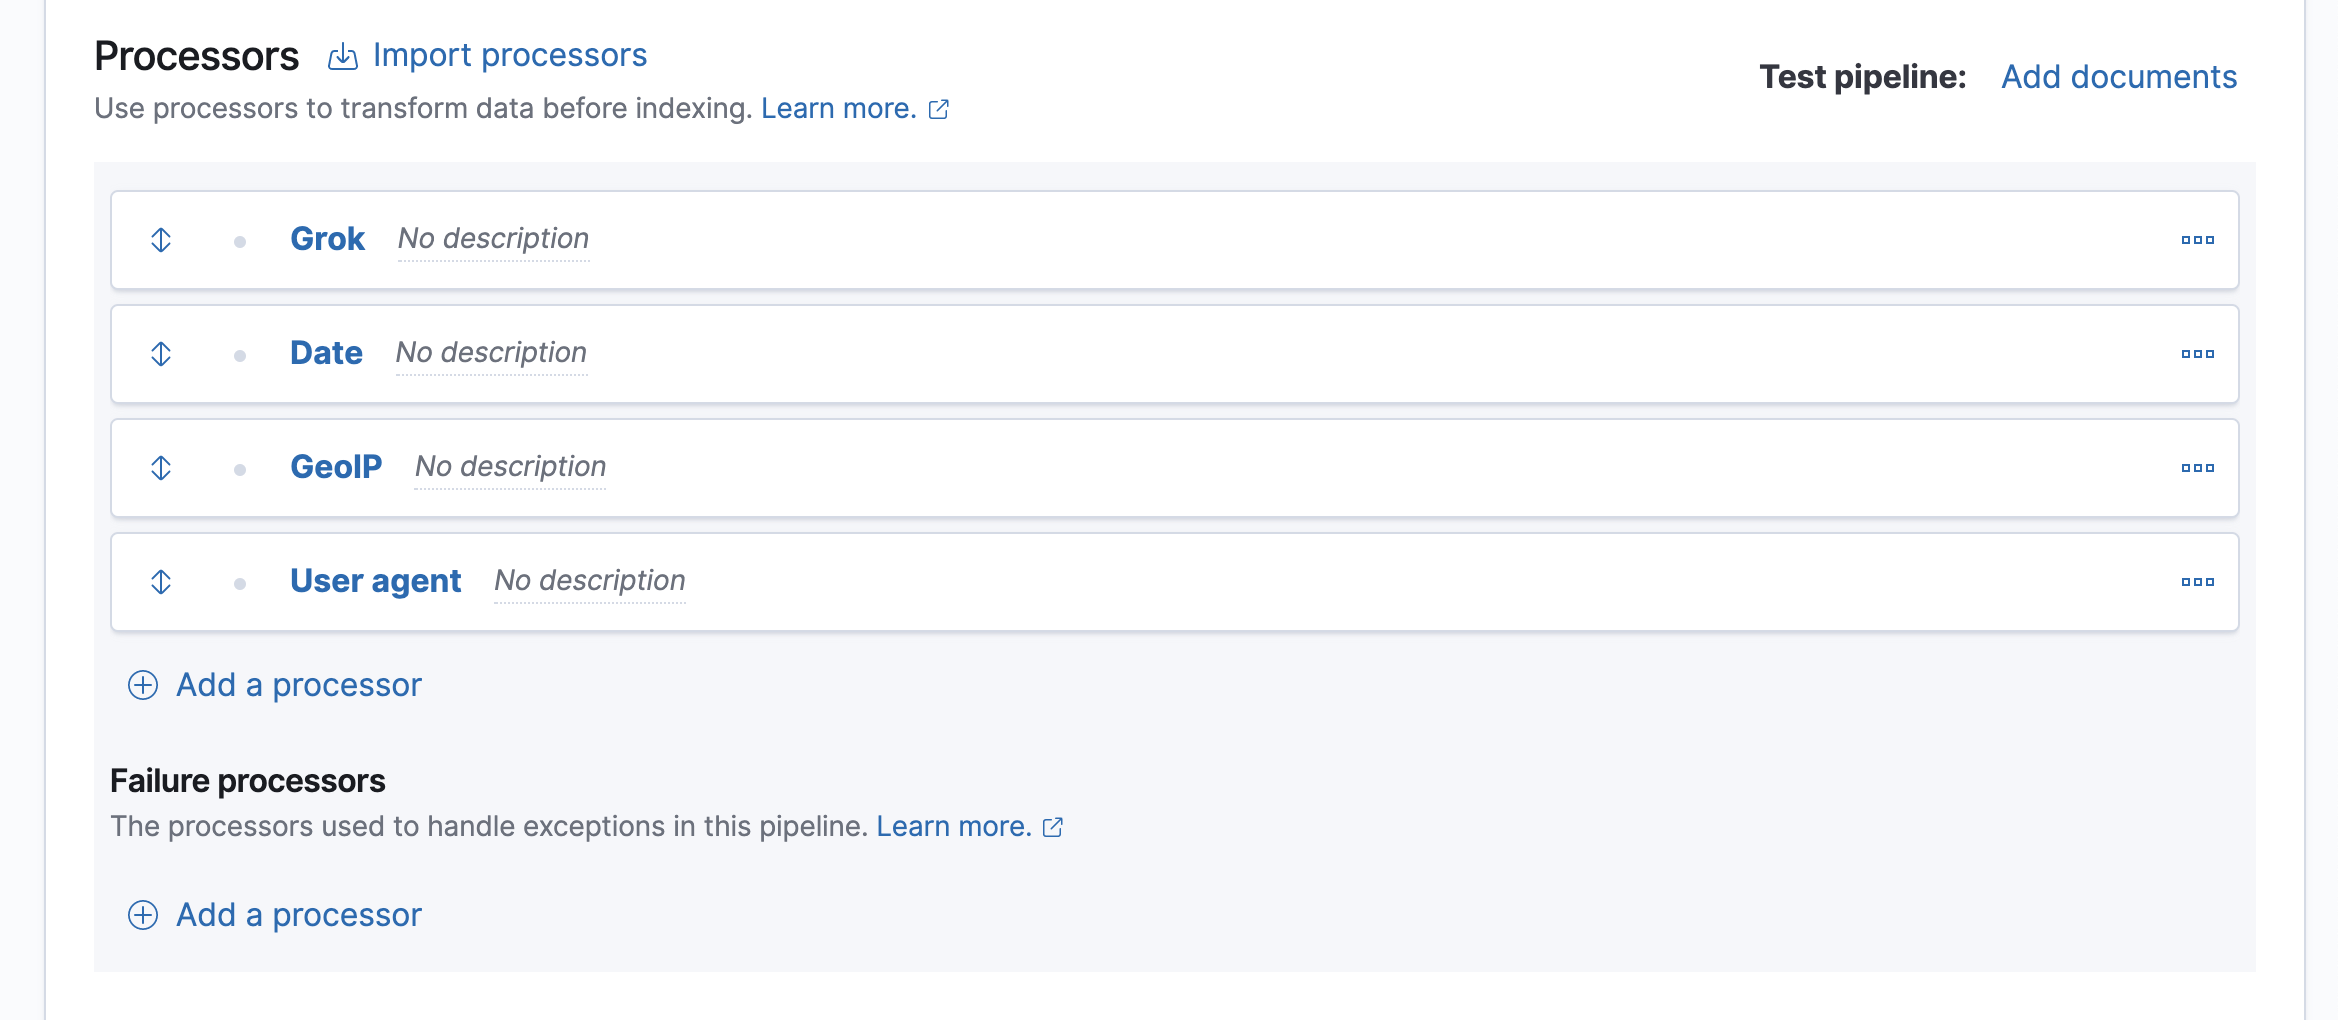
The four processors will run sequentially:
Grok > Date > GeoIP > User agent
You can reorder processors using the arrow icons.Alternatively, you can click the Import processors link and define the processors as JSON:
{ "processors": [ { "grok": { "field": "message", "patterns": ["%{IPORHOST:client.ip} %{USER:ident} %{USER:auth} \\[%{HTTPDATE:@timestamp}\\] \"%{WORD:verb} %{DATA:request} HTTP/%{NUMBER:httpversion}\" %{NUMBER:response:int} (?:-|%{NUMBER:bytes:int}) %{QS:referrer} %{QS:user_agent}"] } }, { "date": { "field": "@timestamp", "formats": [ "dd/MMM/yyyy:HH:mm:ss Z" ] } }, { "geoip": { "field": "client.ip" } }, { "user_agent": { "field": "user_agent" } } ] } -
Date:
- To test the pipeline, click Add documents.
-
In the Documents tab, provide a sample document for testing:
[ { "_source": { "message": "212.87.37.154 - - [05/May/2099:16:21:15 +0000] \"GET /favicon.ico HTTP/1.1\" 200 3638 \"-\" \"Mozilla/5.0 (Macintosh; Intel Mac OS X 10_11_6) AppleWebKit/537.36 (KHTML, like Gecko) Chrome/52.0.2743.116 Safari/537.36\"" } } ] - Click Run the pipeline and verify the pipeline worked as expected.
-
If everything looks correct, close the panel, and then click Create pipeline.
You’re now ready to load the logs data using the index API.
-
Index a document with the pipeline you created.
PUT my-index/_doc/1?pipeline=my-pipeline { "message": "212.87.37.154 - - [05/May/2099:16:21:15 +0000] \"GET /favicon.ico HTTP/1.1\" 200 3638 \"-\" \"Mozilla/5.0 (Macintosh; Intel Mac OS X 10_11_6) AppleWebKit/537.36 (KHTML, like Gecko) Chrome/52.0.2743.116 Safari/537.36\"" } -
To verify, run:
GET my-index/_doc/1