Using OpenTelemetry
You can use OpenTelemetry to monitor the performance and behavior of your Elasticsearch requests through the Elasticsearch Python client. The Python client comes with built-in OpenTelemetry instrumentation that emits distributed tracing spans by default. With that, applications using manual OpenTelemetry instrumentation or automatic OpenTelemetry instrumentation are enriched with additional spans that contain insightful information about the execution of the Elasticsearch requests.
The native instrumentation in the Python client follows the OpenTelemetry Semantic Conventions for Elasticsearch. In particular, the instrumentation in the client covers the logical layer of Elasticsearch requests. A single span per request is created that is processed by the service through the Python client. The following image shows a trace that records the handling of two different Elasticsearch requests: an info request and a search request.

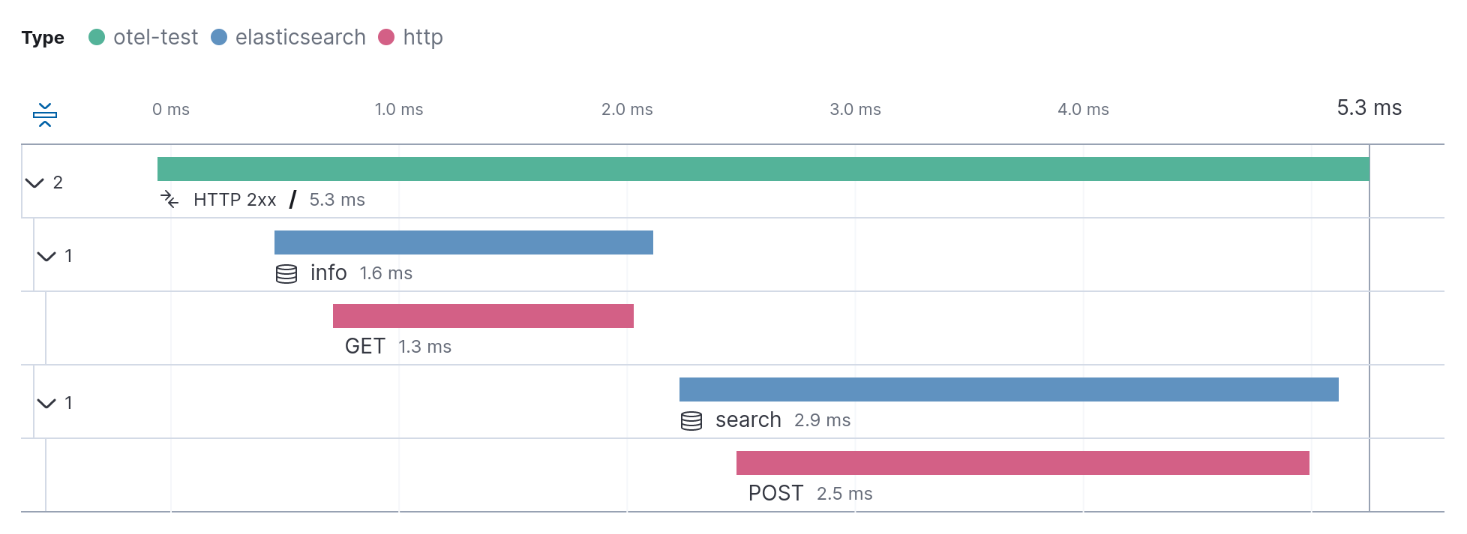
Usually, OpenTelemetry auto-instrumentation modules come with instrumentation support for HTTP-level communication. In this case, in addition to the logical Elasticsearch client requests, spans will be captured for the physical HTTP requests emitted by the client. The following image shows a trace with both, Elasticsearch spans (in blue) and the corresponding HTTP-level spans (in red) after having installed the opentelemetry-instrumentation-urllib3 package:

Advanced Python client behavior such as nodes round-robin and request retries are revealed through the combination of logical Elasticsearch spans and the physical HTTP spans. The following example shows a search request in a scenario with two nodes:

The first node is unavailable and results in an HTTP error, while the retry to the second node succeeds. Both HTTP requests are subsumed by the logical Elasticsearch request span (in blue).
When using the manual Python OpenTelemetry instrumentation or the OpenTelemetry Python agent, the Python client’s OpenTelemetry instrumentation is enabled by default and uses the global OpenTelemetry SDK with the global tracer provider. If you’re getting started with OpenTelemetry instrumentation, the following blog posts have step-by-step instructions to ingest and explore tracing data with the Elastic stack:
- Manual instrumentation with OpenTelemetry for Python applications
- Automatic instrumentation with OpenTelemetry for Python applications
The commmunity OpenTelemetry Elasticsearch instrumentation also instruments the client and sends OpenTelemetry traces, but was developed before the OpenTelemetry Semantic Conventions for Elasticsearch, so the traces attributes are inconsistent with other OpenTelemetry Elasticsearch client instrumentations. To avoid tracing the same requests twice, make sure to use only one instrumentation, either by uninstalling the opentelemetry-instrumentation-elasticsearch Python package or by disabling the native instrumentation.
You can configure this OpenTelemetry instrumentation through environment variables. The following configuration options are available.
With this configuration option you can enable (default) or disable the built-in OpenTelemetry instrumentation.
Default: true
| Environment Variable | OTEL_PYTHON_INSTRUMENTATION_ELASTICSEARCH_ENABLED |
Per default, the built-in OpenTelemetry instrumentation does not capture request bodies due to data privacy considerations. You can use this option to enable capturing of search queries from the request bodies of Elasticsearch search requests in case you wish to gather this information regardless. The options are to capture the raw search query or not capture it at all.
Default: omit
Valid Options: omit, raw
| Environment Variable | OTEL_PYTHON_INSTRUMENTATION_ELASTICSEARCH_CAPTURE_SEARCH_QUERY |
The OpenTelemetry instrumentation (as any other monitoring approach) may come with a slight overhead on CPU, memory, and latency. The overhead can only occur when the instrumentation is enabled (default) and an OpenTelemetry SDK is active in the target application. When the instrumentation is turned off or no OpenTelemetry SDK is active within the target application, monitoring overhead is not expected when using the client.
Even in cases where the instrumentation is enabled and is actively used (by an OpenTelemetry SDK), the overhead is minimal and negligible in the vast majority of cases. In edge cases where there is a noticeable overhead, the instrumentation can be explicitly disabled to remove any potential impact on performance.