Kibana highlights
editKibana highlights
editThis list summarizes the most important enhancements in Kibana 7.9.
An improved Kibana platform
editAs of 7.9, the new development platform for Kibana is complete. The most immediate difference is that pages load faster as you navigate Kibana. If you’re a developer, the new platform enables you to build features faster and with greater efficiency. For details, check out Introducing a new architecture for Kibana.
Enterprise Search comes to Kibana
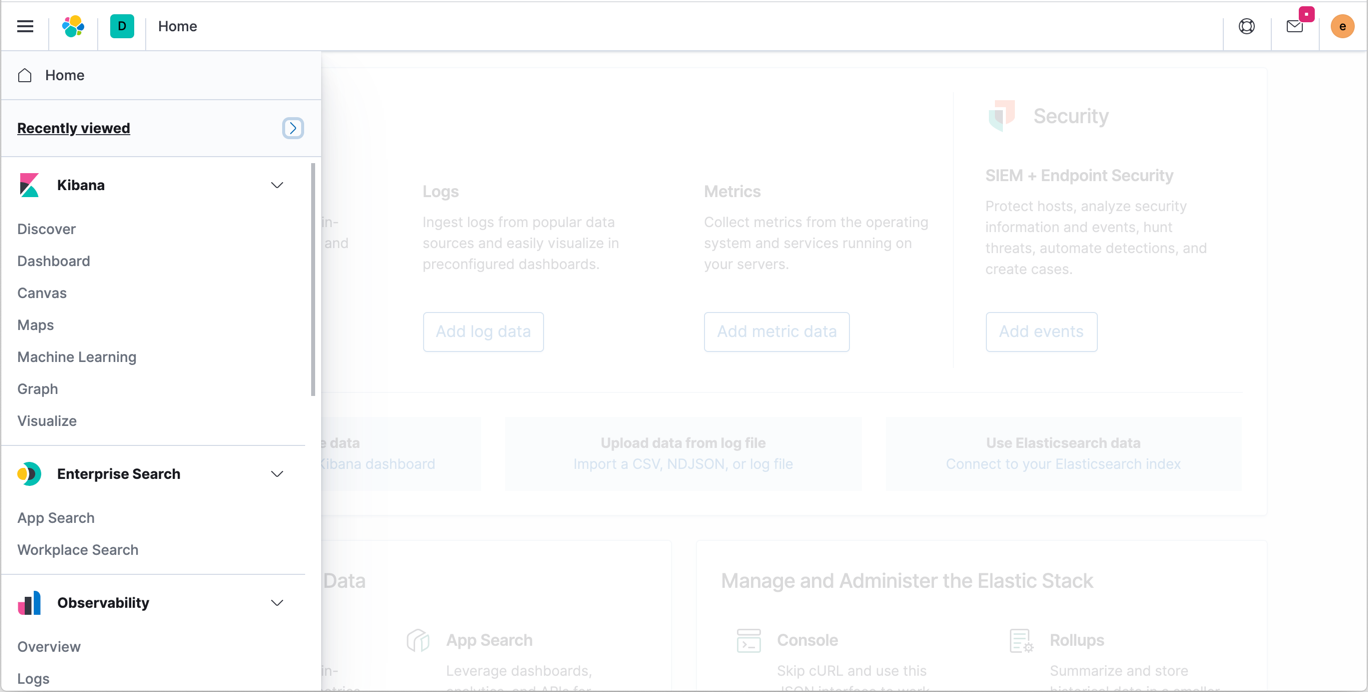
editIn 7.8, we reorganized the Kibana side navigation to make our Observability and Security apps easier to find. In 7.9, we added Enterprise Search to the side navigation. If you’re an existing user of App Search and Workplace Search, you can now launch directly into those environments in Kibana. Check out our documentation for more information.
Multiple y-axes in Lens
editShow two metrics on the y-axis at the same time in Lens. This enables you to compare and contrast data of vastly different types and ranges. For example, you might track the total page views for your web site, which tallies in the millions. You’re also interested in the percentage of the web site bounce rates, typically between 1 and 100. You can stack both metrics on top of one another to quickly spot the outliers.
Also in 7.9, Lens debuts color pick, sort, and a fitting function.
Canvas variables for easy reuse
editYou can now can create variables to easily reuse the strings and patterns in your Canvas elements. This is especially useful if you frequently copy and paste your elements. For example, when you clone a large workpad and need to connect your elements to a new index, you can use variables to quickly update the elements, instead of changing the index for each individual element. For instructions, refer to the Canvas documentation.
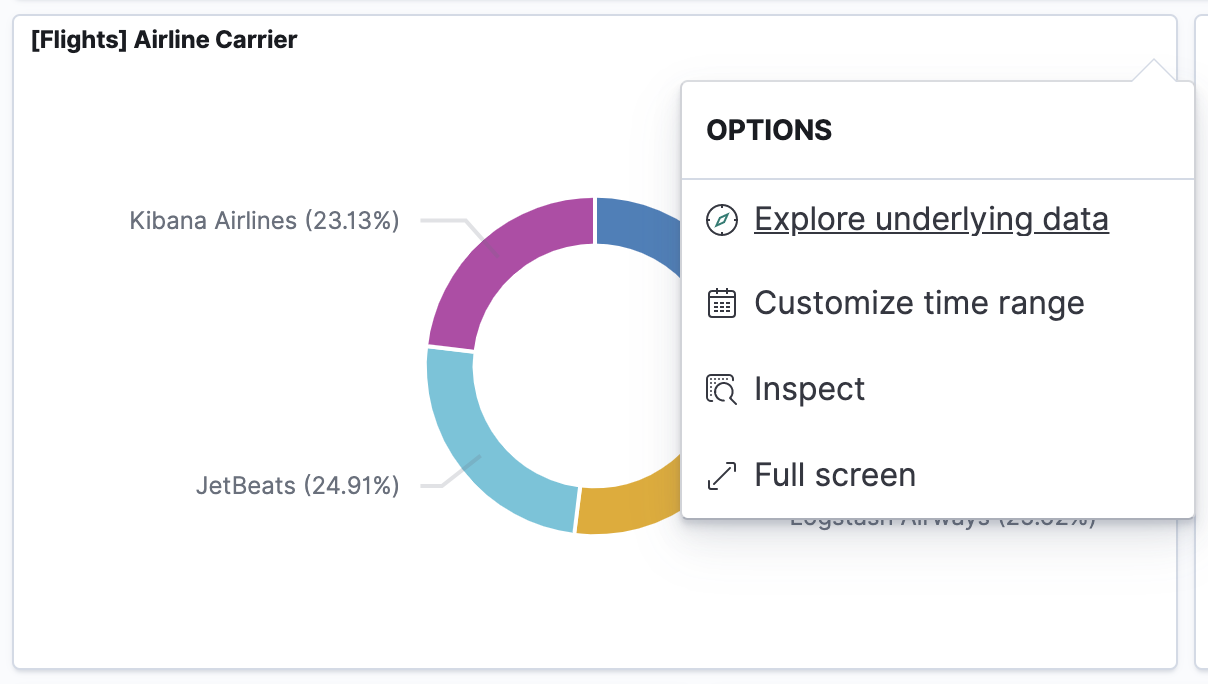
Dashboard to Discover explorations
editNavigating between dashboards was a highlight in 7.8, and 7.9 adds the ability to navigate from a dashboard to Discover. The time range, filters, and other parameters remain the same, so you can continue your analysis from a new perspective. For example, your dashboard might have a visualization for overall HTTP responses. You can navigate to Discover to see the saved search for HTTP responses. The new Explore underlying data action is available for visualizations backed by a single index pattern.
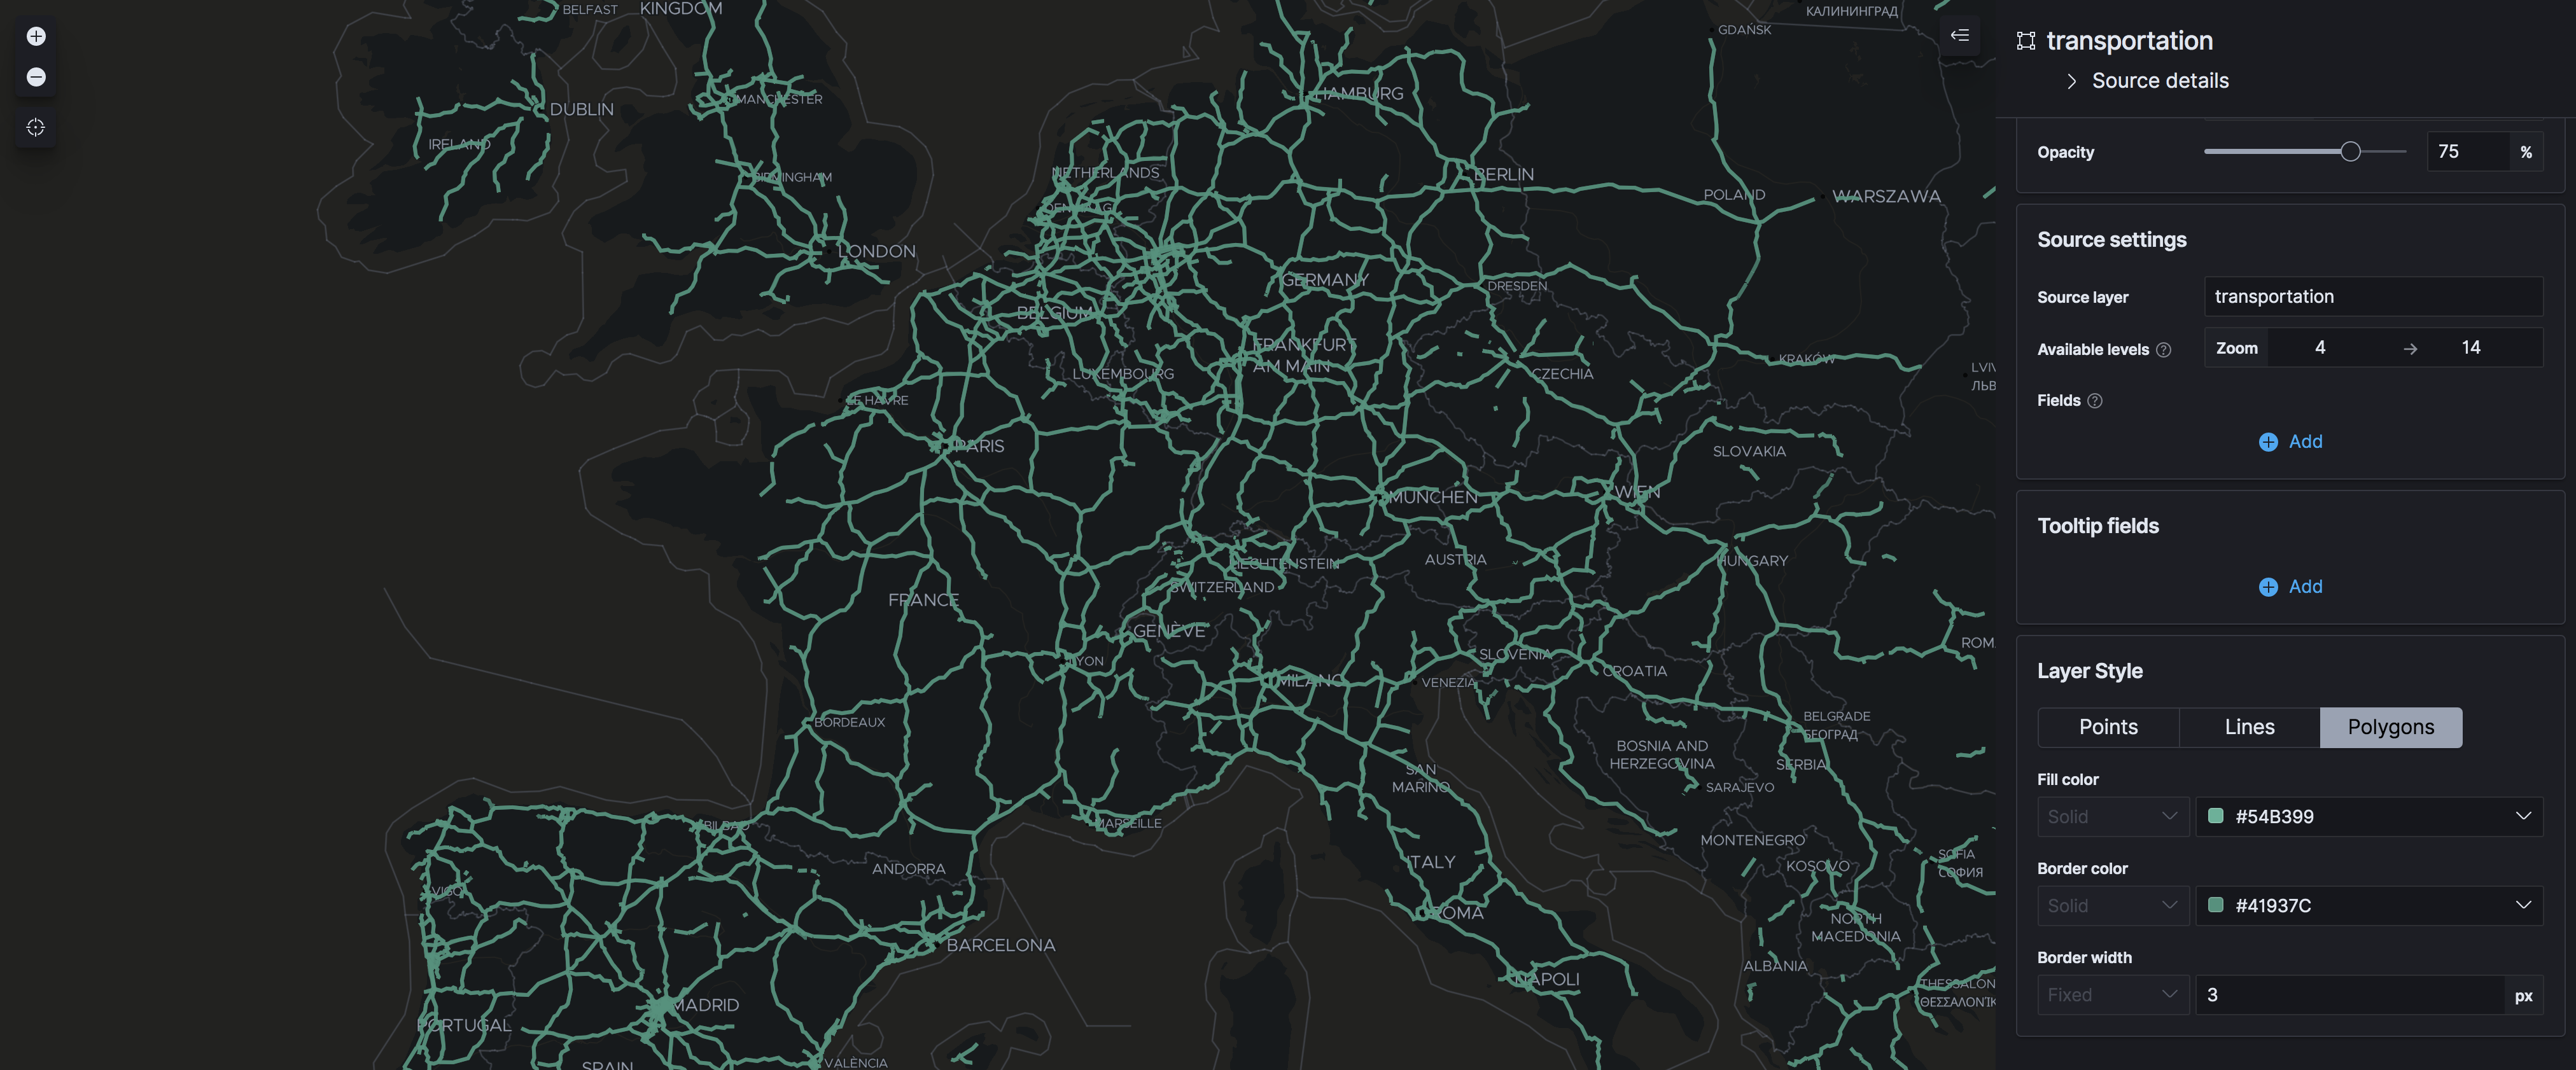
geo_shape fields at scale in Maps
editMaps now allows you to create geo_shape fields with Elasticsearch aggregations. This means that you can plot your geo_shape fields at scale just like your geo_point fields. You can create a layer that clusters your lines and polygons until you zoom into an area with less than 10,000 discrete documents. Then, you’ll see individual lines and polygons.
Vector tile layers in Maps
editMaps also introduces a new vector tile layer—you can add layers to your map for data services that implement the Mapbox vector tile specification.
ServiceNow action in Alerts
editAlerting introduces a ServiceNow action that creates incidents in ServiceNow. See the ServiceNow docs for details.
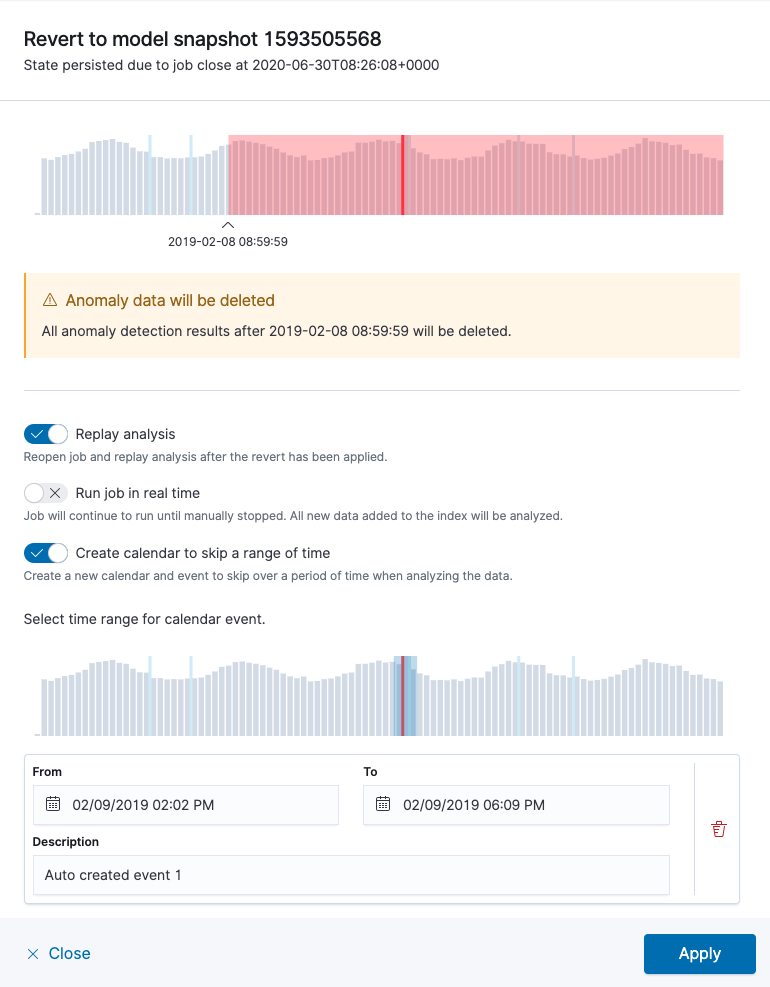
Model snapshot management in Machine Learning
editSee the list of model snapshots for each job in Machine Learning > Anomaly Detection > Job Management. This makes it easier to edit, delete, or revert to a specific snapshot. If there are periods of unusual activity that you want to ignore, you can also create scheduled events before you revert and replay the analysis.
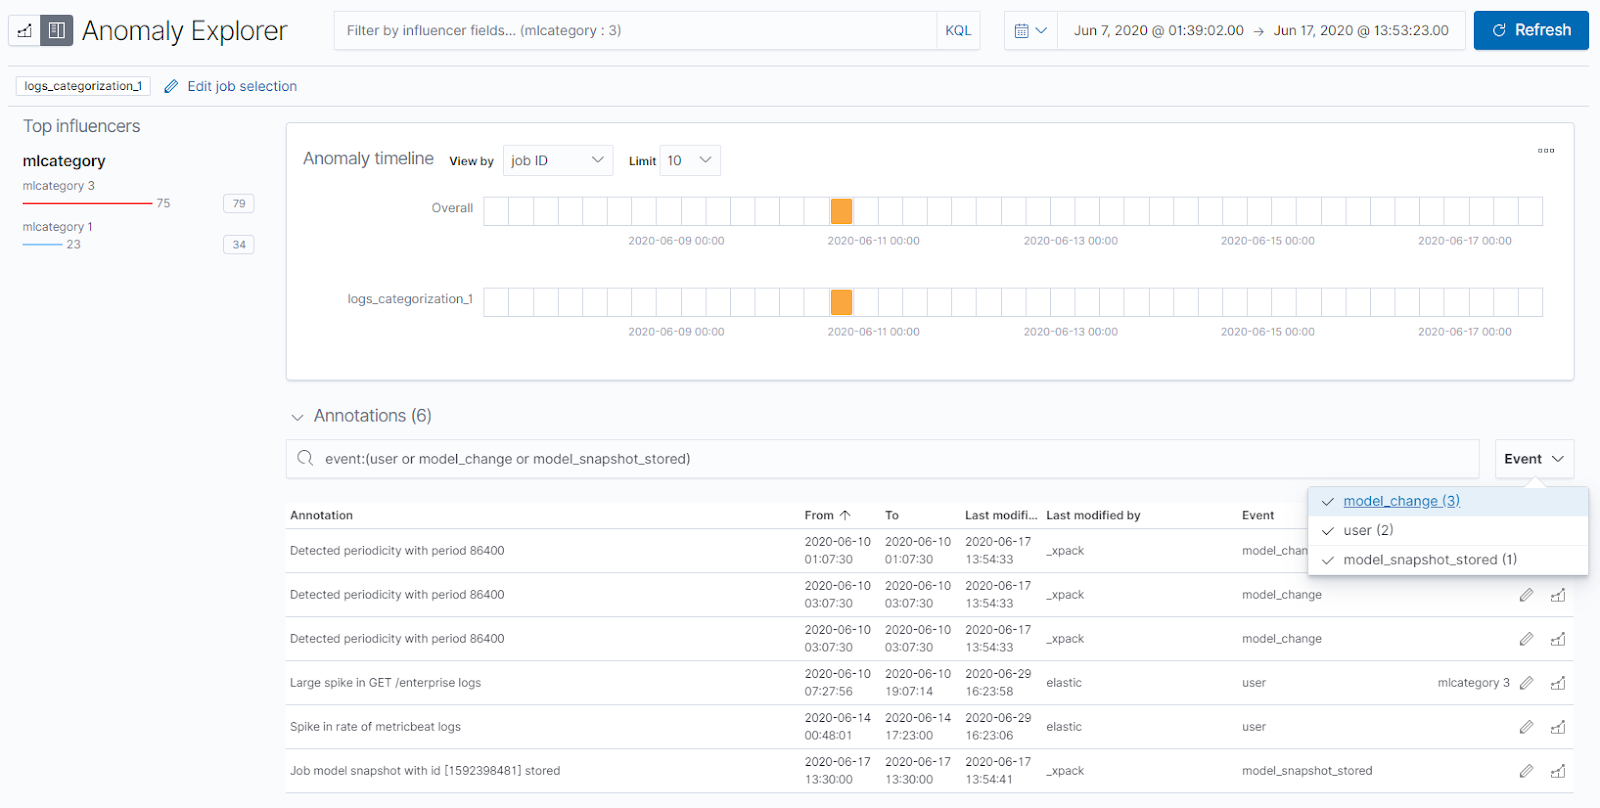
Automatic annotations in anomaly detection jobs
editYou have been able to add annotations to your anomaly detection job results for a long time. Starting in 7.9, anomaly detection job annotations are automatically generated every time the model calculation significantly changes, for example, when the job detects periodicity, a trend, or a step-change. The table of annotations in the Anomaly Explorer and Single Metric Viewer is enhanced to support the new functionality, so you can filter and search the list of annotations for the various types of events.
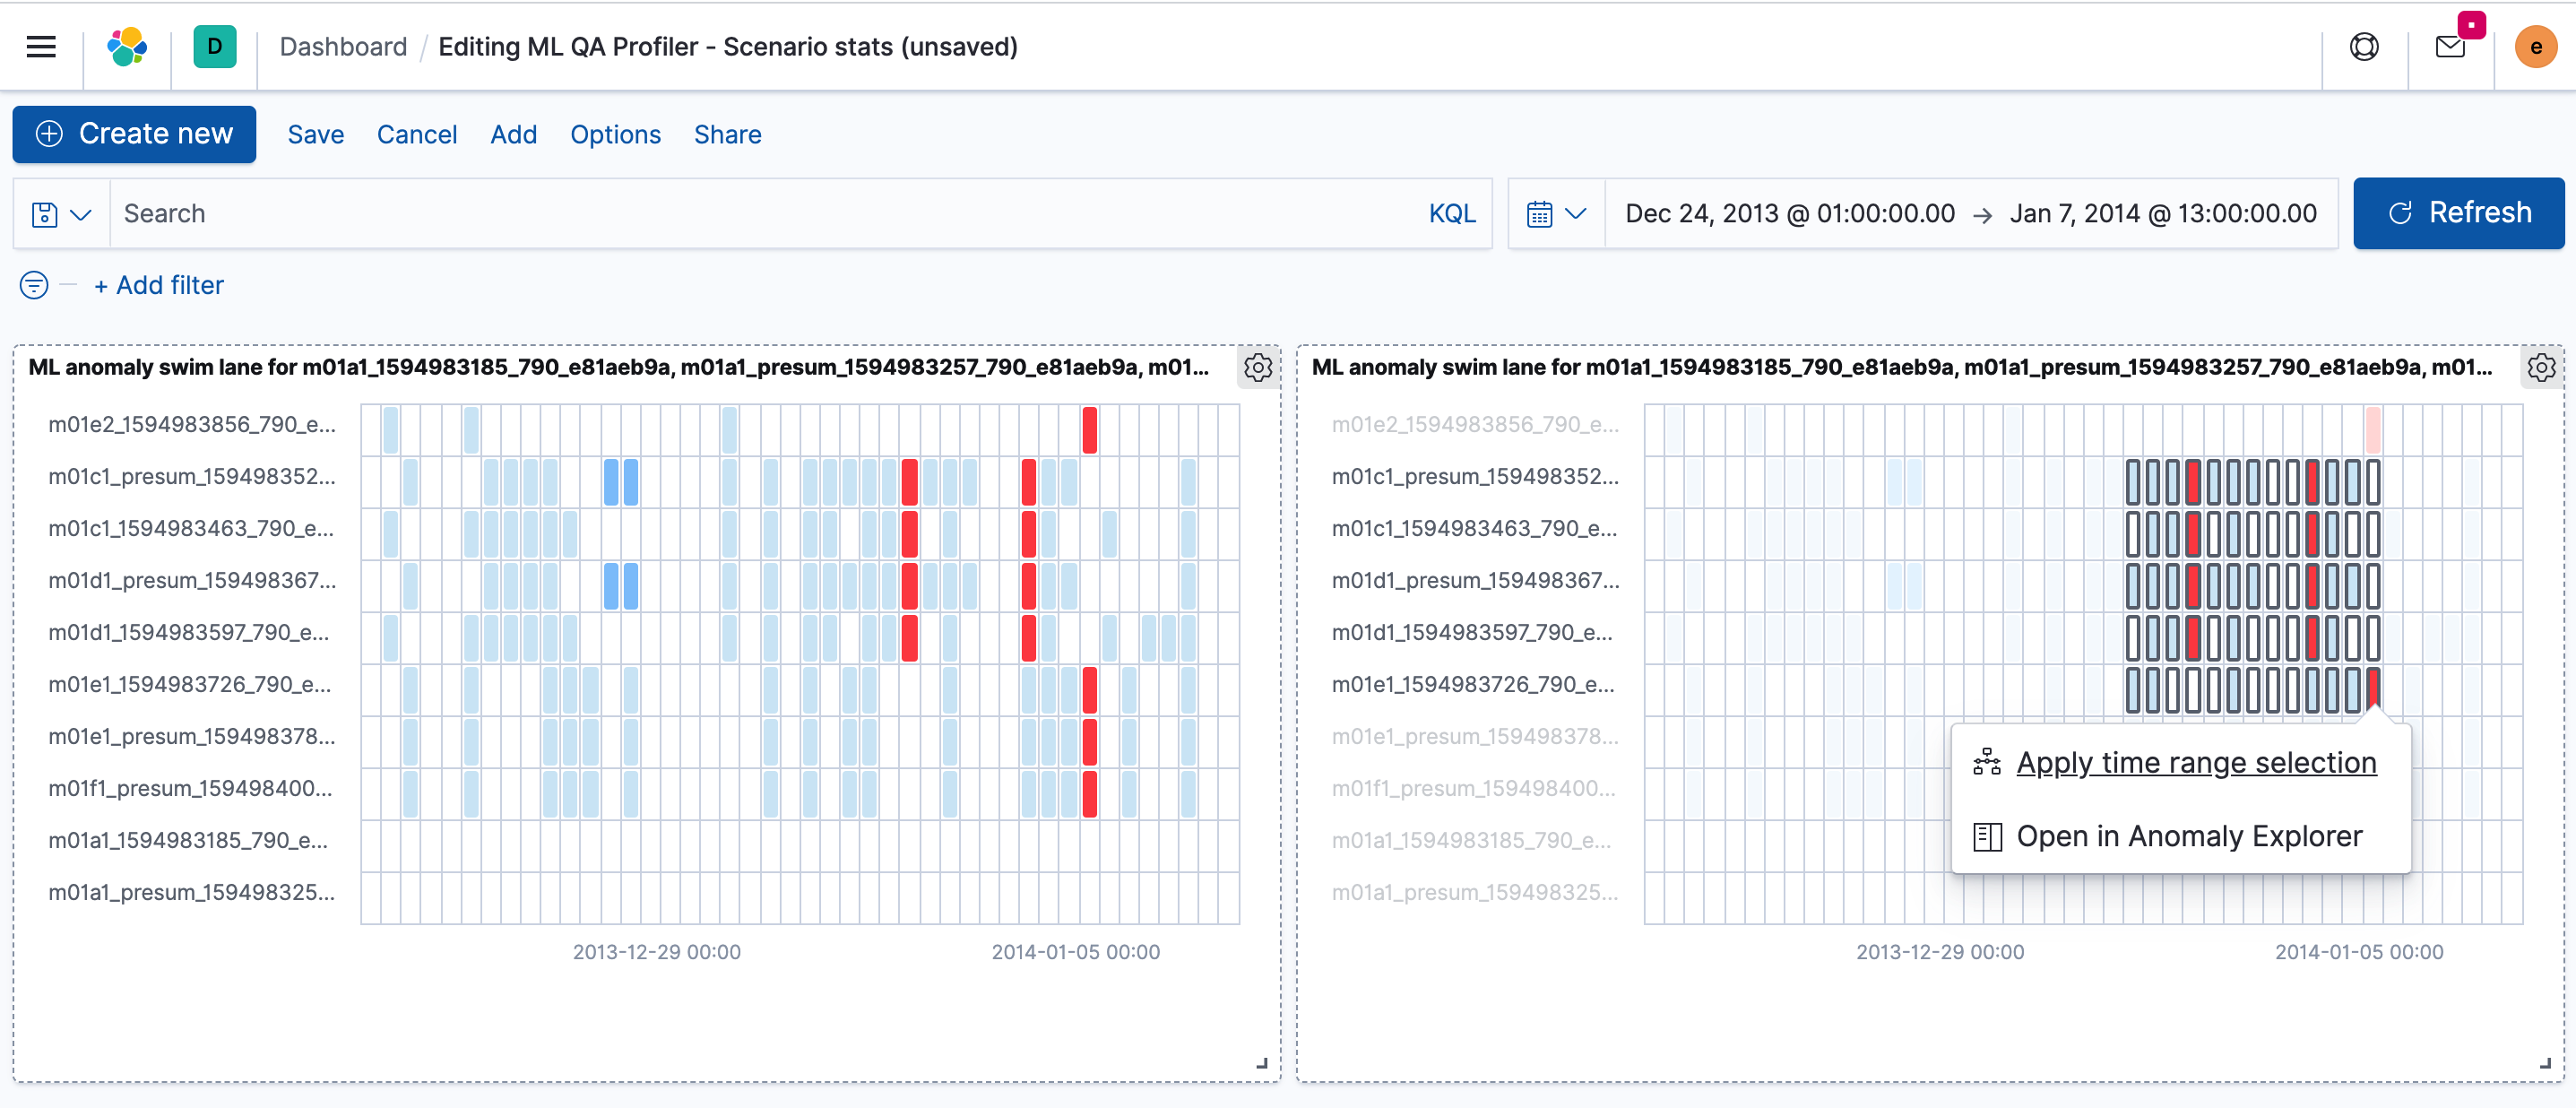
Embeddable swim lanes with new actions and filters
editIn 7.8, swim lanes became the first machine learning visual that you can embed in dashboards. As of 7.9, embeddable anomaly swim lanes are more powerful: when you navigate to the Anomaly Explorer page from the dashboard, swim lanes preserve pagination. You can also add filters with selected influencer values directly on the dashboard.
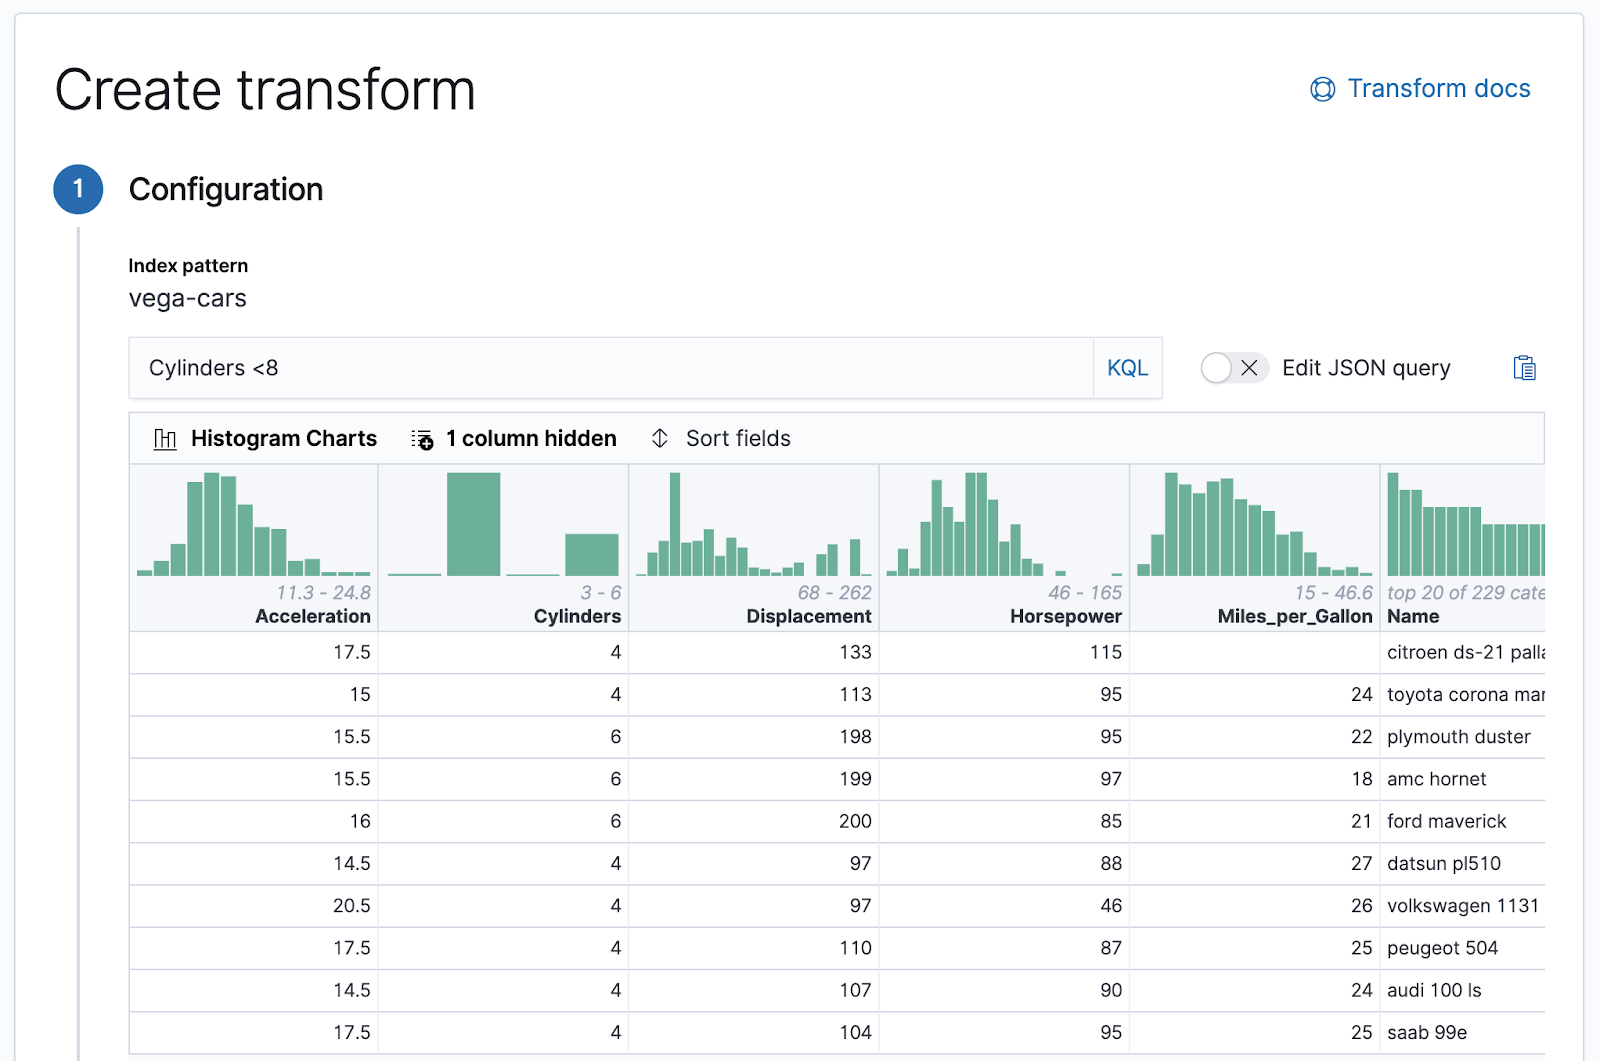
Histogram charts in transform and data frame analytics wizards
editWhether you’re transforming your data to get it ready for analysis or evaluating your data after running it through a data frame analytics job, understanding the distribution and range of your fields is important. In 7.9, you can enable histogram charts in the transform and data frame analytics wizards, so that you can quickly understand the shape of your data columns. This same functionality is also available in the data frame analytics results grid. All of this is designed to give you richer visibility into your data so you can spot outliers faster and easily compare prediction results vs. actual values.
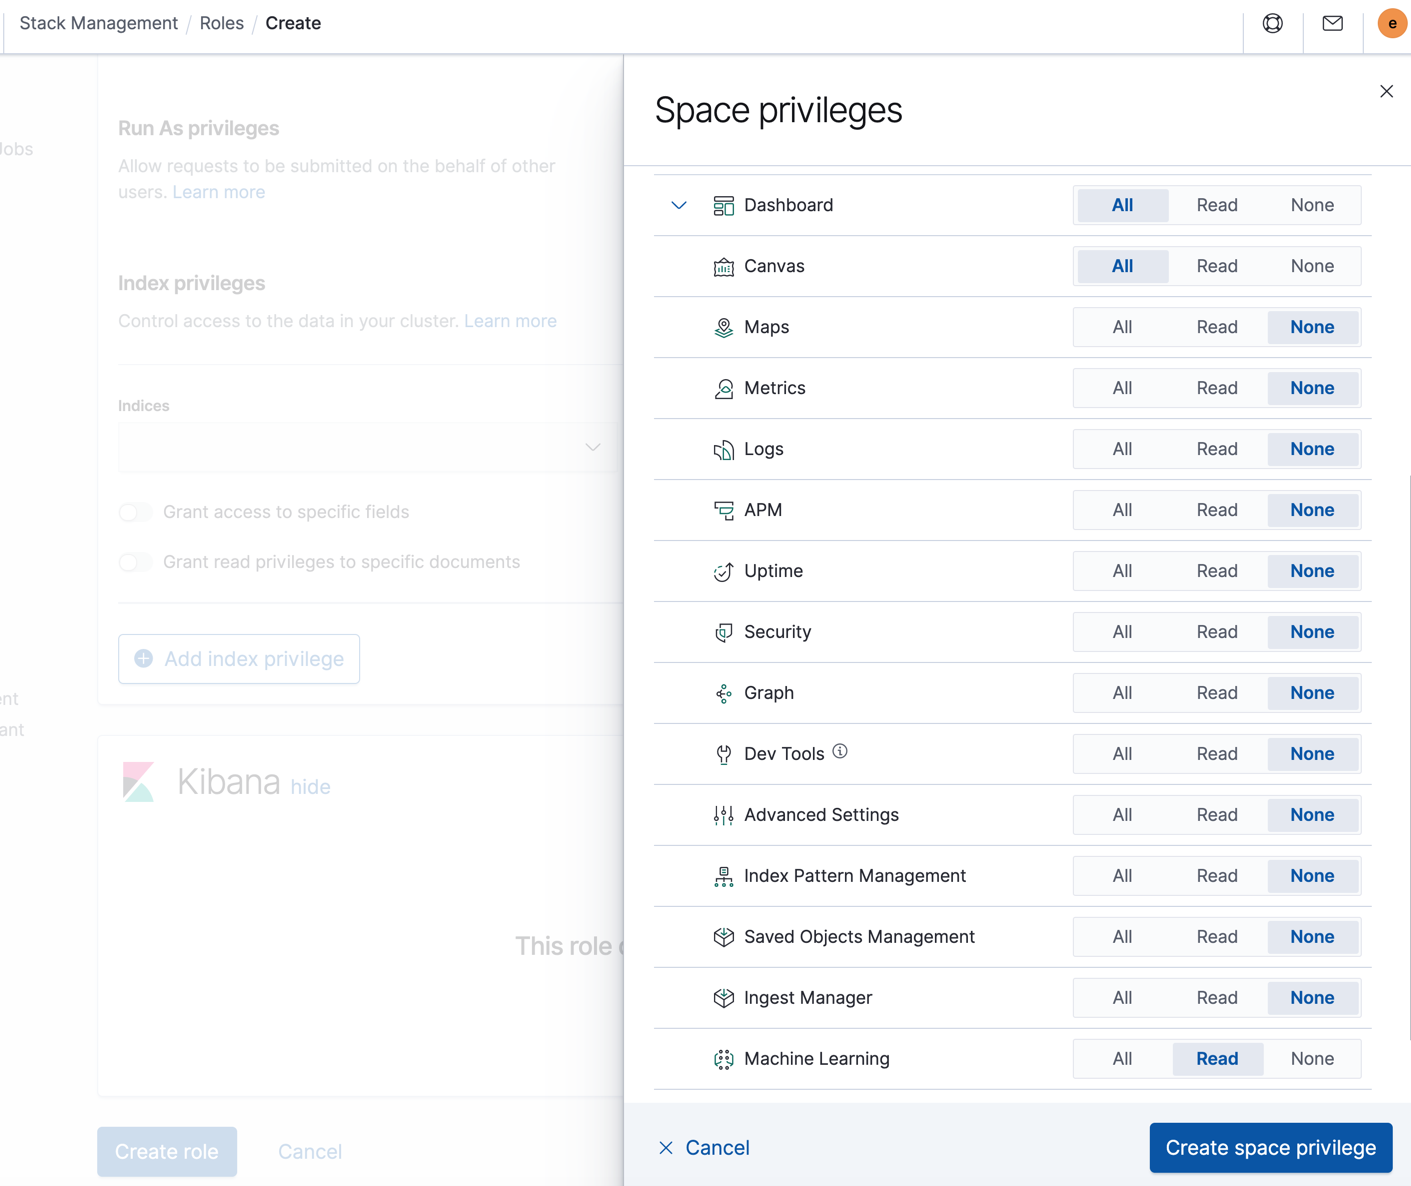
Kibana privileges for machine learning features in spaces
editYou can now grant Kibana privileges for machine learning features in Kibana. If machine learning features are enabled in your space, you can grant read-write, read-only, or no access to all the machine learning objects in that space. For details, see Set up machine learning features.