APM highlights
editAPM highlights
editThis list summarizes the most important enhancements in APM. For the complete list, go to APM release highlights.
- OpenTelemetry integration
-
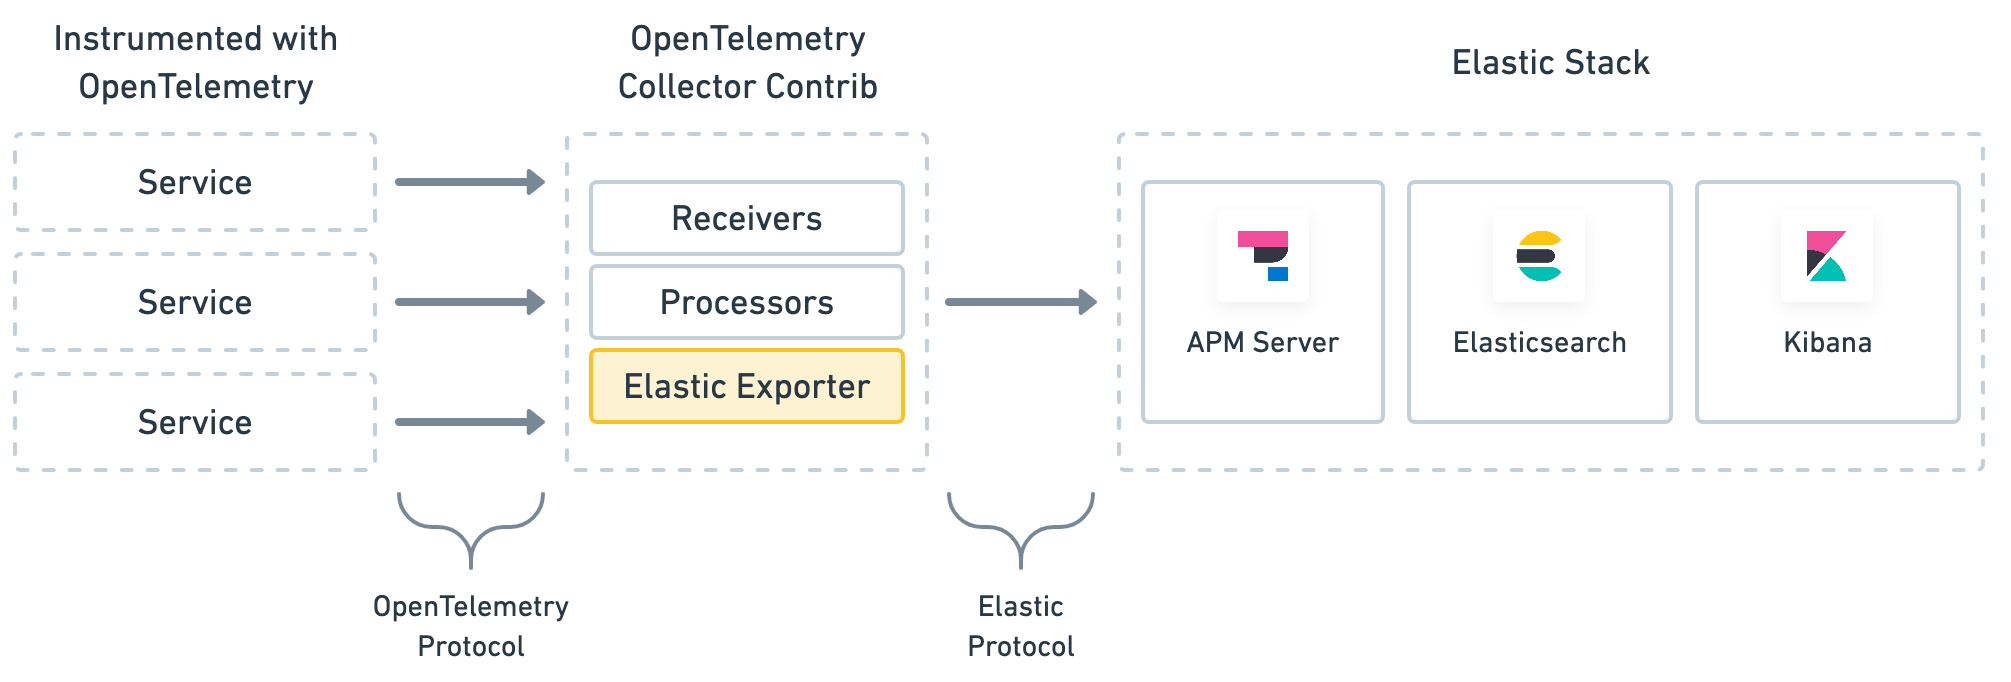
Elastic’s OpenTelemetry integration allows you to reuse your existing OpenTelemetry instrumentation to quickly analyze distributed traces and metrics with the Elastic Stack.
Elastic’s integration is designed to drop right into your current OpenTelemetry setup. We’ve done this by extending the "contrib" OpenTelemetry collector and adding an Elastic exporter. This exporter translates the OpenTelemetry trace data collected from your services to Elastic’s protocol, before sending the data to the Elastic Stack. By extending the OpenTelemetry collector, no changes are needed in your instrumented services in order to begin using the Elastic Stack.
See OpenTelemetry integration for more information.
- Machine learning integration improvements
-
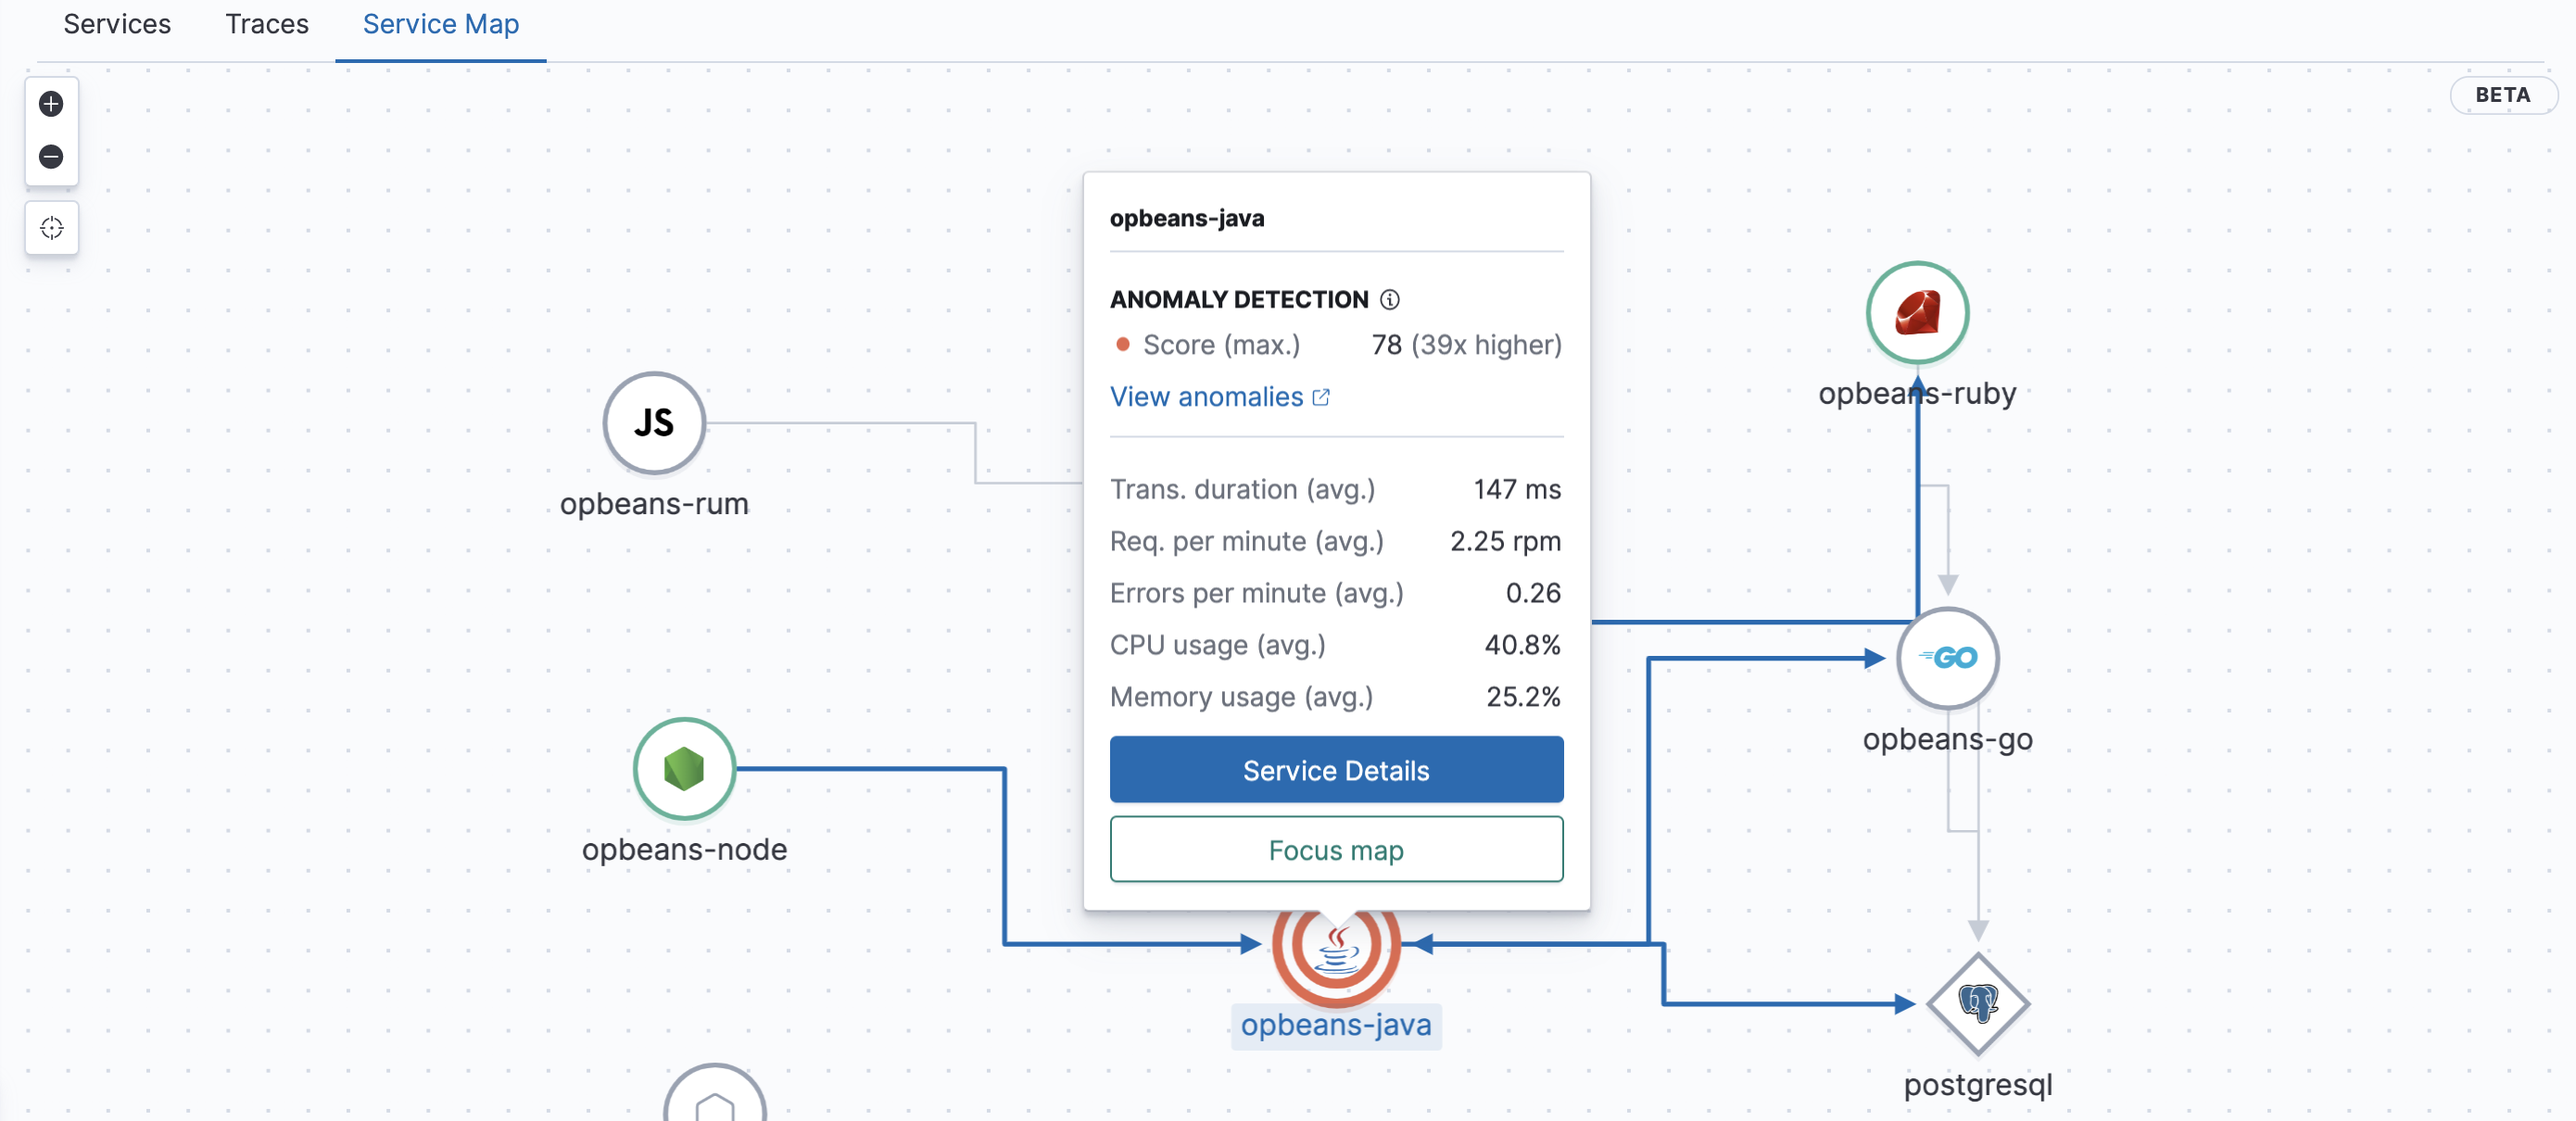
The Machine learning integration initiates a new job predefined to calculate anomaly scores on APM transaction durations. With this integration, you can quickly pinpoint anomalous transactions and see the health of any upstream and downstream services.
In previous releases, machine learning jobs were initiated at the service level. In 7.9, we’ve moved jobs to the environment level—this means any new services added to your architecture will automatically be able to take advantage of preexisting machine learning jobs without any additional configuration.
See machine learning integration for more information.