Step 7: View the sample Kibana dashboards
editStep 7: View the sample Kibana dashboards
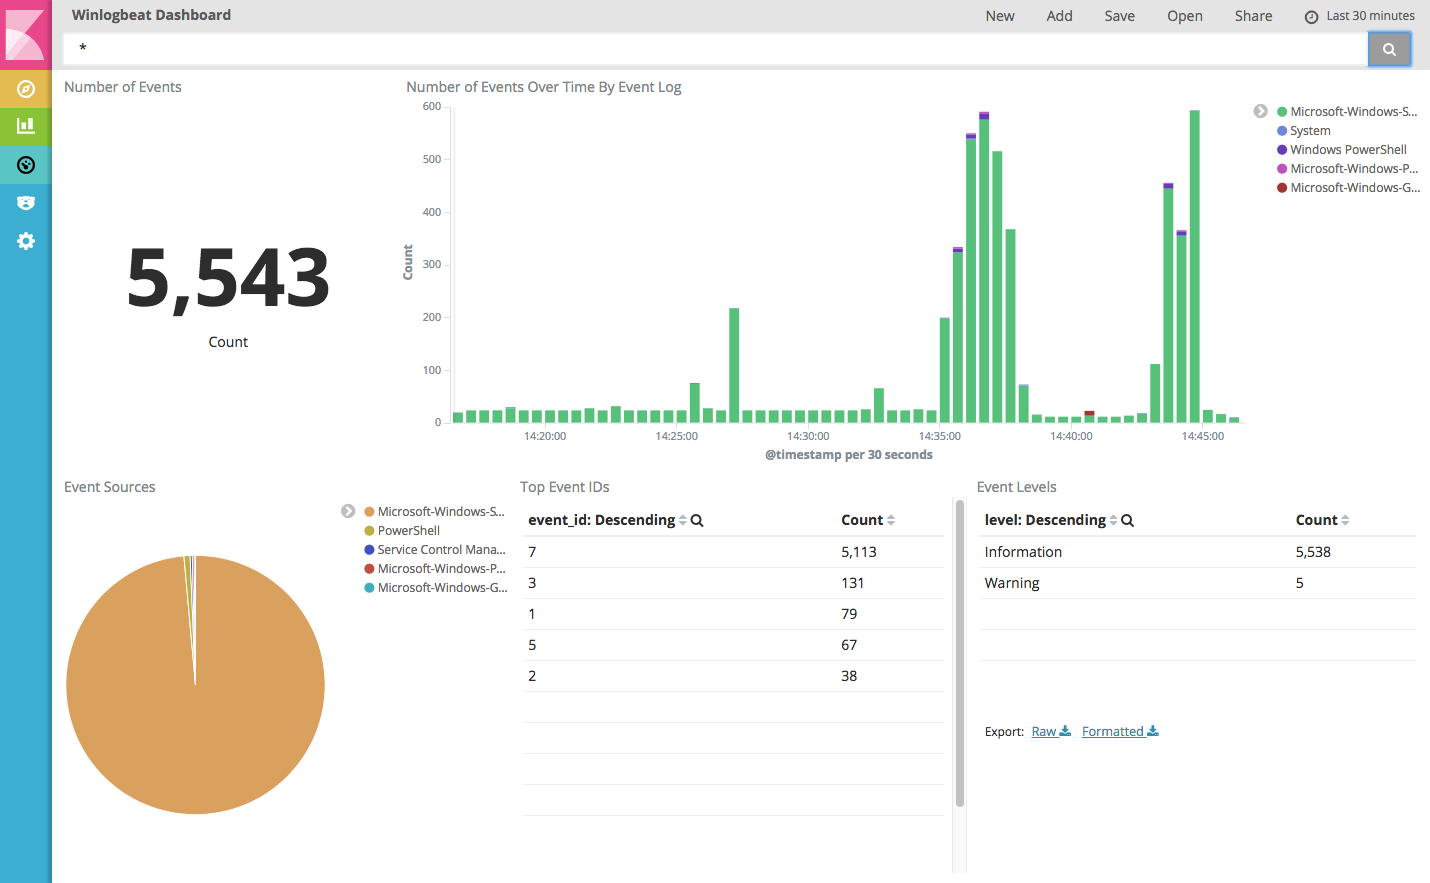
editTo make it easier for you to start monitoring your servers in Kibana, we have
created example Winlogbeat dashboards. You loaded the dashboards earlier
when you ran the setup command.
To open the dashboards, launch the Kibana web interface by pointing your browser
to port 5601. For example, http://localhost:5601.
Replace localhost with the name of the Kibana host. If you’re using an
Elastic Cloud instance, log in to your cloud account,
then navigate to the Kibana endpoint in your deployment.
On the Discover page, make sure that the predefined winlogbeat-* index
pattern is selected to see Winlogbeat data.
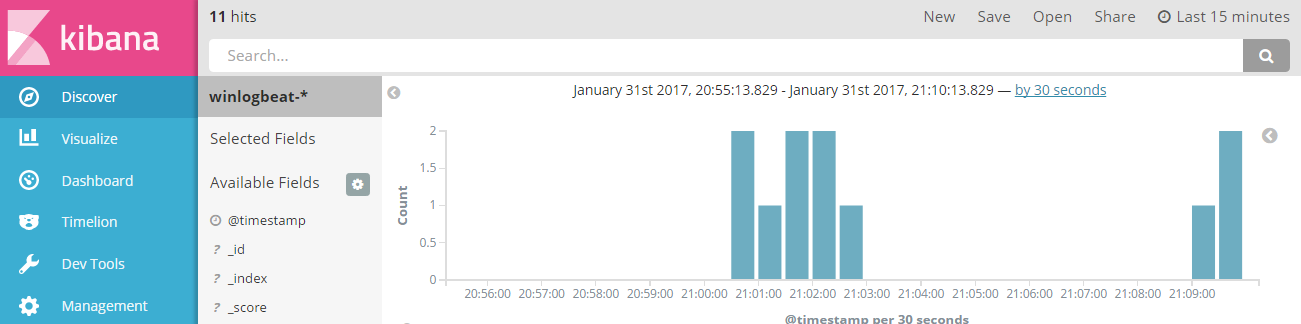
If you don’t see data in Kibana, try changing the date range to a larger range. By default, Kibana shows the last 15 minutes.
Go to the Dashboard page and select the dashboard that you want to open.
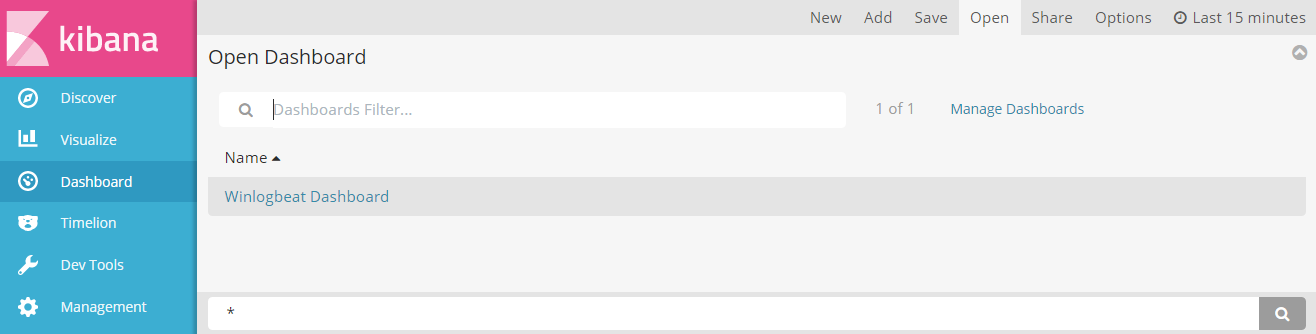
The dashboards are provided as examples. We recommend that you customize them to meet your needs.