WARNING: Version 5.3 of Winlogbeat has passed its EOL date.
This documentation is no longer being maintained and may be removed. If you are running this version, we strongly advise you to upgrade. For the latest information, see the current release documentation.
Step 6: Loading Sample Kibana Dashboards
editStep 6: Loading Sample Kibana Dashboards
editTo make it easier for you to start monitoring your servers in Kibana, we have created sample Winlogbeat dashboards. The dashboards are provided as examples. We recommend that you customize them to meet your needs.
Importing the Dashboards
editWinlogbeat comes packaged with the scripts/import_dashboards script that you can use to import the example dashboards,
visualizations, and searches for Winlogbeat. The script also creates an index pattern,
winlogbeat-*, for Winlogbeat.
The steps in this section show how to import Winlogbeat dashboards. You may want to import dashboards for more than one Beat or specify import options that aren’t described here. See Importing Existing Beat Dashboards in the Beats Platform Reference for a full list of command-line options.
To import the Kibana dashboards for Winlogbeat:
Open a PowerShell prompt as an Administrator (right-click the PowerShell icon and select Run As Administrator). If you are running Windows XP, you may need to download and install PowerShell.
From the directory where you installed Winlogbeat, run the import_dashboards.exe script:
PS > scripts\import_dashboards.exe
By default, the script assumes that you are running Elasticsearch on 127.0.0.1:9200. Use the -es option to specify a different location. For example:
PS > scripts\import_dashboards.exe -es http://192.168.33.60:9200
If script execution is disabled on your system, you need to set the execution policy for the current session to
allow the script to run. For example: PowerShell.exe -ExecutionPolicy UnRestricted -File scripts\import_dashboards.exe -es http://192.168.33.60:9200.
Use the -user option to specify the username and password to use for Elasticsearch authentication:
PS > scripts\import_dashboards.exe -es https://xyz.found.io -user user -pass password
Opening the Dashboards in Kibana
editAfter importing the dashboards, launch the Kibana web interface by pointing your browser to port 5601. For example, http://127.0.0.1:5601.
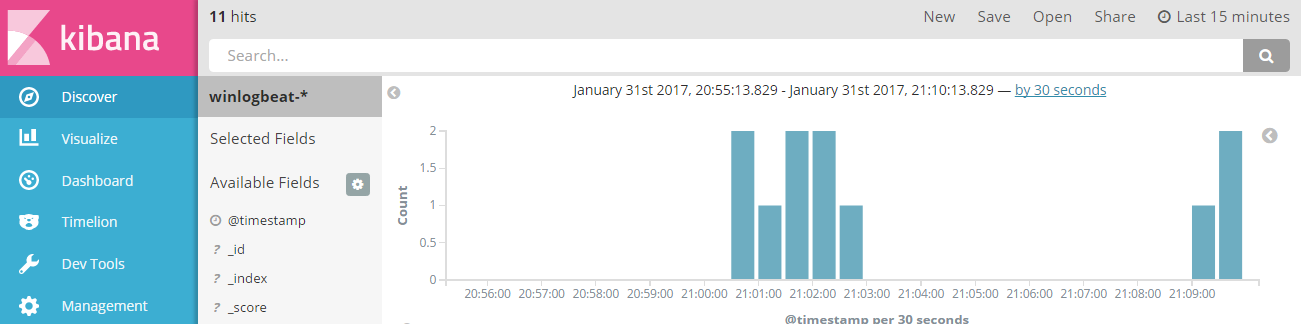
On the Discover page, make sure that the predefined winlogbeat-* index
pattern is selected to see Winlogbeat data.
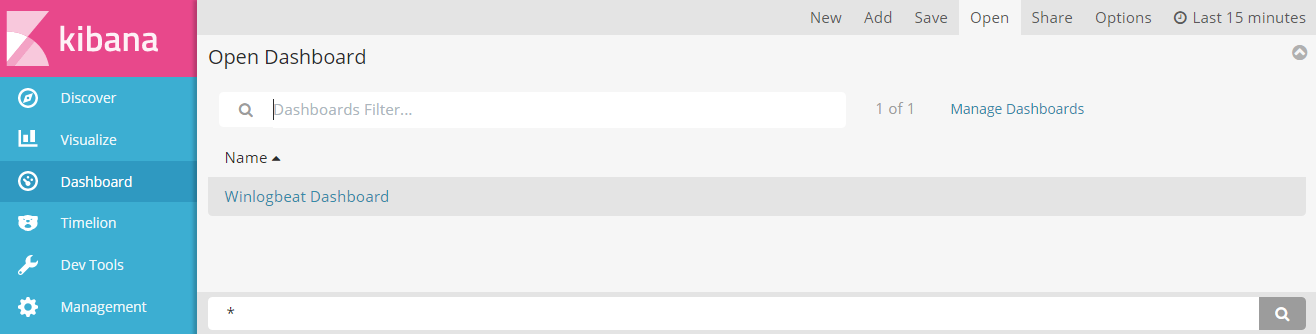
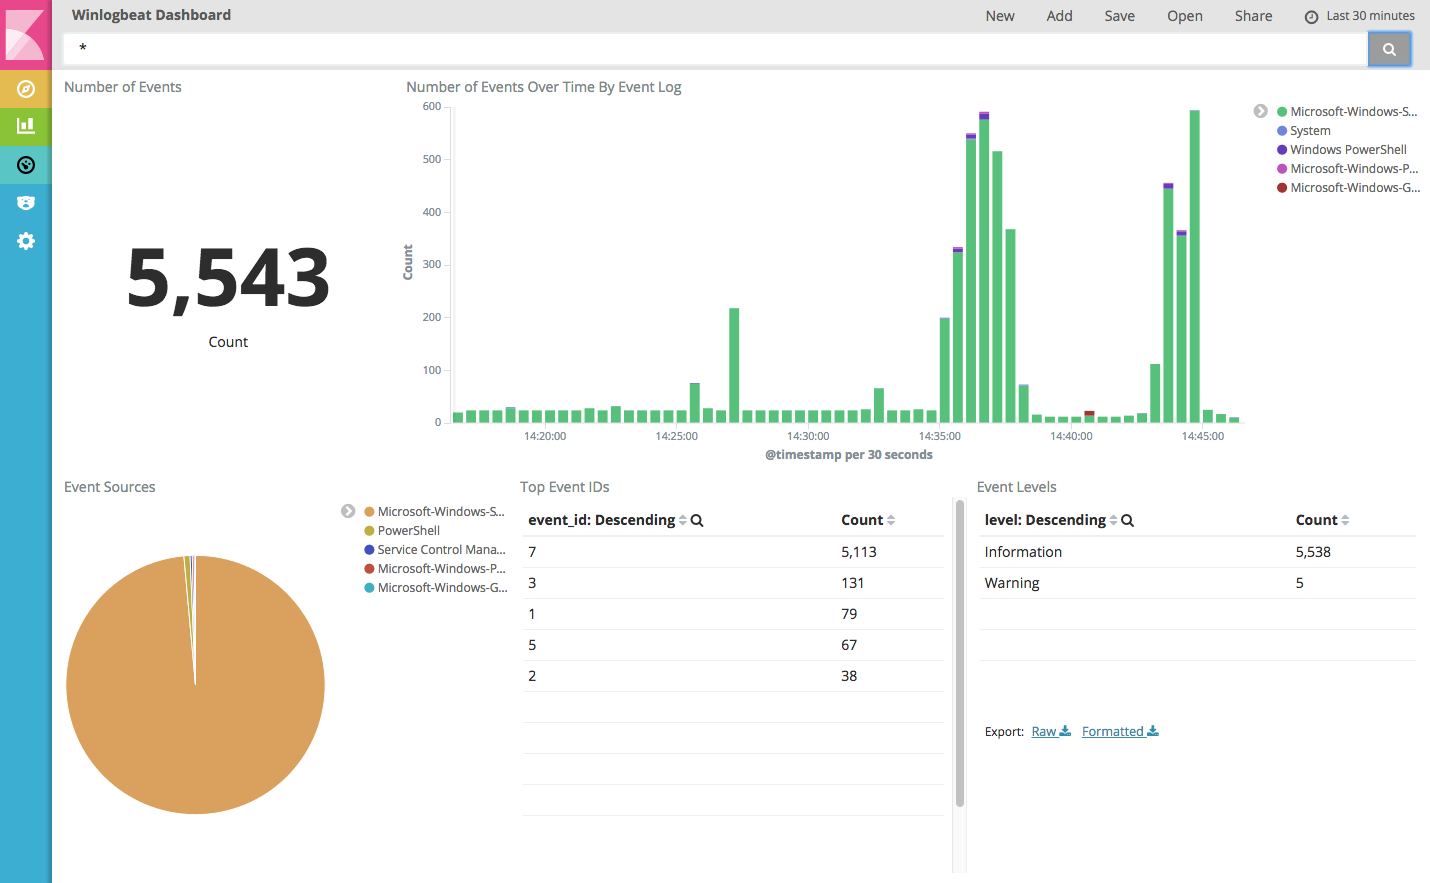
To open the loaded dashboards, go to the Dashboard page and select the dashboard that you want to open.