Ceph module
editCeph module
editThe Ceph module collects metrics by submitting HTTP GET requests to
the ceph-rest-api. The default metricsets are cluster_disk, cluster_health, monitor_health, pool_disk, osd_tree.
Metricsets connecting to the Ceph REST API uses by default the service exposed on port 5000. Metricsets using the Ceph Manager Daemon communicate with the API exposed by default on port 8003 (SSL encryption).
Compatibility
editThe Ceph module is tested with Ceph Jewel (10.2.10) and Ceph Nautilus (14.2.7).
Metricsets with the mgr_ prefix are compatible with Ceph releases using the Ceph Manager Daemon.
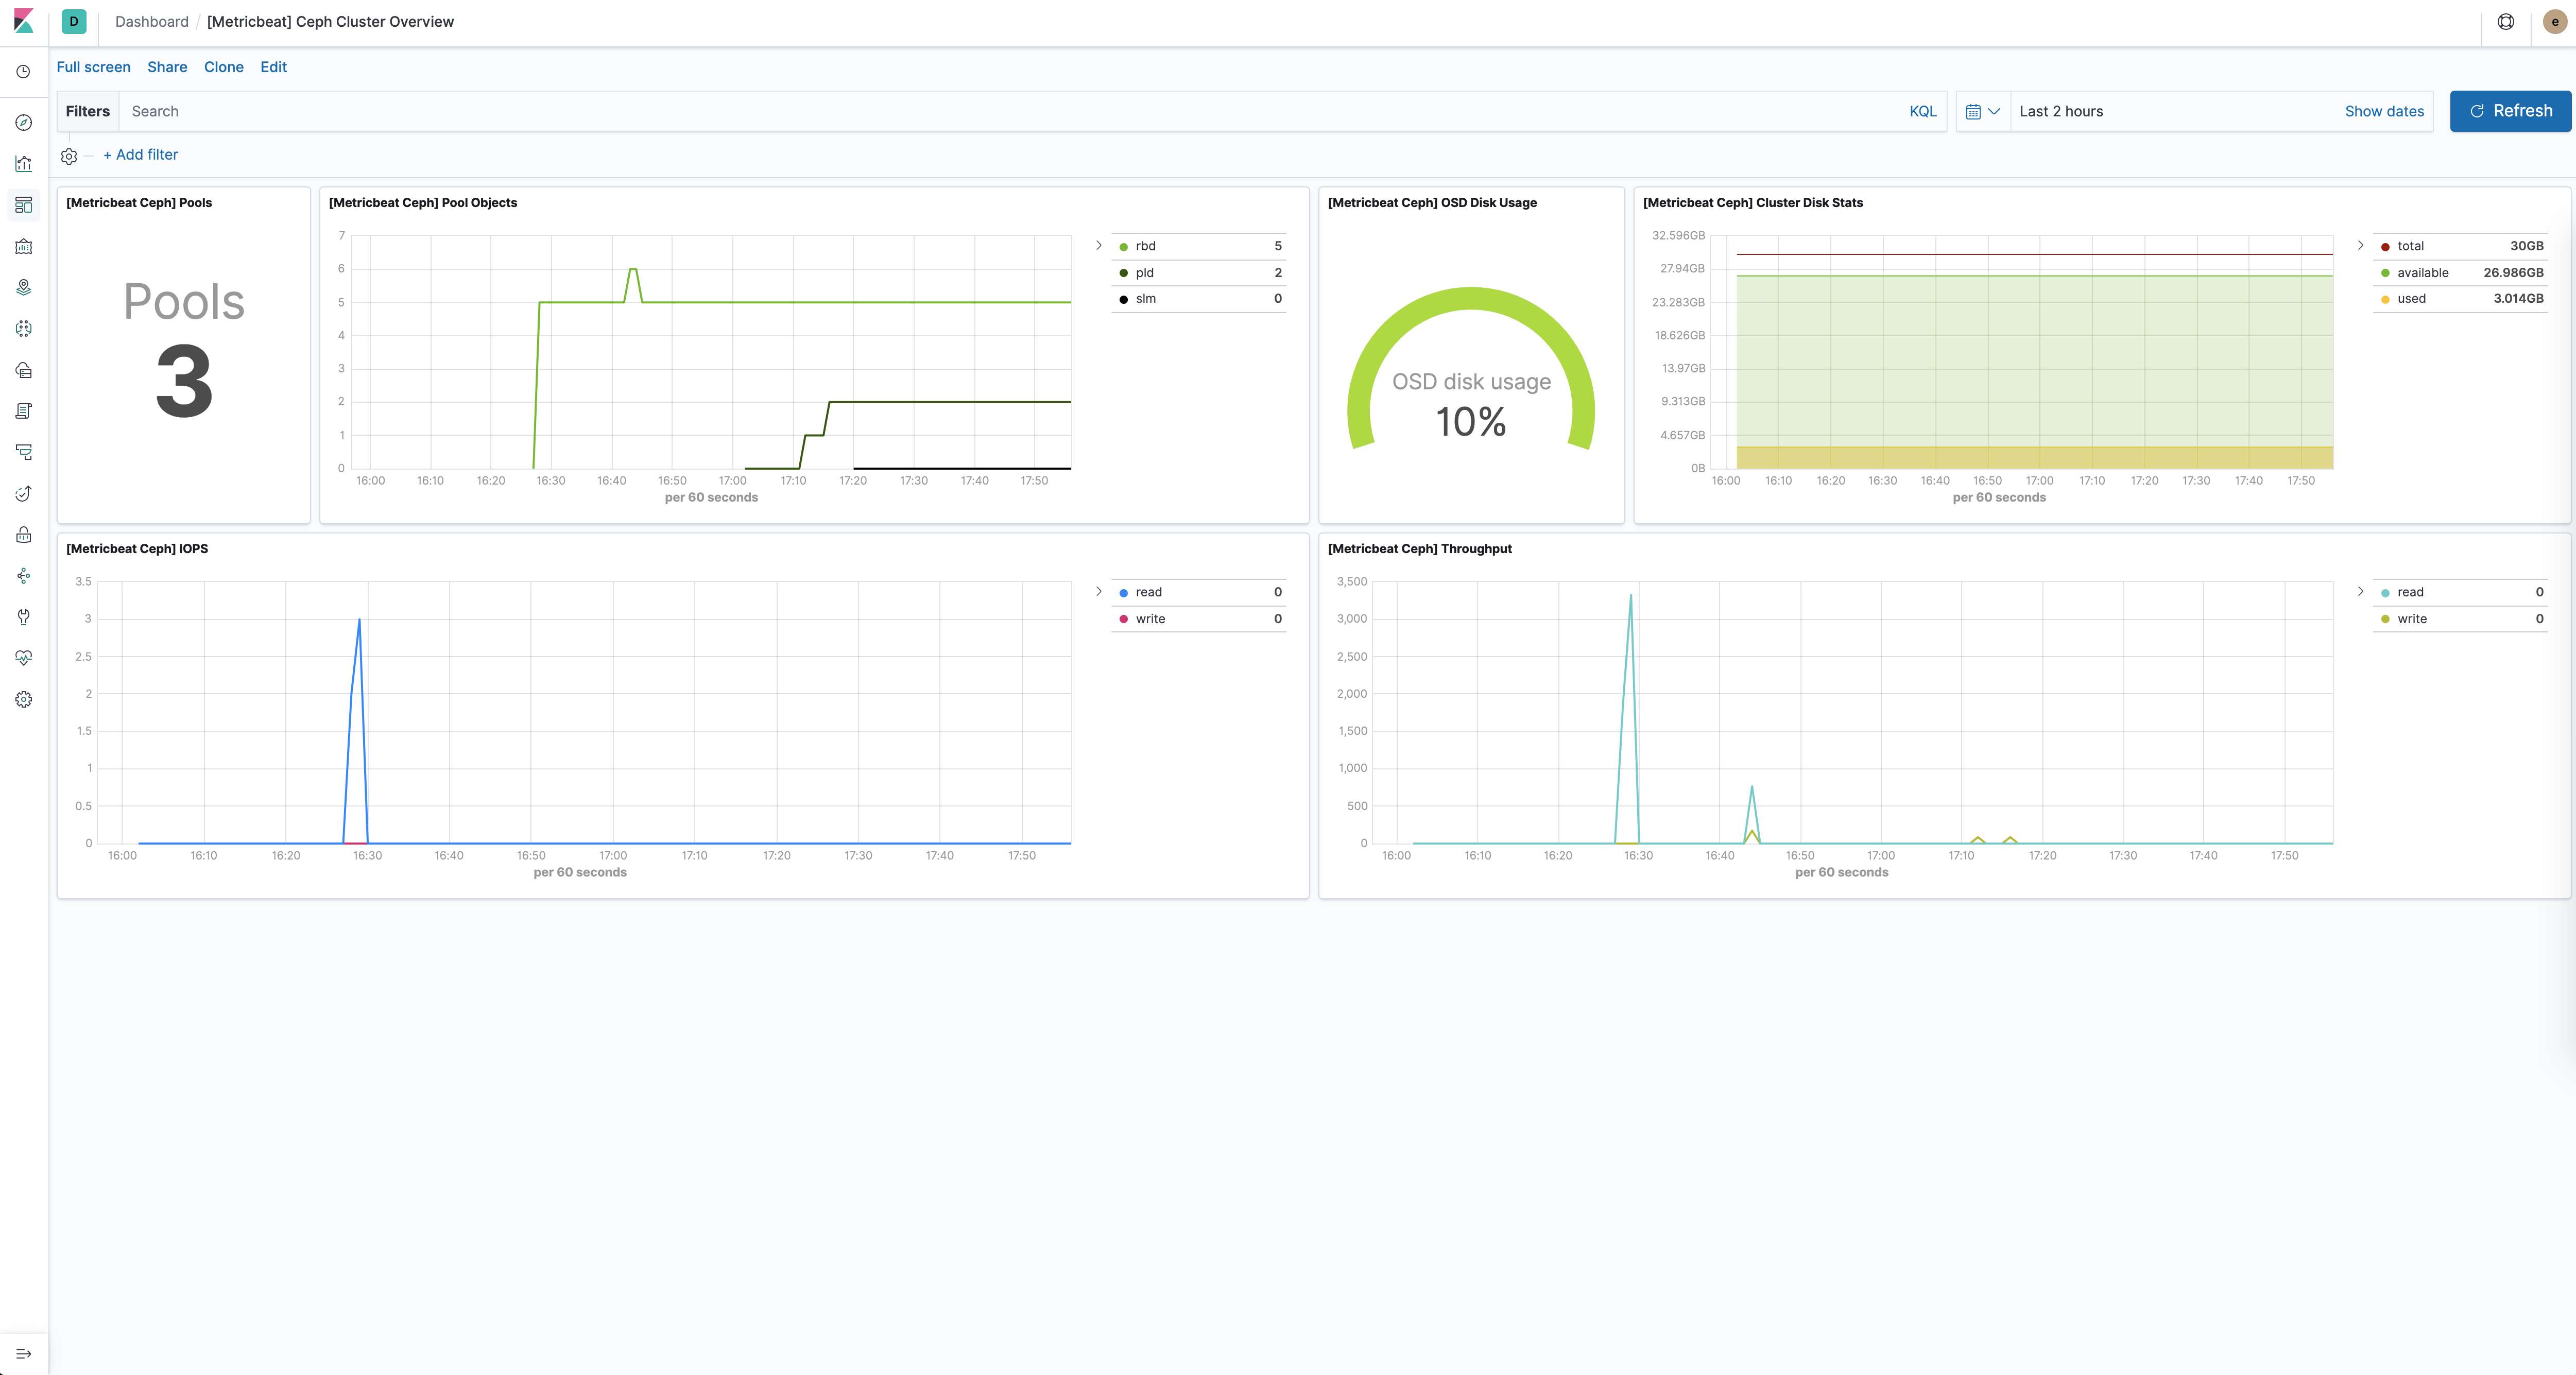
Dashboard
editThe Ceph module comes with a predefined dashboard showing Ceph cluster related metrics. For example:
Example configuration
editThe Ceph module supports the standard configuration options that are described in Modules. Here is an example configuration:
metricbeat.modules:
# Metricsets depending on the Ceph REST API (default port: 5000)
- module: ceph
  metricsets: ["cluster_disk", "cluster_health", "monitor_health", "pool_disk", "osd_tree"]
  period: 10s
  hosts: ["localhost:5000"]
  enabled: true

# Metricsets depending on the Ceph Manager Daemon (default port: 8003)
- module: ceph
  metricsets:
    - mgr_cluster_disk
    - mgr_osd_perf
    - mgr_pool_disk
    - mgr_osd_pool_stats
    - mgr_osd_tree
  period: 1m
  hosts: [ "https://localhost:8003" ]
  #username: "user"
  #password: "secret"
This module supports TLS connections when using ssl config field, as described in SSL.
It also supports the options described in Standard HTTP config options.
Metricsets
editThe following metricsets are available: