WARNING: Version 5.0 of Metricbeat has passed its EOL date.
This documentation is no longer being maintained and may be removed. If you are running this version, we strongly advise you to upgrade. For the latest information, see the current release documentation.
System Module
editSystem Module
editThe System module allows you to monitor your servers. Because the System module always applies to the local
server, the hosts config option is not needed.
Module-Specific Configuration Notes
editThe System module has these additional config options:
-
processes -
When the
processmetricset is enabled, you can use theprocessesoption to define a list of regexp expressions to filter the processes that are reported. For more complex filtering, you should use the processors configuration option.The following example config returns metrics for all processes:
metricbeat.modules:
- module: system
  metricsets: ["process"]
  processes: ['.*']
-
cgroups -
When the
processmetricset is enabled, you can use the booleancgroupsoption to enable the experimental cgroup metrics on Linux.The following example config enables cgroups metrics on Linux.
metricbeat.modules:
- module: system
  metricsets: ["process"]
  cgroups: true
-
cpu_ticks -
When the
cpuorcoremetricset is enabled, you can specifycpu_ticks: trueto report CPU ticks in addition to CPU percentages stats. For example:metricbeat.modules: - module: system metricsets: ["cpu", "core"] cpu_ticks: true
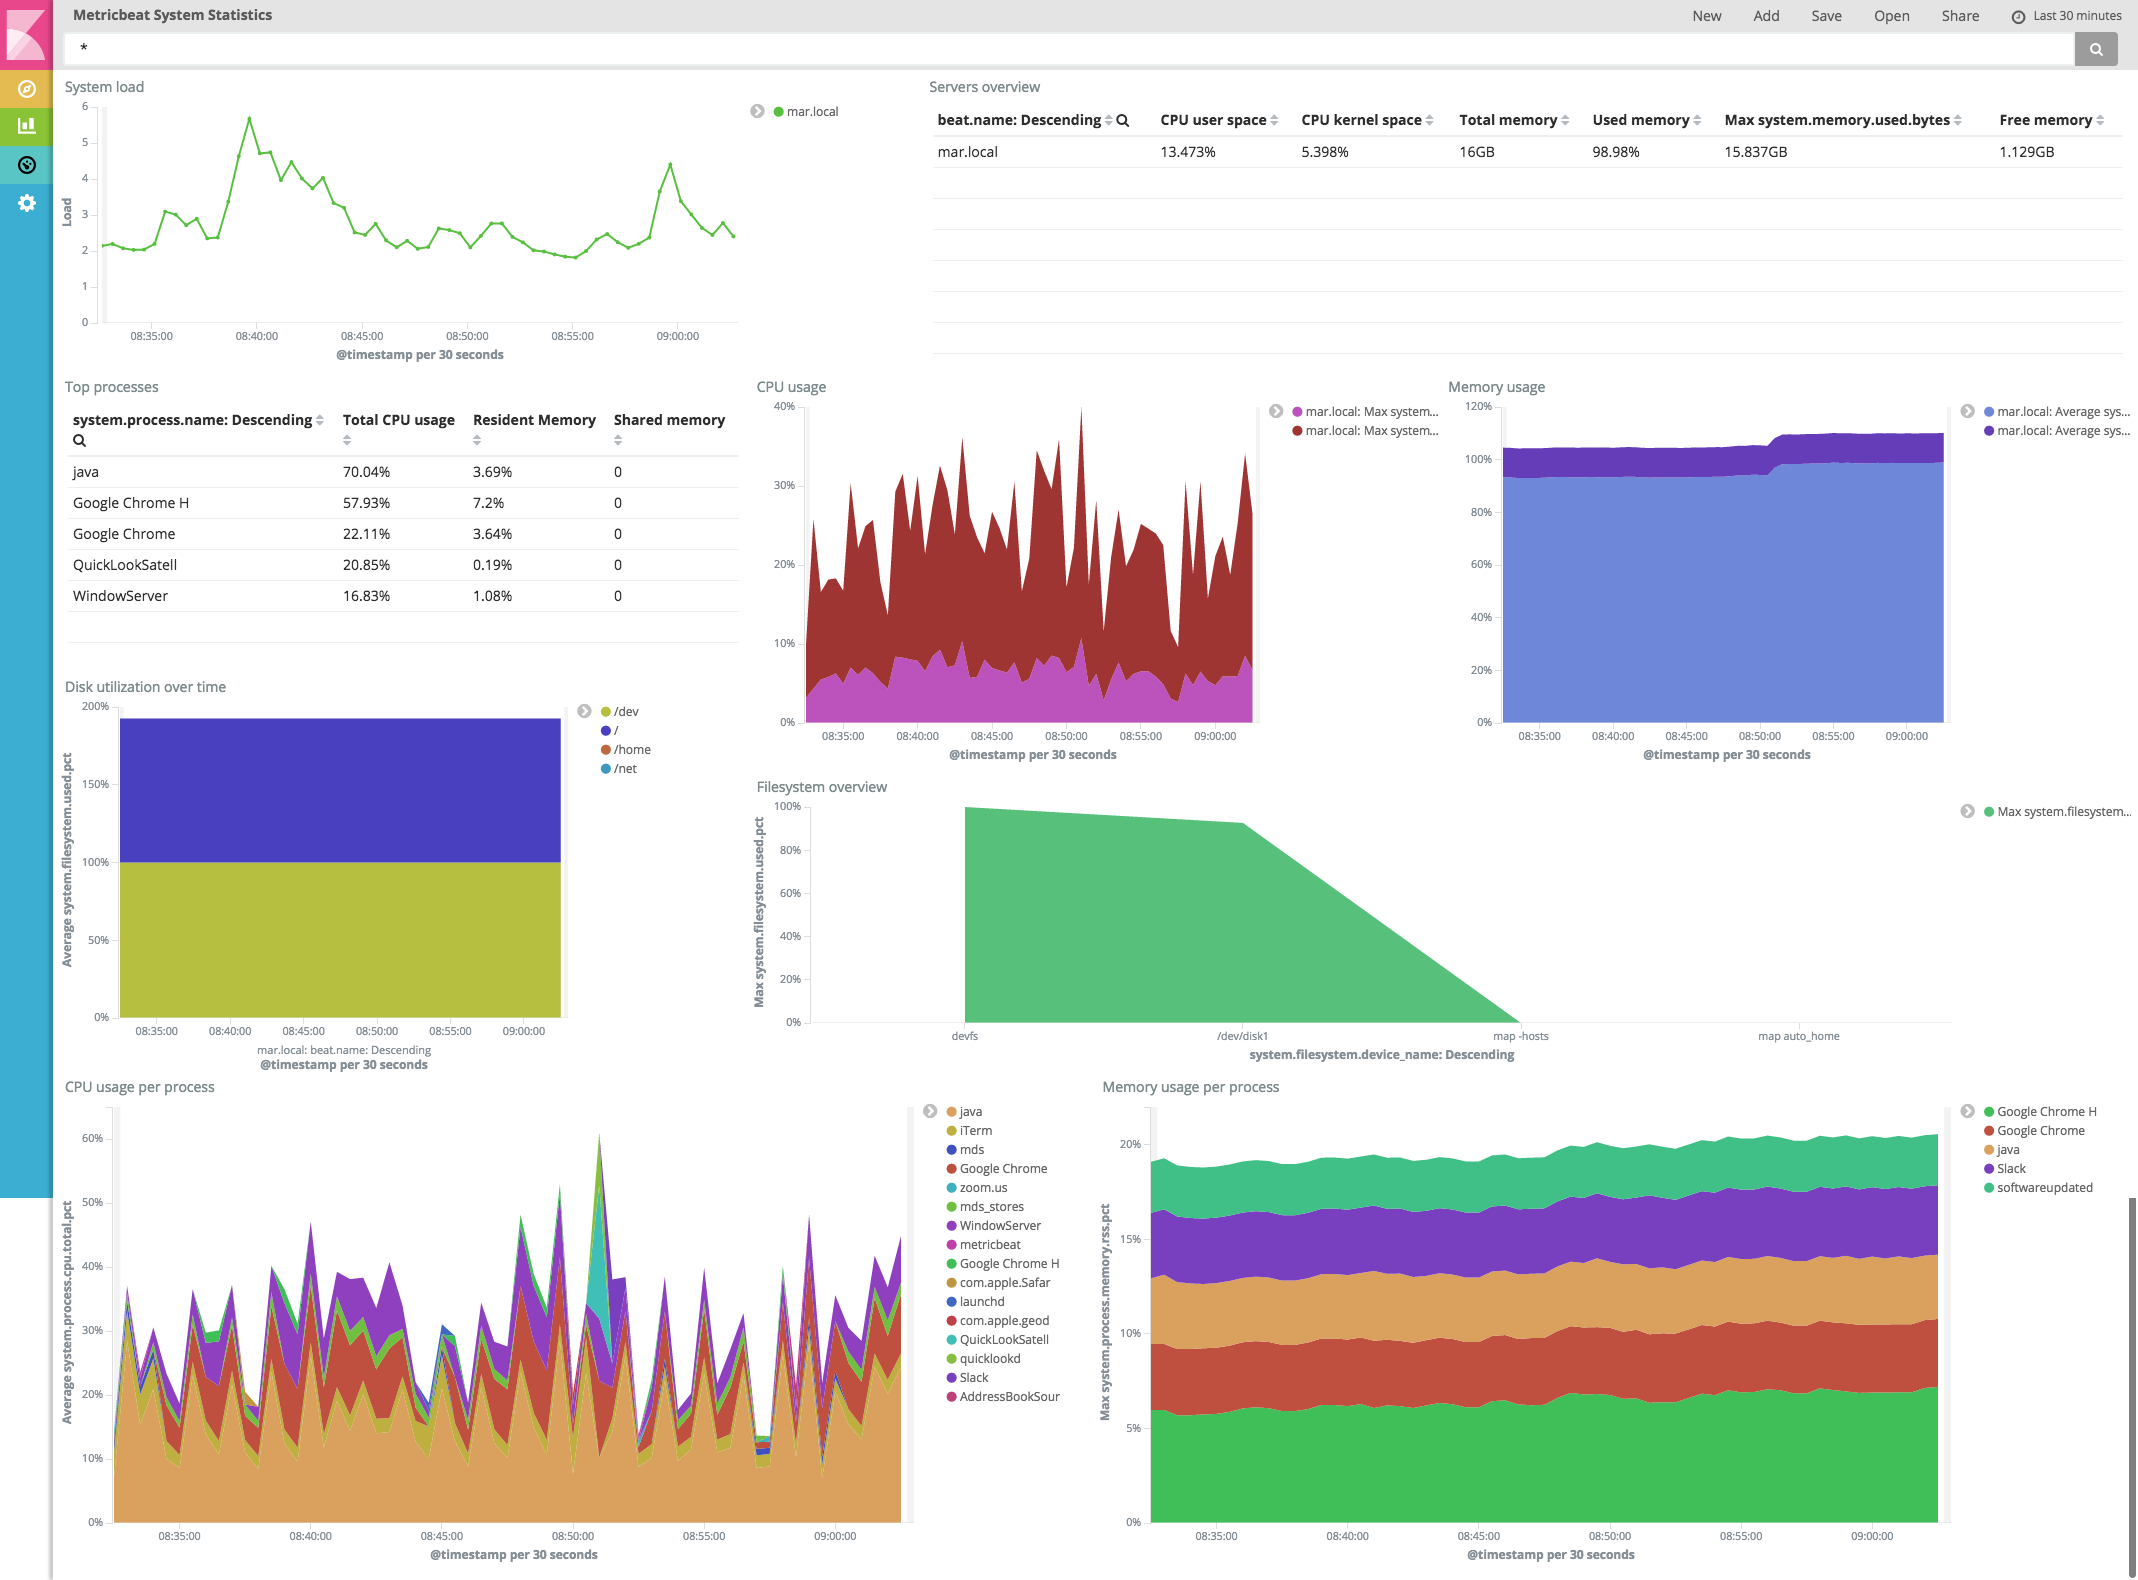
Dashboard
editThe System module comes with a predefined dashboard. For example:
Example Configuration
editThe System module supports the standard configuration options that are described in Modules Configuration. Here is an example configuration:
metricbeat.modules:
- module: system
  metricsets:
    # CPU stats
    - cpu

    # System Load stats
    - load

    # Per CPU core stats
    #- core

    # IO stats
    #- diskio

    # Per filesystem stats
    - filesystem

    # File system summary stats
    - fsstat

    # Memory stats
    - memory

    # Network stats
    - network

    # Per process stats
    - process
  enabled: true
  period: 10s
  processes: ['.*']
Metricsets
editThe following metricsets are available: