WARNING: Version 1.2 of Beats has passed its EOL date.
This documentation is no longer being maintained and may be removed. If you are running this version, we strongly advise you to upgrade. For the latest information, see the current release documentation.
Opening the Beats Dashboards in Kibana
editOpening the Beats Dashboards in Kibana
editAfter loading the Beats dashboards,
launch the Kibana web interface by pointing your browser
to port 5601. For example, http://127.0.0.1:5601.
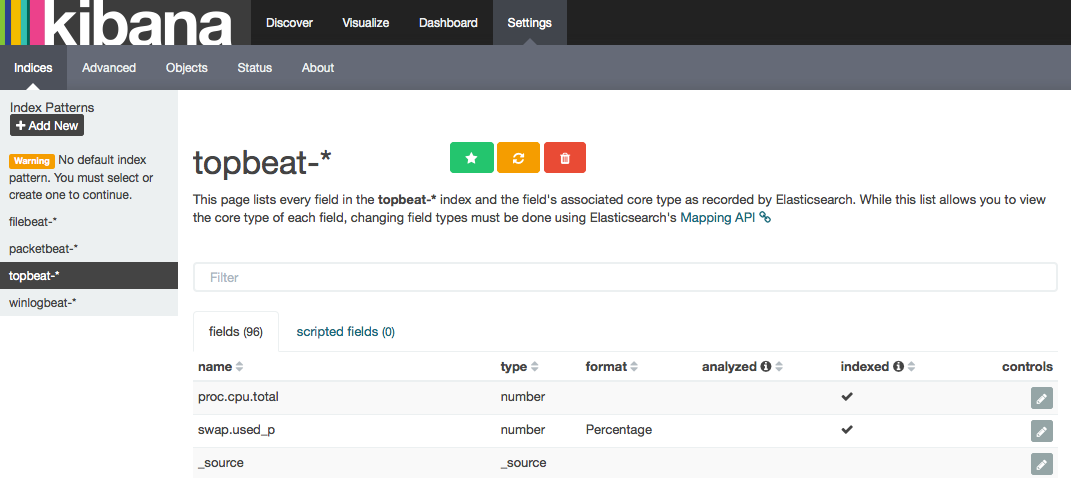
If Kibana raises a No default index pattern error, you must select or create
an index pattern to continue. You can resolve the error by refreshing the page
in the browser and then setting one of the predefined index patterns as the default.
To open the loaded dashboards, go to the Dashboard page and click the
Load Saved Dashboard icon. Select Packetbeat Dashboard from the list.
You can then easily switch between the dashboards by using the Navigation widget.
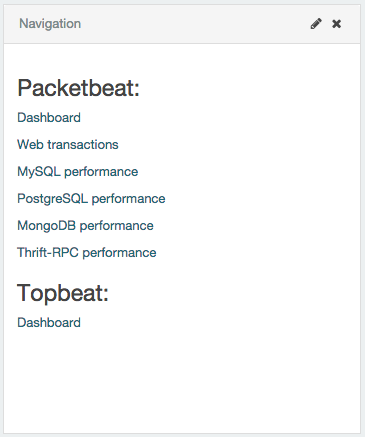
Of course, you won’t see actual data until you’ve installed and configured your Beat.
pass::[<?page_header <b>PLEASE NOTE:</b><br/>Always refer to the documentation in master for the latest information about contributing to Beats.?>]