WARNING: Version 5.3 of Filebeat has passed its EOL date.
This documentation is no longer being maintained and may be removed. If you are running this version, we strongly advise you to upgrade. For the latest information, see the current release documentation.
Quick Start for Common Log Formats
editQuick Start for Common Log Formats
editThis functionality is in beta and is subject to change. The design and code is less mature than official GA features and is being provided as-is with no warranties. Beta features are not subject to the support SLA of official GA features.
Filebeat provides a set of pre-built modules that you can use to rapidly implement and deploy a log monitoring solution, complete with sample dashboards and data visualizations, in about 5 minutes. These modules support common log formats, such as Nginx, Apache2, and MySQL, and can be run by issuing a simple command.
This topic shows you how to run the basic modules out of the box without extra configuration. For detailed documentation and the full list of available modules, see Modules.
If you are using a log file type that isn’t supported by one of the available Filebeat modules, you’ll need to set up and configure Filebeat manually by following the numbered steps under Getting Started With Filebeat.
Prerequisites
editBefore running Filebeat with modules enabled, you need to:
- Install and configure the Elastic stack. See Getting Started with Beats and the Elastic Stack.
- Complete the Filebeat installation instructions described in Step 1: Installing Filebeat. After installing Filebeat, return to this quick start page.
-
Install the Ingest Node GeoIP and User Agent plugins. These plugins are required to capture the geographical location and browser information used by some of the visualizations available in the sample dashboards. You can install these plugins by running the following commands in the Elasticsearch home path:
sudo bin/elasticsearch-plugin install ingest-geoip
sudo bin/elasticsearch-plugin install ingest-user-agent
You need to restart Elasticsearch after running these commands.
- Verify that Elasticsearch and Kibana are running and that Elasticsearch is ready to receive data from Filebeat.
Running Filebeat with Modules Enabled
editTo run one or more Filebeat modules, you issue the following command:
./filebeat -e -modules=MODULES -setup
Where MODULES is the name of the module (or a comma-separated list of
modules) that you want to enable. The -e flag is optional and sends output
to standard error instead of syslog. The -setup flag is a one-time setup step.
For subsequent runs of Filebeat, do not specify this flag.
The following example starts Filebeat with the system module enabled and
loads the sample Kibana dashboards:
./filebeat -e -modules=system -setup
This command takes care of configuring Filebeat, loading the recommended index template for writing to Elasticsearch, and deploying the sample dashboards for visualizing the data in Kibana.
Depending on how you’ve installed Filebeat, you might see errors related to file ownership or permissions when you try to run Filebeat modules. See Config File Ownership and Permissions in the Beats Platform Reference if you encounter errors related to file ownership or permissions.
Because Filebeat modules are currently in Beta, the default Filebeat
configuration may interfere with the Filebeat system module configuration. If
you plan to run the system module, edit the Filebeat configuration file,
filebeat.yml, and comment out the following lines:
#- input_type: log
  #paths:
    #- /var/log/*.log
For rpm and deb, you’ll find the configuration file at
/etc/filebeat/filebeat.yml. For mac and win, look in the archive that you
extracted when you installed Filebeat.
To start Filebeat with the system, nginx, and mysql modules enabled
and load the sample dashboards, run:
./filebeat -e -modules=system,nginx,mysql -setup
To start Filebeat with the system module enabled (it’s assumed that
you’ve already loaded the sample dashboards), run:
./filebeat -e -modules=system
In a production environment, you’ll probably want to use a configuration file, rather than command-line flags, to specify which modules to run. See the detailed documentation for more about configuring and running modules.
These examples assume that the logs you’re harvesting are in the location expected for your OS and that the default behavior of Filebeat is appropriate for your environment. Each module provides a set of variables that you can set to fine tune the behavior of Filebeat, including the location where it looks for log files. See Modules for more info.
Visualizing the Data in Kibana
editAfter you’ve confirmed that Filebeat is sending events to Elasticsearch, launch the Kibana web interface by pointing your browser to port 5601. For example, http://127.0.0.1:5601.
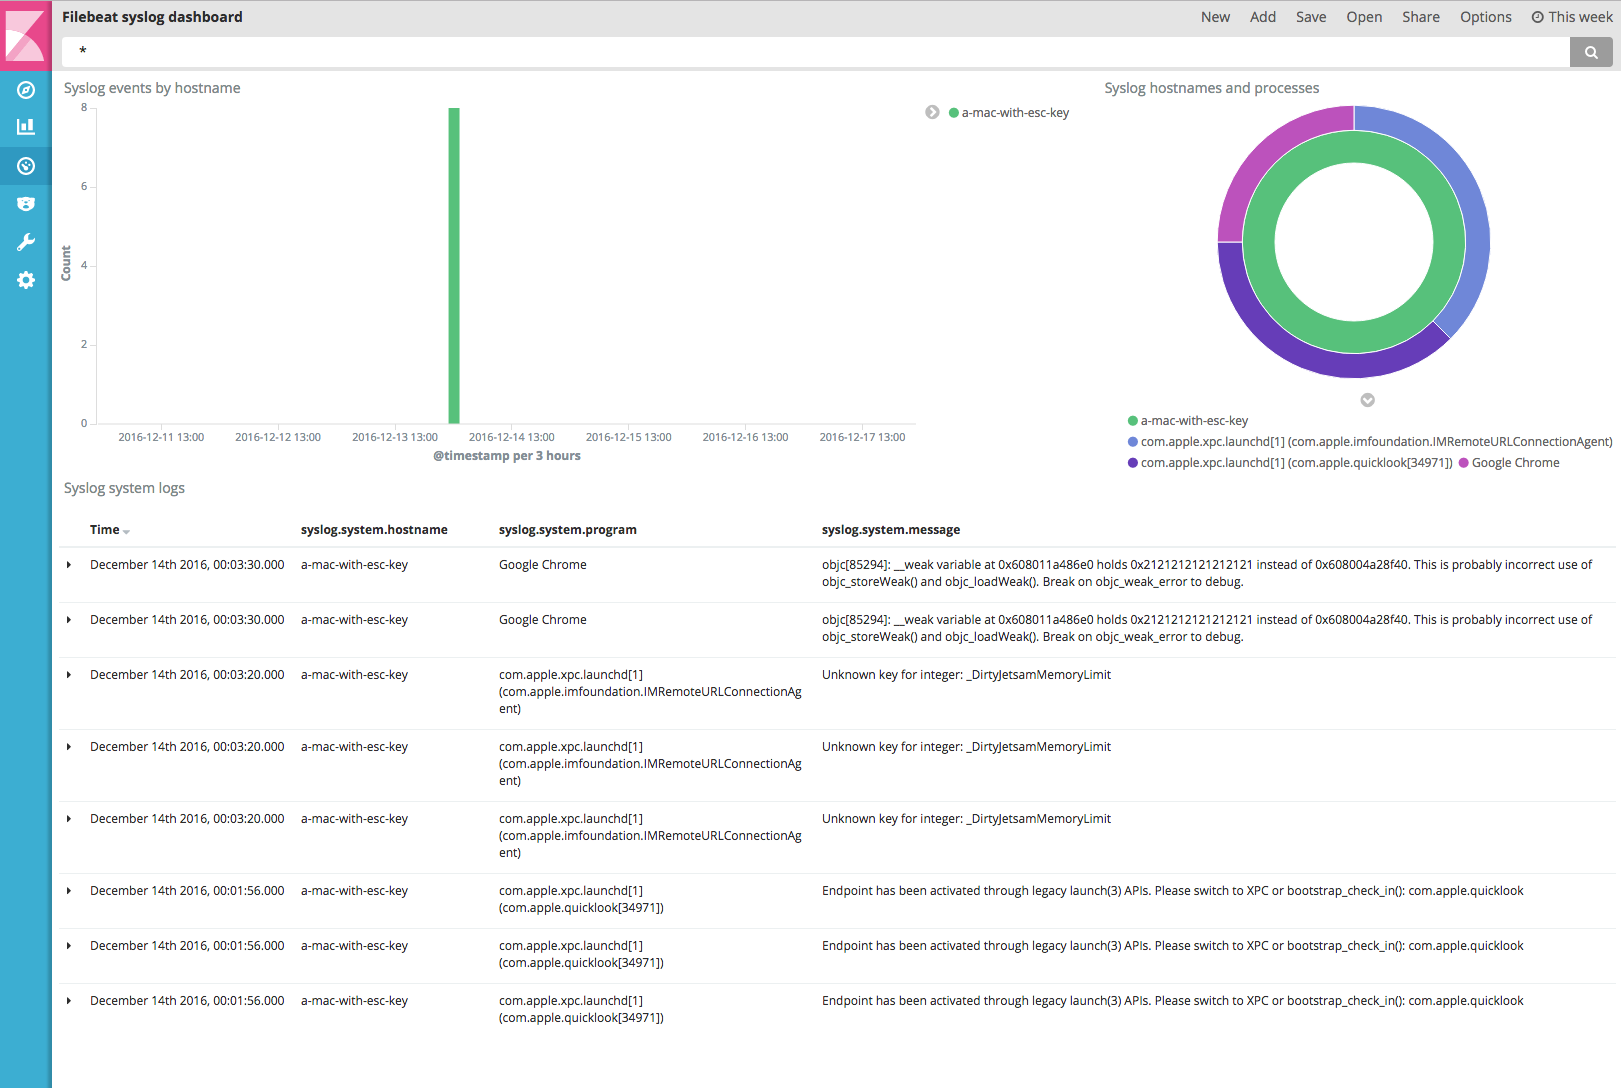
Open the dashboard and explore the visualizations for your parsed logs.
Here’s an example of the syslog dashboard: