APM version 7.7.0edit
- Service maps
-
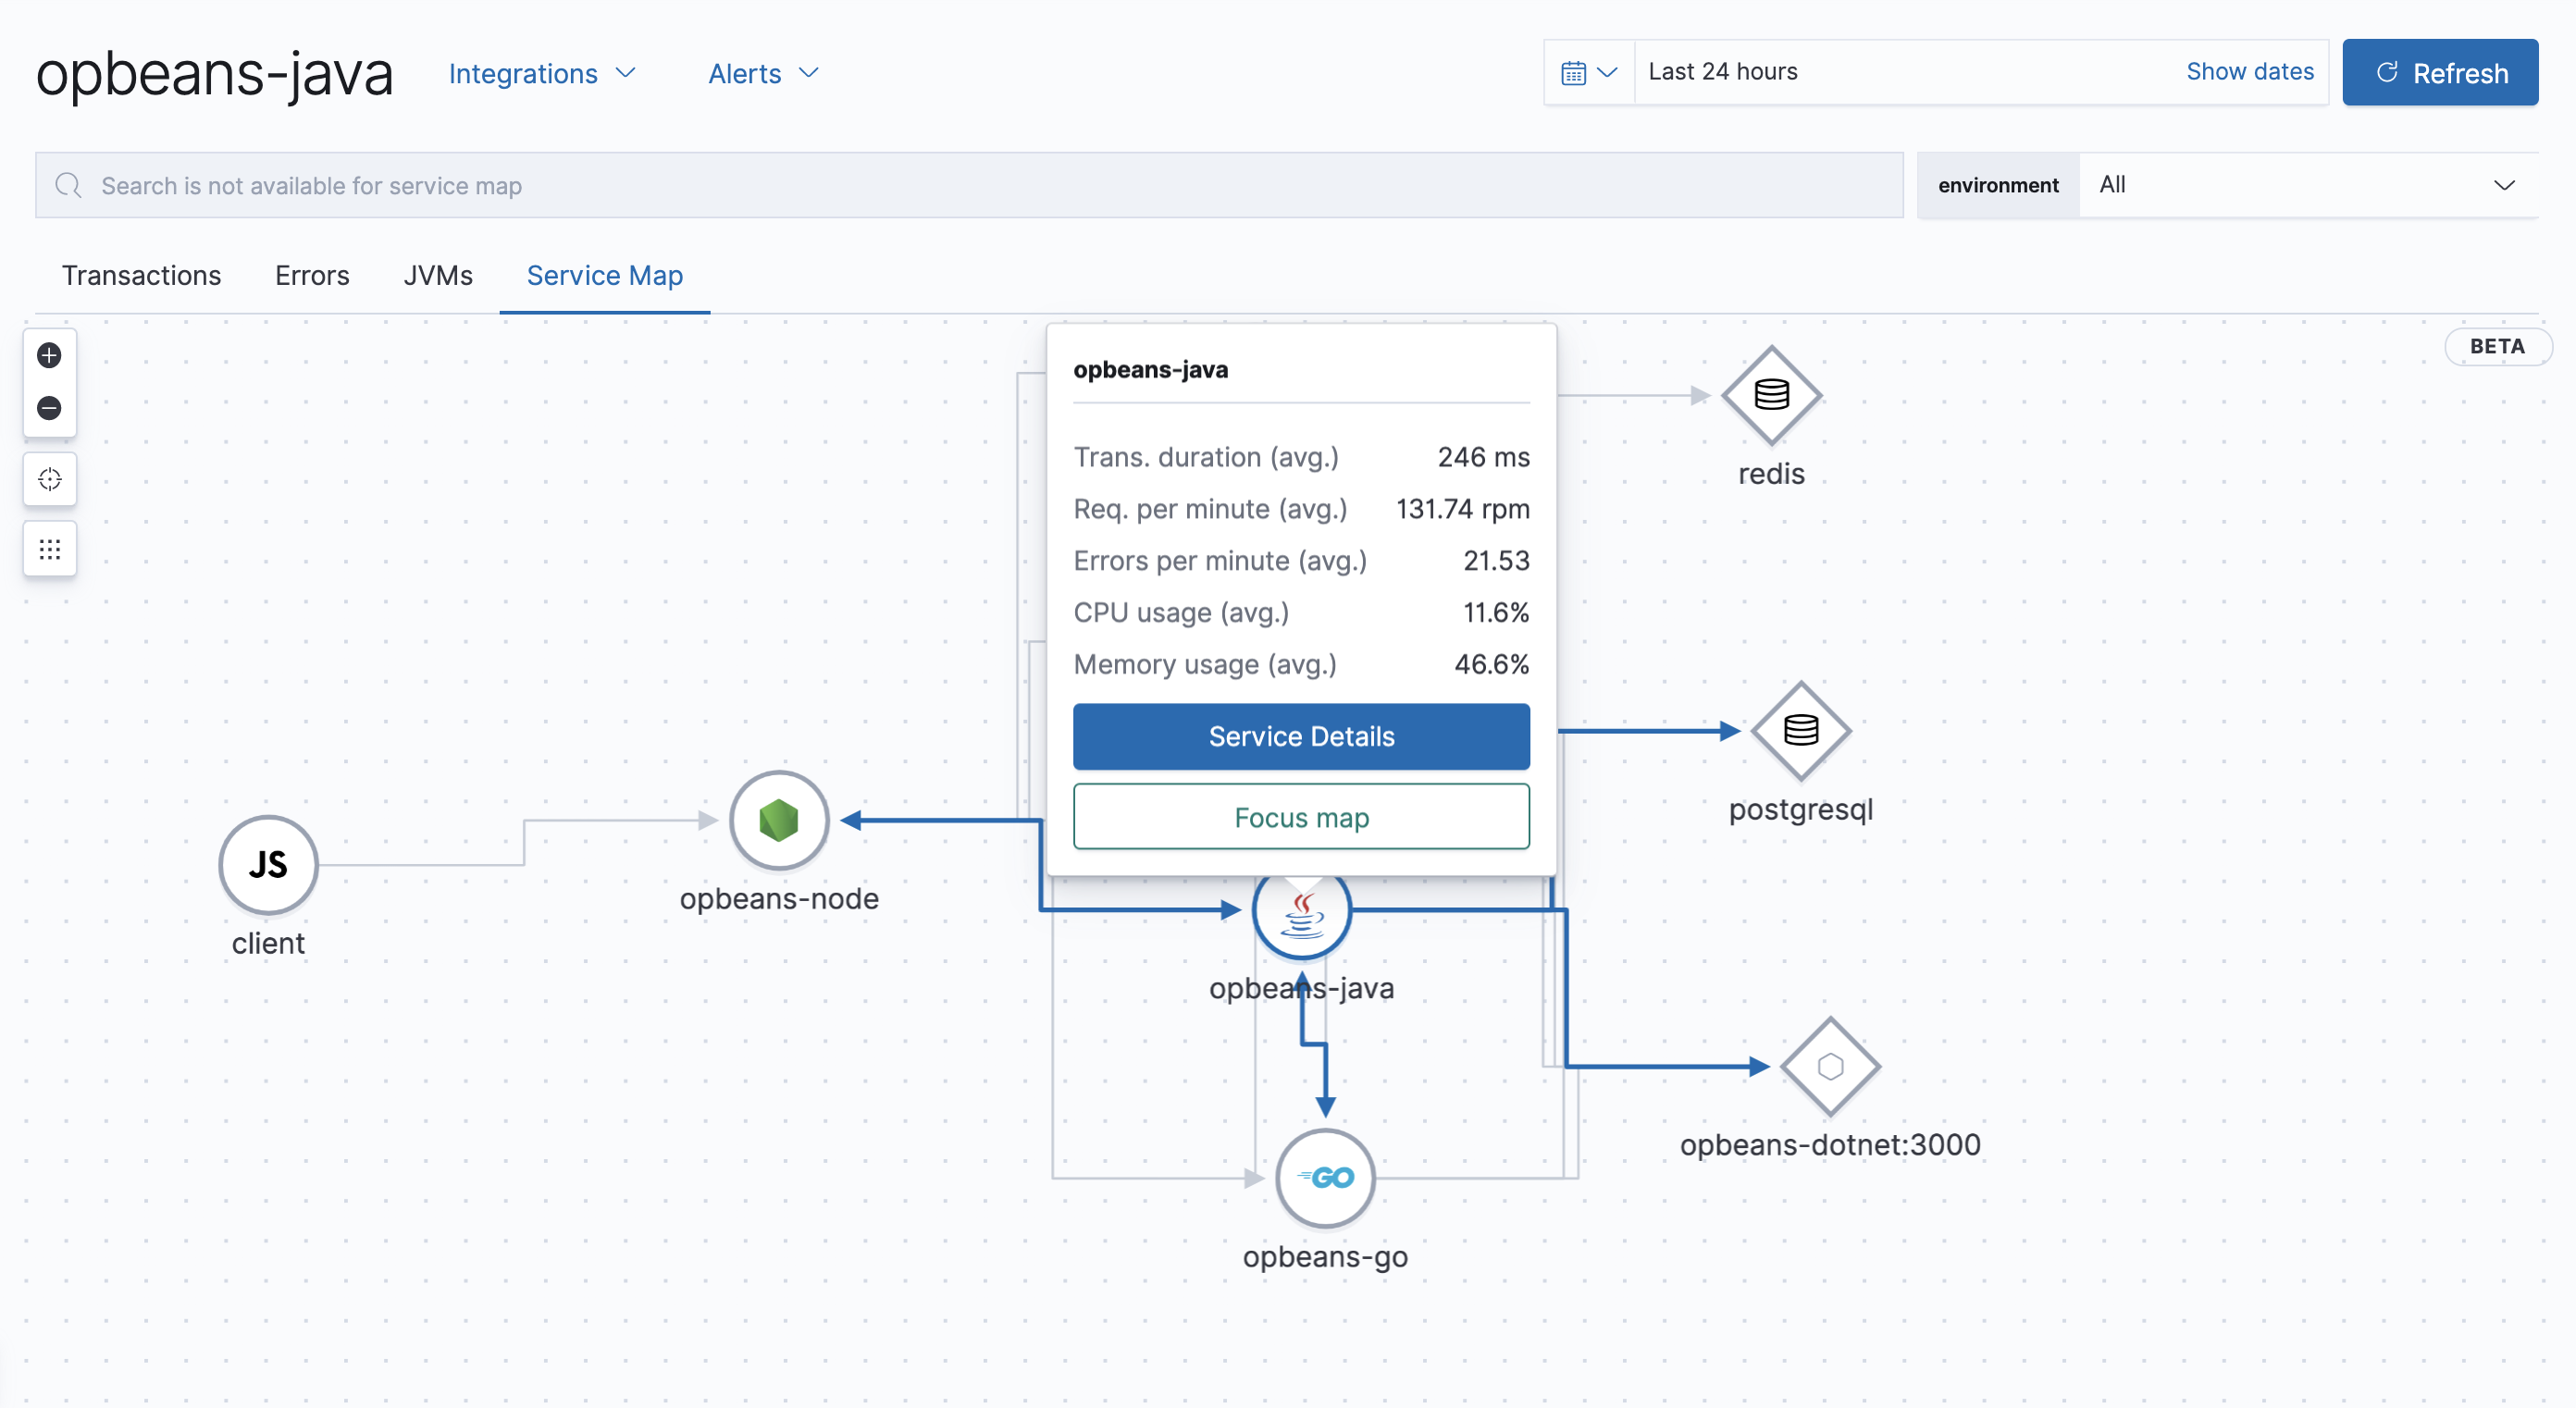
Service maps are now available in the APM app. A service map is a real-time visual representation of the instrumented services in your application’s architecture. It shows you how these services are connected, along with high-level metrics like average transaction duration, requests per minute, and errors per minute, that allow you to quickly assess the status of your services.
- Alerting
-
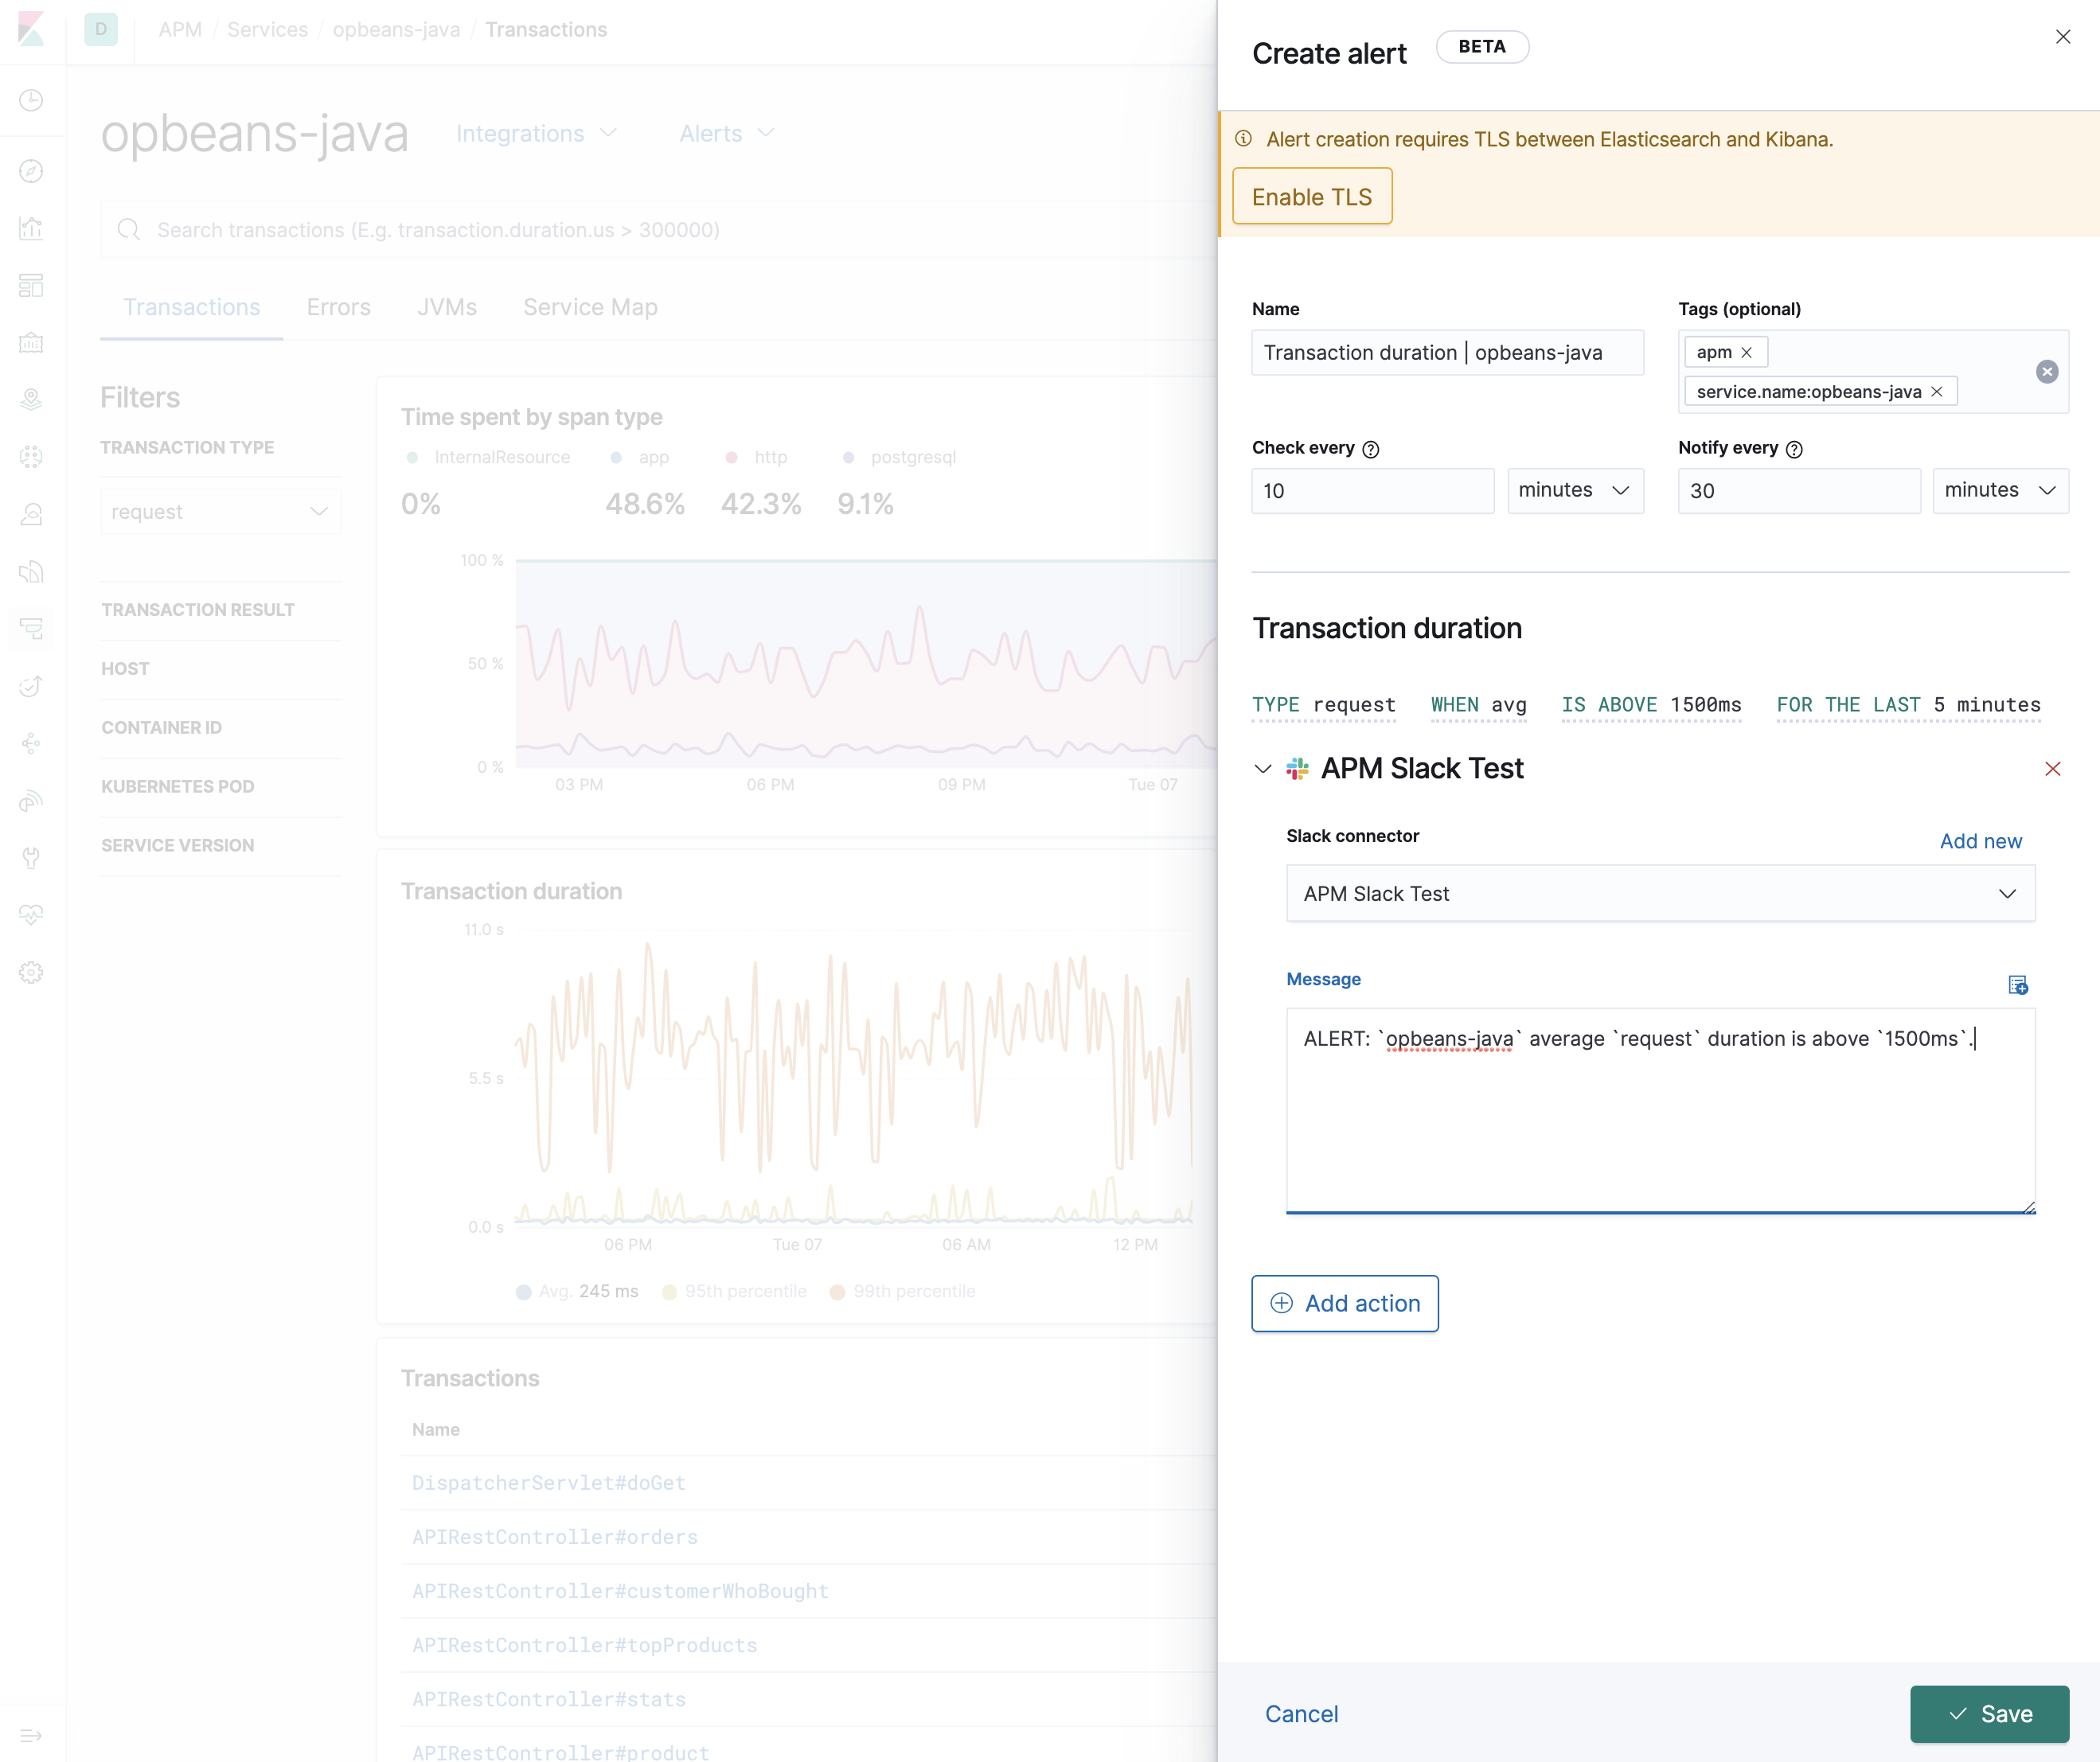
Want to receive an email when the duration of your transactions are slower than a set threshold? How about a slack message when your application’s error rate spikes? Now you can! The APM app integrates with Kibana’s alerting and actions feature. It provides a set of built-in actions and APM specific threshold alerts for you to easily set up and use.
- APM Agent central configuration
-
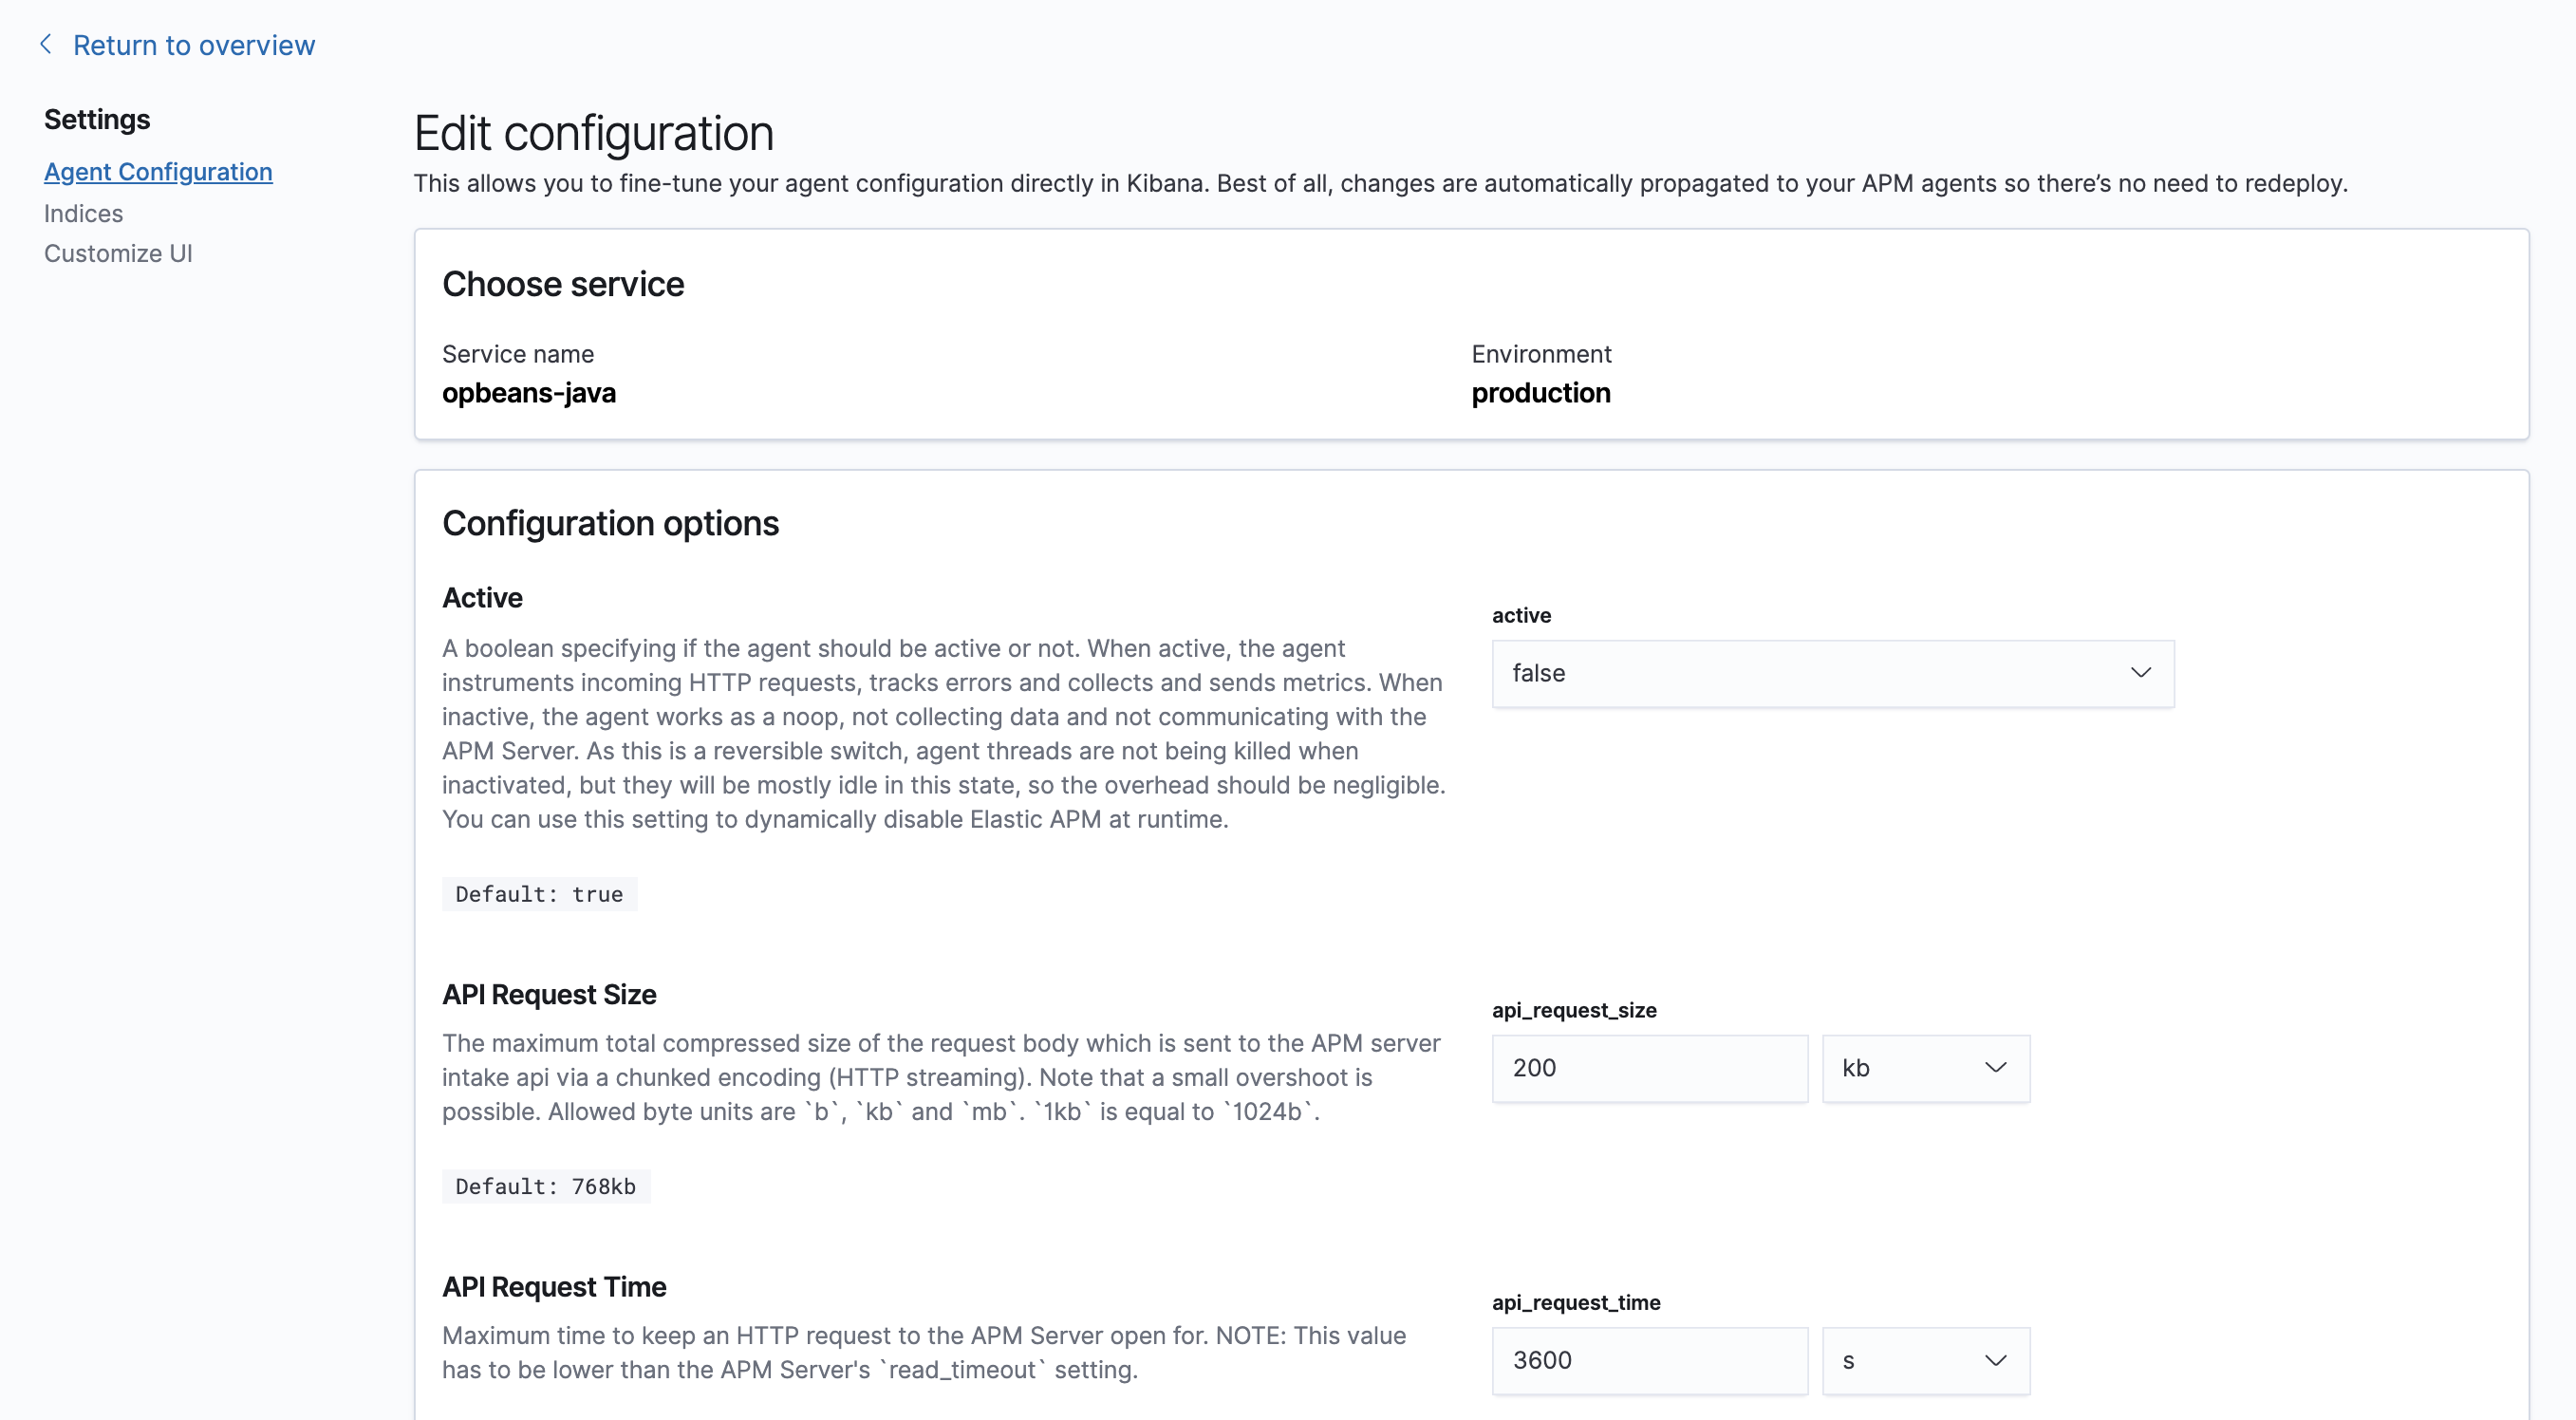
Central configuration now supports even more configuration options, so you can fine-tune your agents without needing to redeploy. Open up the configuration page in the APM app for a list of all supported options.
- Custom links
-
Elastic’s custom links feature allows you to easily create up to 500 dynamic links based on your specific APM data. Custom links can be filtered to only appear in the APM app for relevant services, environments, transaction types, or transaction names.
Need ideas? Recipes for setting up custom links for emails, GitHub issues, Jira tasks, and more are available in the documentation.
- Inferred spans with async profiler
- Identifying a problematic service is only half of the battle when diagnosing application slowdowns. The Elastic APM Java Agent provides a new way to get method-level insights into your code: inferred spans with async-profiler. This can help you diagnose slow requests due to heavy computations, inefficient algorithms, or similar problems not related to interactions between services.